If you've ever rushed to a cement plant at odd hours because of an injury report, you already know — safety data buried in spreadsheets doesn't protect anyone. The cement industry remains one of the most hazardous manufacturing environments, where 79% of workplace fatalities trace back to just three causes: mobile equipment incidents, falls from height, and workers caught in moving machinery. These aren't freak accidents. They follow patterns — patterns that a real-time EHS dashboard can spot weeks before an incident happens. Most plants still rely on monthly safety reviews and paper-based reporting, reacting after someone gets hurt instead of preventing it. A health and safety KPI dashboard changes that equation entirely, giving you live visibility into what's working, what's slipping, and where the next incident is likely to come from. If your plant is still tracking safety manually, book a quick demo to see how digital EHS monitoring works in practice.
79%
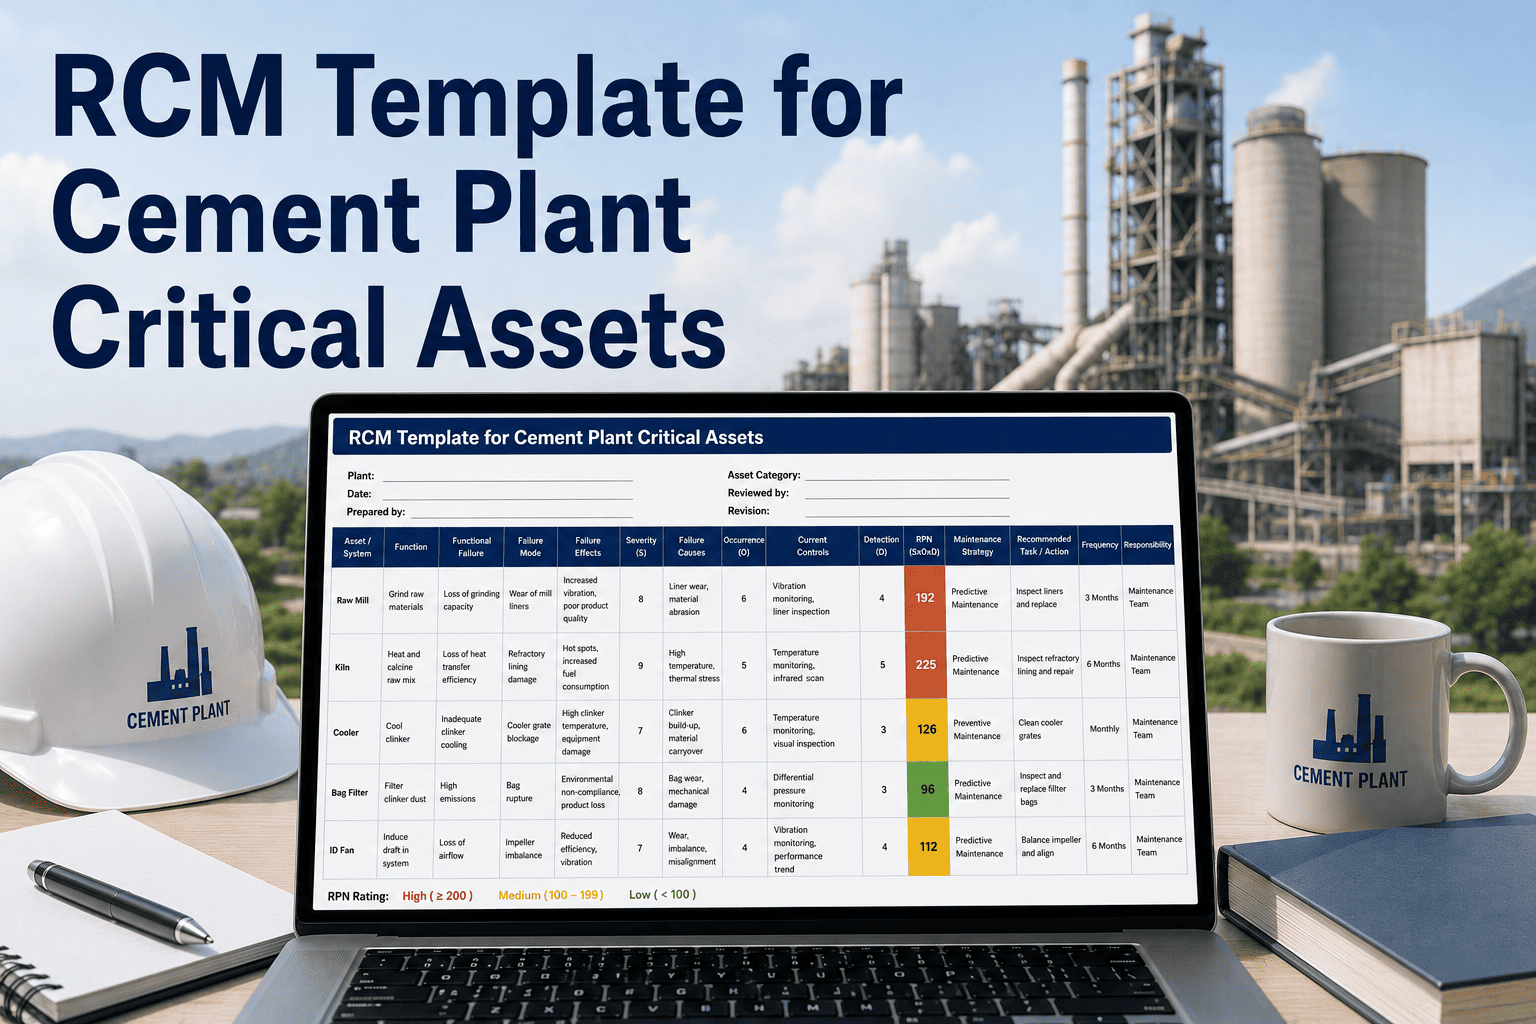
of cement plant fatalities come from just 3 causes
29%
of injuries are slips, trips, and falls
$4-$6
saved for every $1 invested in safety programs
40%
incident reduction with digital EHS dashboards
What Is a Health & Safety KPI Dashboard?
A health and safety KPI dashboard is a centralized, real-time digital display that consolidates all your critical EHS (Environment, Health, and Safety) metrics into one visual interface. Instead of digging through spreadsheets, waiting for monthly reports, or relying on verbal updates during shift handovers, your entire safety picture is available at a glance—accessible from the control room, the plant floor, or your phone.
For cement plants specifically, this means tracking everything from dust exposure levels and kiln area hazards to contractor compliance and near-miss trends—all updating in real time as data flows in from the field.
Real-Time EHS Dashboard View
TRIR
1.82
12% vs last quarter
LTIR
0.45
23% vs last quarter
DART Rate
0.91
8% vs last quarter
Near Misses
47
35% reporting increase
Safety Observations This Month
The 12 Safety KPIs Every Cement Plant Must Track
Not all KPIs are created equal. The most effective safety dashboards balance lagging indicators (what already happened) with leading indicators (what's about to happen). Here's the essential framework:
Measuring past performance
TRIR (Total Recordable Incident Rate)
Recordable Incidents x 200,000 / Total Hours Worked
Benchmark: < 2.5 for cement
LTIR (Lost Time Injury Rate)
Lost Time Injuries x 200,000 / Total Hours Worked
Benchmark: < 0.5 for top performers
DART Rate
DART Cases x 200,000 / Total Hours Worked
Benchmark: < 1.5 for manufacturing
Severity Rate
Lost Workdays x 200,000 / Total Hours Worked
Lower = less severe injuries
First Aid Cases
Track volume and type monthly
Early warning for trends
Incident Cost
Direct + Indirect costs per incident
Track for ROI analysis
Predicting future outcomes
Near-Miss Reports
Near misses reported per month
Target: 10x recordable incidents
Safety Observations
Observations completed vs planned
Target: 100% completion rate
Training Completion Rate
Employees trained / Total employees x 100
Target: > 95%
Open Corrective Actions
Overdue CAPAs / Total CAPAs x 100
Target: < 5% overdue
Safety Audit Score
Audit findings closed on time (%)
Target: > 90% closure rate
Permit-to-Work Compliance
Valid permits / Total active work orders
Target: 100% for high-risk work
Track All 12 KPIs in One Dashboard
Oxmaint's EHS module gives you real-time visibility into every safety metric that matters—configured for cement operations out of the box.
Cement-Specific Safety Hazards to Monitor
Generic safety dashboards miss what makes cement plants uniquely dangerous. Your EHS dashboard should be configured around the specific hazard zones and risk categories that drive incidents in cement manufacturing.
Rock falls and slope failureHigh
Mobile equipment collisionsHigh
Respirable dust exposureMedium
Noise-induced hearing lossMedium
Burns from extreme heat (1450°C+)Critical
CO and toxic gas exposureHigh
Refractory collapse during maintenanceHigh
Confined space entry hazardsCritical
Rotating equipment entanglementHigh
Silica dust (crystalline)High
Noise exposure (>85 dB)Medium
Explosion risk in coal millCritical
Manual handling injuriesMedium
Vehicle-pedestrian interactionHigh
Cement dust skin/eye contactMedium
Fall from loading platformsHigh
Leading vs. Lagging: Why the Balance Matters
Most plants over-rely on lagging indicators—TRIR, LTIR, and severity rates. These tell you what already went wrong. By the time a lagging indicator spikes, someone is already hurt. Leading indicators are your early warning system. They tell you when conditions are deteriorating before an incident occurs.
Reactive—you learn after injuries happen
Creates fear-based underreporting
Tells you "what" but not "why"
Can encourage hiding minor incidents
+
Proactive—catch risks before injuries
Encourages open reporting culture
Reveals root causes and patterns
Drives continuous improvement cycle
1 : 10 : 30 : 300
Serious Injury
Minor Injuries
Near Misses
Unsafe Acts
Heinrich's Safety Pyramid: For every serious injury, there are roughly 300 unsafe acts. A digital dashboard captures the base of the pyramid—where prevention happens.
5 Dashboard Views Your Plant Needs
One dashboard doesn't fit all. Different roles in your cement plant need different views of the same safety data. Here's how to configure your EHS dashboard for maximum impact:
01
Plant Manager Overview
High-level KPI summary with TRIR/LTIR trends, open action items, compliance status, and month-over-month comparisons. One screen, full picture.
TRIR trendLTIR trendOpen CAPAsCompliance %
02
EHS Manager Operational
Detailed incident pipeline, investigation status, near-miss analysis, training tracker, and audit schedule with drill-down capability.
Incident pipelineCAPA agingAudit scoresTraining gaps
03
Shift Supervisor Real-Time
Active permits to work, current hazard alerts, today's safety observations needed, and live status of high-risk maintenance activities.
Active PTWsToday's tasksHazard alertsCrew status
04
Maintenance Safety
Equipment isolation status, lockout/tagout compliance, confined space entries active, and hot work permits in progress.
LOTO statusHot workConfined spaceIsolation log
05
Corporate/Multi-Plant
Benchmarking across plants, corporate KPI rollup, regulatory compliance status by site, and safety culture scores.
Plant rankingRollup KPIsCompliance mapCulture score
From Spreadsheets to Real-Time: The Transformation
Data freshness
Weekly or monthly updates
Real-time, auto-updating
Incident reporting
Paper forms, days to process
Mobile capture, instant alerts
Near-miss tracking
Low reporting, no analysis
Easy reporting, trend analysis
KPI calculation
Manual formulas, error-prone
Auto-calculated, always accurate
Root cause analysis
Delayed, inconsistent
Structured, pattern detection
Audit readiness
Scramble before inspections
Always audit-ready
Corrective actions
Lost in email chains
Tracked, escalated, accountable
60%
faster incident reporting
3x
increase in near-miss reports
45%
reduction in repeat incidents
80%
less time on safety reporting
Implementation Roadmap
Talk to our EHS experts to plan your cement plant's safety dashboard deployment.
Week 1-2
Define & Configure
Identify your top 12 KPIs, configure dashboard views by role, set alert thresholds for critical metrics, and map data sources from existing systems.
Week 3-4
Connect & Integrate
Link your CMMS, DCS, and existing safety tools. Set up mobile incident reporting. Configure automated workflows for escalation and CAPA assignment.
Week 5-6
Train & Launch
Train supervisors and EHS team on dashboard usage. Deploy mobile app to field workers. Begin live near-miss and observation reporting.
Week 7-8
Optimize & Scale
Review initial data, refine alert thresholds, add predictive analytics. Expand to contractor safety tracking and multi-plant benchmarking.
Make Safety Visible. Make It Actionable.
Oxmaint's EHS Dashboard gives cement plants real-time visibility into every safety KPI that matters—from TRIR and LTIR to near-miss trends and corrective action tracking. Purpose-built for heavy industry.
Frequently Asked Questions
What is a good TRIR for a cement plant?
The average TRIR for manufacturing is 2.8 per 100 full-time workers. Top-performing cement plants achieve TRIR below 1.5. Your target should be year-over-year reduction, with an ultimate goal of reaching top-quartile performance for your region and plant size.
How is LTIR different from TRIR?
TRIR captures all recordable incidents—including medical treatment, restricted duty, and lost time cases. LTIR only counts incidents where the worker missed one or more full workdays. LTIR is always less than or equal to TRIR. Together they show both frequency (TRIR) and severity (LTIR) of your safety performance.
Why are near-miss reports a leading indicator?
Near misses are events that could have caused injury but didn't. A high near-miss reporting rate is actually positive—it means your workforce is engaged and identifying hazards proactively. Research shows organizations with strong near-miss programs see 30-50% fewer recordable incidents over time.
Can Oxmaint integrate with our existing DCS and CMMS?
Yes. Oxmaint connects to legacy systems via standard protocols (OPC, REST APIs, CSV imports). Most cement plants get their EHS dashboard live within 4-6 weeks without replacing any existing automation or maintenance systems.
How does a safety dashboard help with OSHA compliance?
The dashboard automatically calculates OSHA-required metrics (TRIR, DART), maintains digital records of all incidents and investigations, tracks corrective actions to closure, and generates audit-ready reports on demand. You go from scrambling before inspections to being always prepared.