Cement plants run on continuous processes, so every hour of kiln stoppage or mill derating is visible in tonnes lost. The production system knows what was made and when output fell, while the maintenance system knows what failed and what was repaired. When the two records disagree, nobody can say with confidence why output dropped or how much it cost. Joining production and maintenance data turns downtime from an argument into evidence. This guide covers how cement teams connect MES and CMMS records, and you can try Oxmaint free to build the maintenance side of that link.
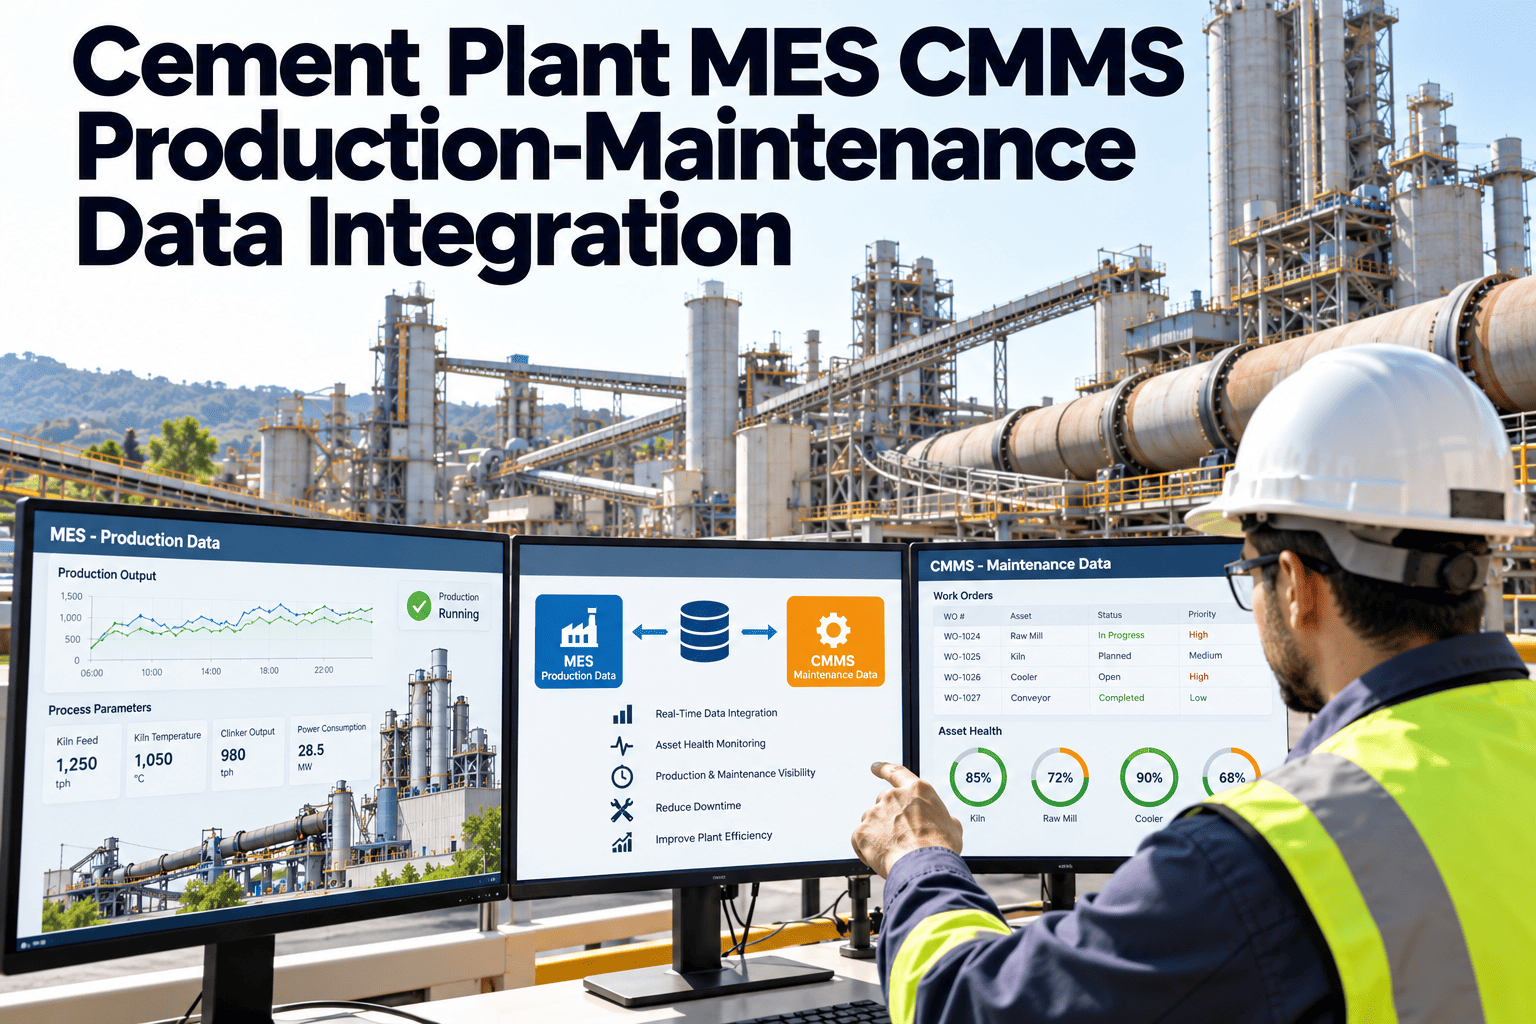
Cement Plant MES CMMS Production-Maintenance Data Integration
Link production events, downtime reasons and maintenance work so reliability, energy and quality decisions rest on one version of the truth.
MESOutput, stops, grades, quality holds
Stop event and reason
CMMSWork orders, parts, labour, failure codes
Repair record and cost
Shared analysisLoss per cause, cost per tonne, repeat failures
The gap between the control room and the workshop
Production log: kiln stopped for 6 hours, reason typed as mechanical.
Maintenance log: three work orders, two different assets, one still open.
Production log: raw mill output reduced for a shift.
Maintenance log: no record, because the fix was made informally.
Production log: stop reason recorded under a generic category.
Maintenance log: failure code recorded under a different list.
Each mismatch looks small, yet together they stop plants from ranking their losses. Without a shared reason code and a shared asset ID, the biggest losses stay hidden.
What each system should own
| Data | Owner | Shared with the other system |
|---|---|---|
| Production plan, grades and output | MES | Planned stops and priority, so maintenance can choose windows |
| Stop and slowdown events | MES, with operator confirmation | Start time, end time, equipment and first reason |
| Quality holds and deviations | MES or lab system | Equipment linked to the deviation, for investigation work |
| Asset register and hierarchy | CMMS | Asset IDs used in every production record |
| Work orders, labour and parts | CMMS | Work order numbers attached to stop events |
| Failure codes and root causes | CMMS | Codes mapped to production loss reasons |
| Inspection records | CMMS | Findings that affect production risk |
Four integration scenarios that deliver value first
- 1
Stop event creates or links a work order
A stop on a kiln feed, mill or cooler fan is tied to a work order, so every minute of loss has a repair record. - 2
Planned stops open maintenance windows
Planned production stops appear in the maintenance calendar, so inspections and PM tasks use them. - 3
Quality deviation triggers an equipment check
Repeated fineness or chemistry drift linked to equipment raises an inspection task. - 4
Run hours and tonnage drive PM
Counters from production update meters in the CMMS, so tasks follow actual use.
Put one asset ID behind every production loss
Start with a clean asset list and shared reason codes, and connect work orders to the events that matter.
Build a shared loss tree
A loss tree gives both teams the same categories. Keep it shallow, so operators can select a reason in seconds during a stop.
Lost production time
Planned
Scheduled maintenance
Refractory work
Market or grade changeover
Unplanned equipment
Mechanical failure
Electrical or control fault
Lubrication or cooling issue
Process
Coating or blockage
Raw material variation
Fuel or feed interruption
External
Power or utility loss
Logistics or storage limit
Regulatory or environmental stop
Where integration pays off along the cement line
| Area | Production signal | Maintenance link |
|---|---|---|
| Crusher and raw mill | Throughput drop, motor load, vibration trend | Liner inspection, bearing checks and lubrication tasks by running hours |
| Kiln and preheater | Feed rate, stoppages, blockages | Drive, support roller and cyclone inspection work orders |
| Clinker cooler | Cooler pressure and temperature trends, fan load | Fan alignment, grate and hydraulic drive tasks |
| Cement mill and separator | Output, fineness variation, power use | Gearbox, bearing and separator inspections linked to quality drift |
| Packing and dispatch | Bag counts, stoppages, truck queues | Packer, conveyor and bag filter maintenance by cycles and hours |
| Utilities | Energy per tonne, compressed air pressure | Leak, filter and motor tasks linked to energy loss |
Metrics that only work when the two systems agree
Unplanned downtime by cause
Ranked by hours and by tonnes lost, with each event linked to a work order.
Mean time between failures
Calculated from real stop events on each critical asset.
Mean time to repair
From stop start to return to production, split into waiting and working time.
Maintenance cost per tonne
Labour, parts and contractors divided by tonnes of clinker or cement produced.
PM compliance and breakdown ratio
Planned work against reactive work, trended by area.
Take care with OEE. Availability, performance and quality losses need consistent definitions in both systems before the number is meaningful.
Integration approaches compared
| Approach | How it works | Strength | Trade-off |
|---|---|---|---|
| Manual cross-reference | Operators and planners enter the work order number in the stop record | No technology needed, fast to start | Depends on discipline, and gaps are common |
| Scheduled data exchange | Files or tables are exchanged at fixed intervals | Simple and robust for daily reporting | Not real time, silent failures if unchecked |
| API or message based | Events and records move between systems through interfaces | Near real time, supports automation | Needs design, testing and monitoring |
| Middleware platform | An integration layer sits between several systems | Scales across plants | More cost and more skills to maintain |
Begin with the lightest approach that gives a reliable link. Many plants prove value with a daily exchange before moving to near real-time interfaces.
Data readiness checklist
- One asset list, with IDs shared by the MES, historian and CMMS.
- One reason code list, mapped between production losses and failure codes.
- Clock synchronisation between systems, so events line up in time.
- Defined rules for which stop duration or capacity loss requires a work order.
- Named data owner for each field in each system.
- Review of duplicate or retired assets before any link is built.
- A fallback process for when an interface is down.
Typical problems and fixes
Operators choose the first reason on the list.
Shorten the list, add examples and review a sample of events each week with the shift team.
Short stops never get a work order.
Set a threshold, and log micro-stops through a lightweight form or reason summary.
Maintenance closes work orders weeks later.
Require closure with failure code and findings before the next review, using mobile entry.
Two systems show different downtime hours.
Decide which source is official, and reconcile the difference every month.
What operators and technicians should see in their daily tools
- Operators select a stop reason from a short list and see the linked work order status without leaving the screen.
- Technicians open the work order on a phone or tablet and see the stop time, the asset history and the last findings.
- Planners see open stop events with no work order, so nothing falls between the two logs.
- Supervisors see the day's downtime and the jobs still blocking restart on one summary view.
If either crew finds the process slower than before, the data quality will fall. Design the entry steps with them, and test on a real shift.
A staged rollout for a cement plant
Stage 1
Align the vocabulary
Agree the asset list, loss tree and ownership with production, maintenance and IT.
Stage 2
Link the critical line
Connect kiln, mills and coolers first, with stop events tied to work orders.
Stage 3
Add counters and windows
Feed run hours and tonnage into PM triggers, and share planned stops with maintenance.
Stage 4
Review and extend
Hold a monthly loss review, tune the rules and extend to packing and utilities.
Reconstructing a kiln stop with linked records
This sequence is illustrative, not a customer case. It shows how linked records answer questions that separate logs cannot.
- 1
Event
The MES records a kiln feed stop at a given time, with an initial reason of mechanical fault. - 2
Link
A work order is raised against the kiln feed asset, and its number is attached to the stop event. - 3
Repair
Technicians record the failed part, the cause, the labour hours and the parts used on the same order. - 4
Analysis
The monthly review sees repeated stops on that asset, tagged with the same cause, and plans a design fix.
Linking energy and quality to maintenance records
Energy signals
- Specific power consumption rising on a mill or fan can point to wear, leakage or poor alignment.
- Compressed air demand growth can flag leaks that deserve a work order.
- Peak demand events can be tied to starts, restarts and process upsets.
Quality signals
- Fineness variation can trace to separator, mill or feed equipment condition.
- Free lime or chemistry drift can trace to feed system or kiln stability issues.
- Repeated quality holds on the same line can justify an inspection task.
Not every signal is a maintenance problem. The point is to make it easy to check, and to record the answer against the equipment.
Allocating cost to tonnes in a defensible way
| Cost element | Source | Allocation approach |
|---|---|---|
| Internal labour | CMMS work order hours | Charge to the asset, then roll up to the production area |
| Spare parts and consumables | CMMS inventory issues | Charge to the work order and asset, using the stock valuation method |
| Contractor services | Purchase orders linked to work orders | Link every invoice to a work order or shutdown package |
| Lost production | MES stop events | Report as hours and tonnes, and add margin only when finance agrees the method |
| Energy waste | Energy monitoring | Track separately and link to work orders where a cause is found |
Planning maintenance windows with production data
Without the link: planners learn about a stop from the radio and miss the chance to use it.
With the link: the planned stop appears in the maintenance calendar, and a ready list of jobs is offered to the shift.
Without the link: a silo is full, the kiln slows, and nobody records the opportunity for short jobs.
With the link: the slowdown is logged, and a short job list is released for the crew on duty.
Without the link: parts for the window arrive after the stop has ended.
With the link: parts are reserved against jobs as soon as a window is confirmed.
Shorter jobs that wait for a window are the most common place where a connected plan returns hours to production.
Governance that keeps the link healthy
Roles
- Reliability lead owns failure codes and the loss tree mapping.
- Production lead owns stop reasons and shift discipline.
- IT or automation lead owns interfaces, security and monitoring.
- Finance partner agrees how cost and loss are reported.
Routines
- Weekly check of unmatched stop events and open work orders.
- Monthly loss review with production and maintenance together.
- Quarterly review of codes, rules and interface health.
- Change control for any new asset, code or interface.
Risks and how to reduce them
| Risk | Impact | Mitigation |
|---|---|---|
| Different asset names in each system | Events cannot be matched | Build one mapping table and lock changes behind a request process |
| Too many reason codes | Operators pick quickly and inaccurately | Reduce the list and train with real examples |
| Interface fails without notice | Data gaps appear in analysis | Monitor each job and alert the owner |
| Access to production networks | Security exposure | Use segmented networks and read-only access where possible |
| Resistance from crews | Low-quality entries | Keep forms short, show how the data helps them and fix their top complaints first |
Monthly production and maintenance review agenda
- Top five loss causes by hours and by tonnes, with linked work orders.
- Repeat failures by asset and what has changed since the last review.
- Planned and reactive work ratio, and overdue preventive tasks on critical assets.
- Stop events with no matching work order, and the reasons.
- Upcoming planned stops and the maintenance jobs reserved for them.
- Actions with owners and dates, carried into the next meeting.
How Oxmaint supports the maintenance side
- Asset management provides a single hierarchy that production and engineering teams can refer to.
- Work orders capture failure codes, labour, parts and findings against each stop.
- Preventive maintenance can follow meter readings such as running hours or throughput.
- Mobile workflows let technicians close jobs at the equipment with notes and photos.
- Dashboards and reports show downtime causes, repeat failures and planned compared with reactive work.
The connection method depends on your MES and network design, so confirm interface options in a demo before agreeing a scope.
Frequently asked questions
Do we need real-time integration to start?
No. A daily exchange with shared IDs and reason codes already improves analysis.
Which system should store downtime reasons?
The MES usually records the first reason, and the CMMS records the confirmed cause. Map them to each other.
How do we handle plants with no MES?
Use control room logs or a simple production form. Start with work orders and add the link later.
Which assets should we connect first?
Choose kiln-critical and mill-critical equipment where a stop removes production directly.
Can maintenance use production counters for PM?
Yes, running hours and tonnage can drive tasks. Book a demo to see meter-based scheduling.
Make every stop explain itself
Connect production events, asset records and repair history, and give cement teams one shared view of reliability.