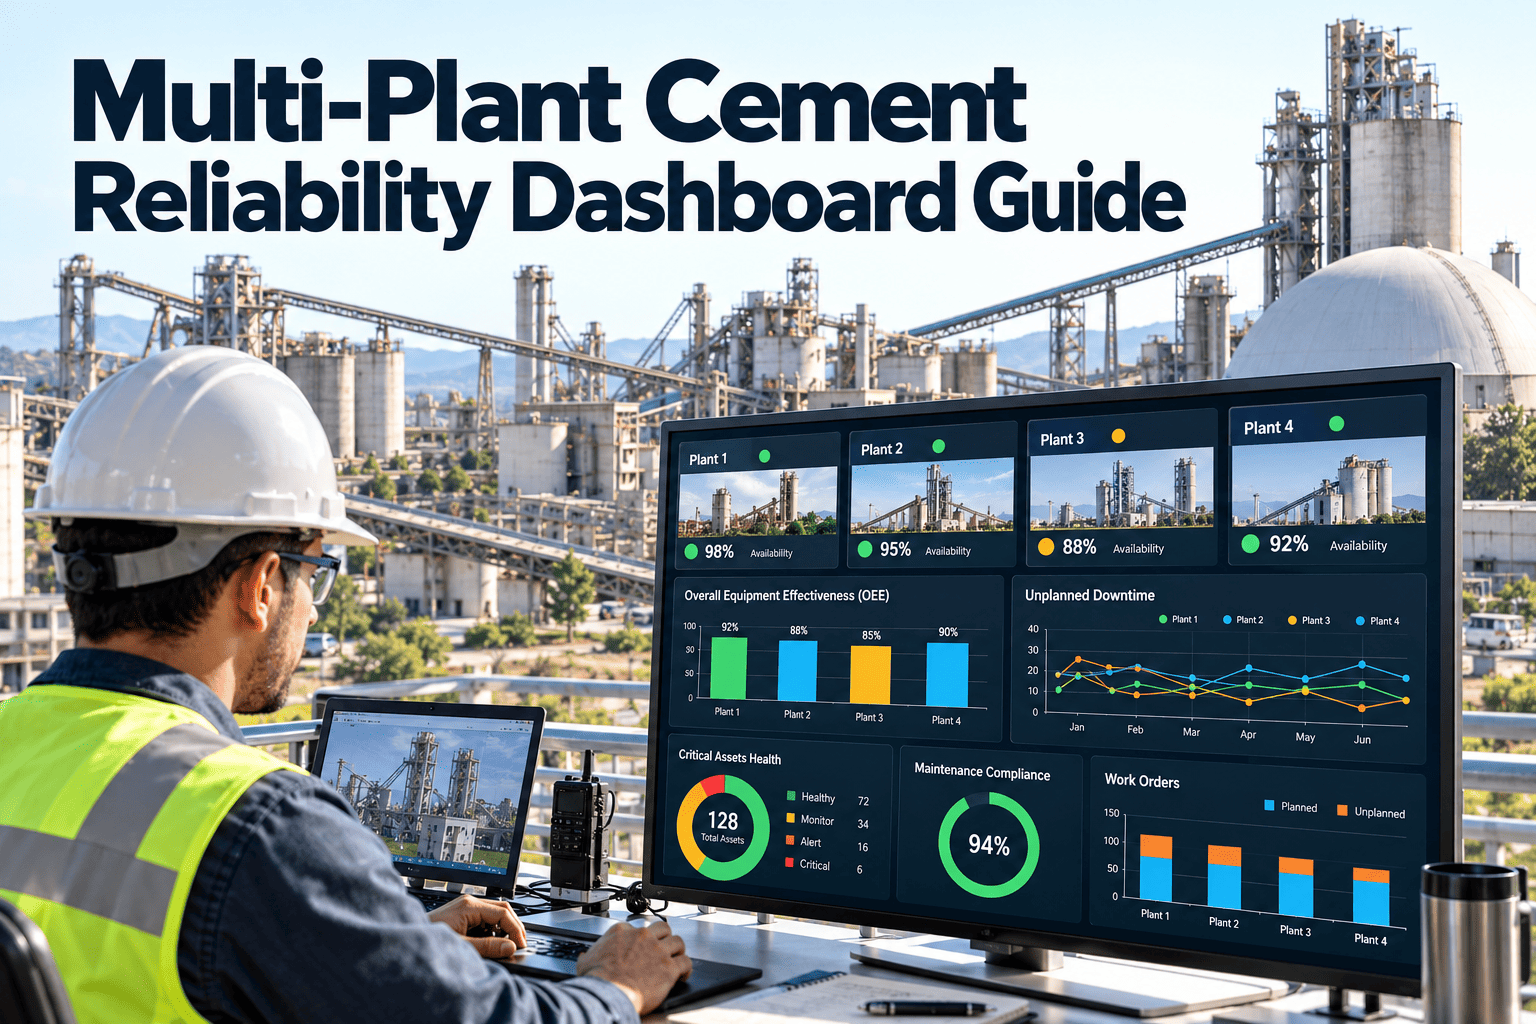
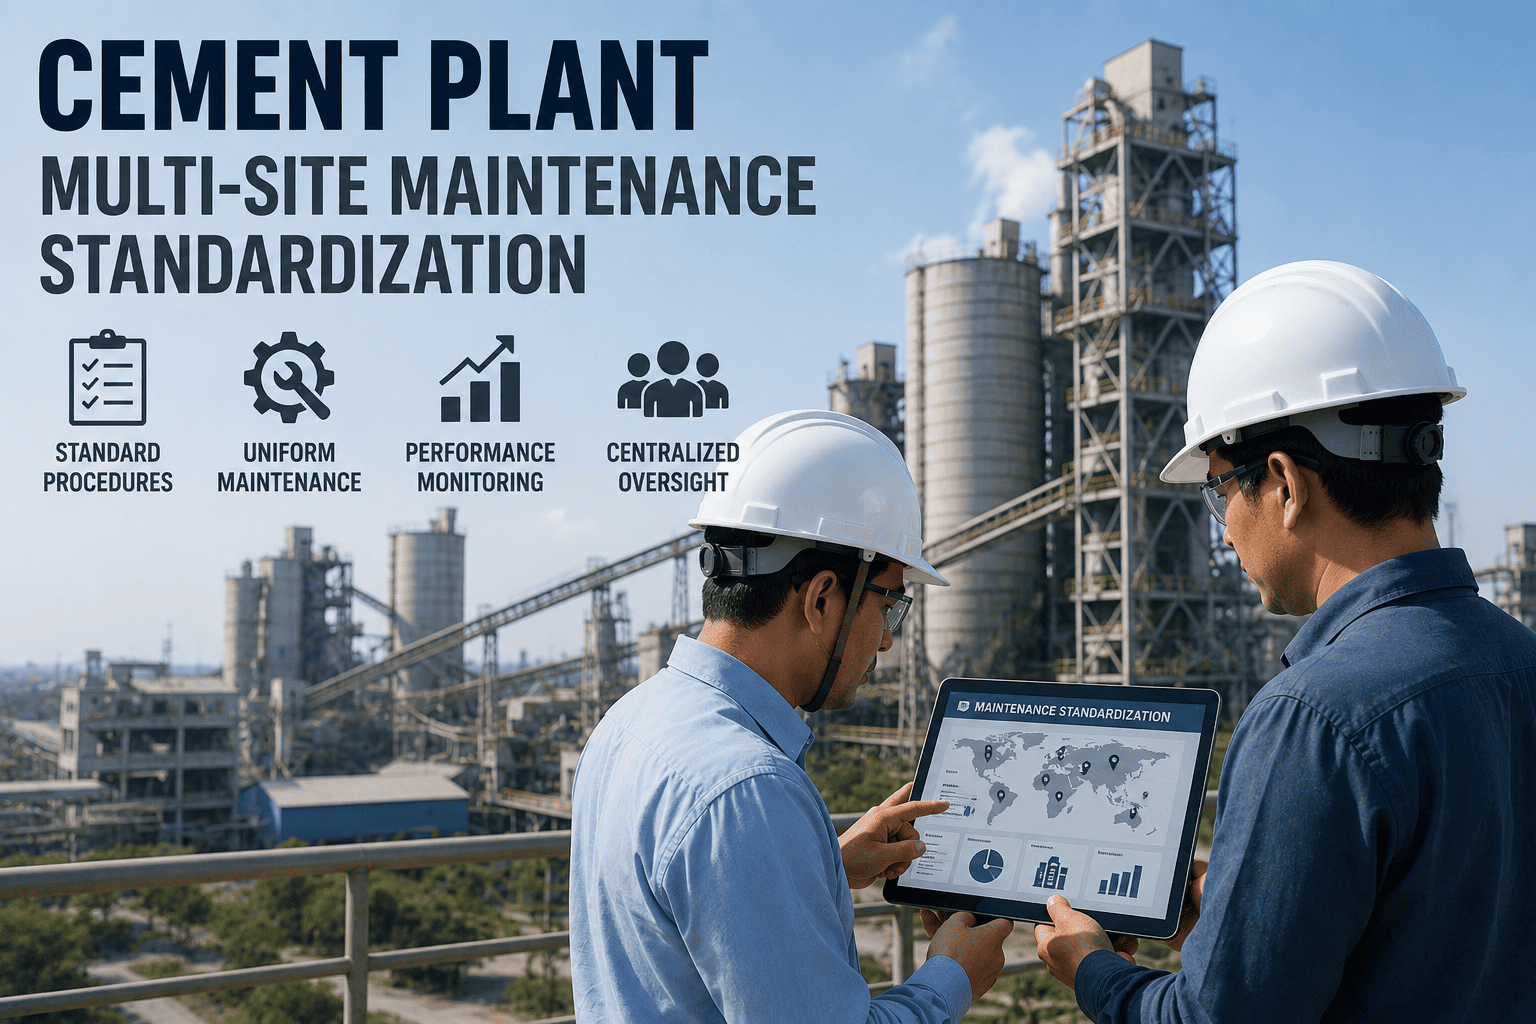
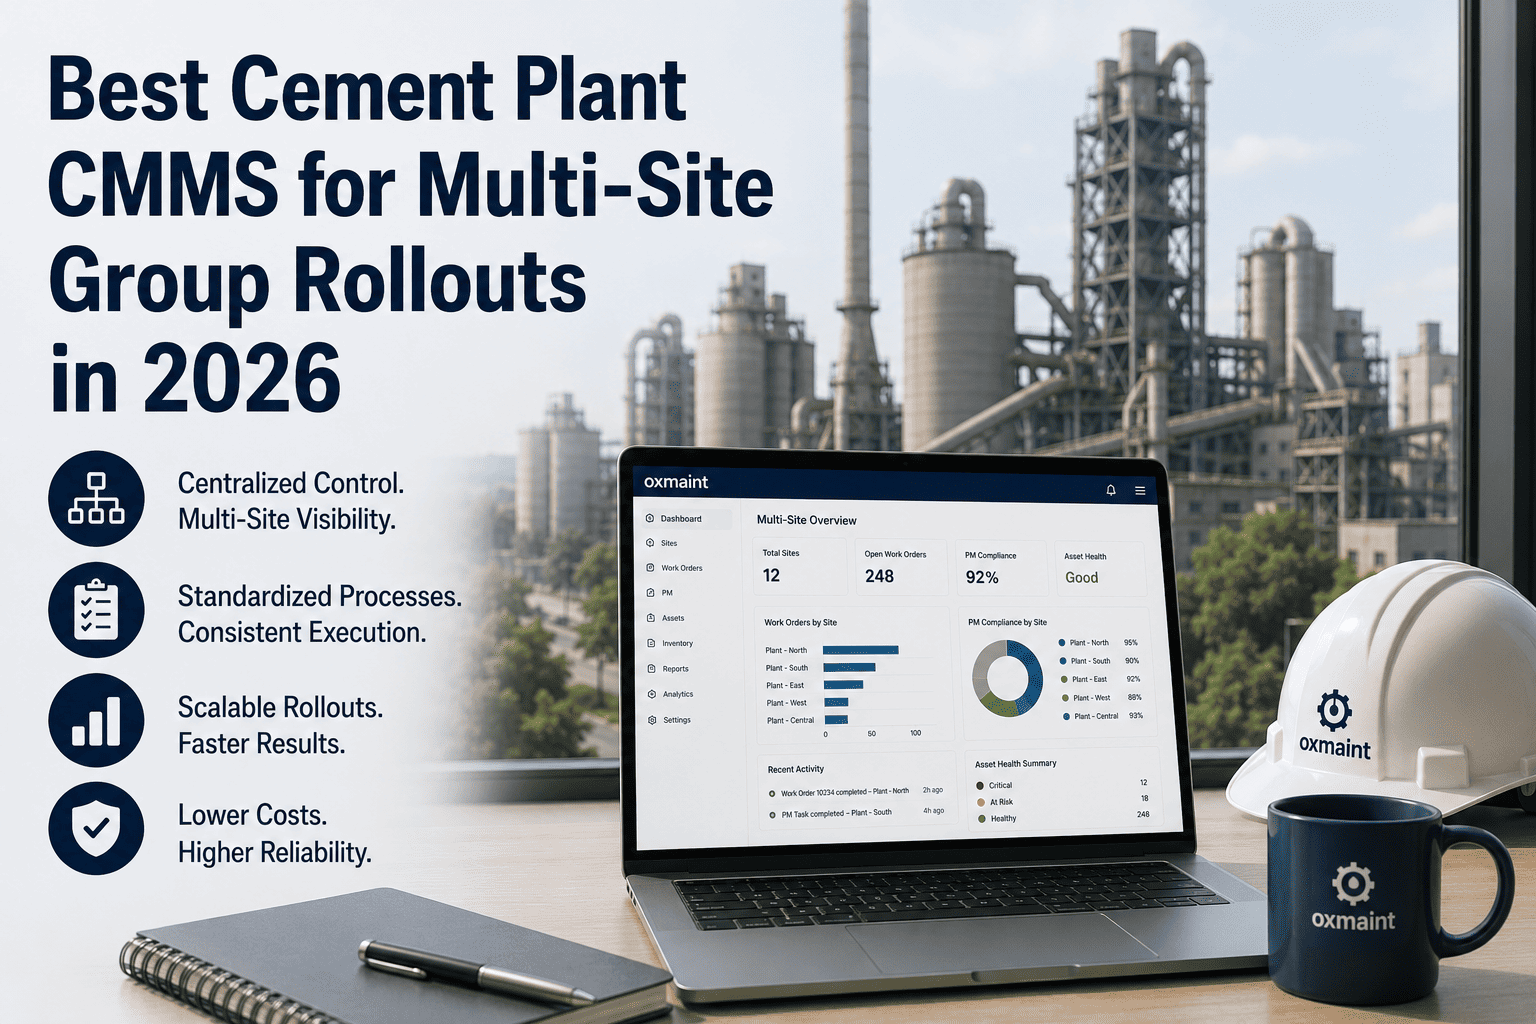
A cement group operating five plants across three countries doesn't have a maintenance problem — it has five separate maintenance problems, each invisible to the others. The highest-performing plant in the portfolio is running 83% OEE. The lowest is at 61%. Nobody at group level knows why, because there is no shared data, no normalized KPI framework, and no way to compare what "good maintenance" actually looks like across sites. Procurement happens in silos. Spare parts are duplicated across stores. And when one plant solves a kiln bearing failure brilliantly, that knowledge never reaches the other four. This is the multi-site maintenance problem — and it costs cement groups millions every year in duplicated spend, inconsistent performance, and best practices that never travel. Start a free OxMaint trial and see your plants on a single dashboard, or book a demo with our cement group specialists.
OxMaint CMMS · Multi-Site Cement Group Management
One Dashboard. Every Plant. Every KPI. Everywhere.
Cement groups operating 5–50 plants lose millions annually to siloed maintenance data, duplicated procurement, and performance gaps that are invisible until they become crises. Centralized CMMS changes that.
22%
Average OEE gap between top and bottom plants in multi-site cement groups
54%
Reactive maintenance ratio in cement plants without centralized CMMS visibility
$3.20
Per-tonne maintenance cost reduction achieved by moving from reactive to planned ratio of 80%
89%
Reduction in time to generate cross-plant benchmarking reports with CMMS automation
The Problem
What Multi-Site Maintenance Silos Actually Cost a Cement Group
The costs of siloed maintenance management don't appear as a single line item. They accumulate quietly — in duplicated procurement, inconsistent standards, and performance variance that goes unaddressed because nobody can see it.
Duplicated spare parts procurement
Each plant maintains its own stock independently. No group-level visibility into inventory. Emergency orders cross-purchased at premium pricing when parts exist at a sister plant 200 km away.
$800K–2.4M per group
Inconsistent maintenance standards
PM schedules differ plant by plant. Checklists vary. One plant performs monthly vibration checks; another does quarterly. Equipment of the same model fails at different rates — the reason is never investigated at group level.
15–25% higher MTTR at underperforming sites
Knowledge that doesn't travel
Plant A solves a recurring kiln hot spot issue using a modified cooling air profile. The fix works. But it lives in one technician's head and one handwritten log. Plant B has the same issue six months later and starts from zero.
2–4 weeks added downtime per repeat failure
No cross-plant performance comparison
The group maintenance director receives monthly reports from each plant in different formats, different KPI definitions, and different data collection methods. Comparing Plant A's OEE to Plant D's is comparing apples to spreadsheets.
OEE gap of 22% never closed
The Solution Architecture
How Centralized CMMS Connects a Cement Group's Plants
Centralized multi-site CMMS is not about replacing each plant's local maintenance operation. It is about giving group management a single, normalized view of performance — while giving each plant's team the tools to execute better at site level.
Group Level — Director View
Cross-plant OEE comparison dashboard
Normalized maintenance cost per tonne
Group-wide PM compliance rate
Capital budget vs. asset condition alignment
Best practice replication alerts
Plant A
OEE: 83%
Top Performer
Plant B
OEE: 74%
Improving
Plant C
OEE: 61%
Intervention Required
Plant D
OEE: 78%
On Target
Site Level — Plant Manager View
Local work order management
PM schedule execution
Asset condition logs
Inventory & procurement
OxMaint normalizes KPI definitions across all plants automatically — so when Plant A reports "kiln availability" and Plant C reports "kiln uptime", the group dashboard reads both as the same metric, calculated consistently.
Your 22% OEE Gap Has a Data Problem at Its Root
OxMaint gives group maintenance directors a single normalized view of every plant's KPIs — so the gap between your top and bottom performers is visible, measurable, and closable.
KPI Framework
The 6 KPIs That Define Multi-Site Performance at Group Level
Top-quartile cement groups track exactly these six KPIs across all plants in a normalized framework. Each one is a leading or lagging indicator of whether maintenance spend is delivering plant performance — or draining into reactive waste.
World-class target
85%+
Combines availability, performance rate, and quality into one number per plant. The single most powerful cross-plant comparison metric — but only meaningful when calculated using a consistent methodology across all sites.
Most cement groups find a 15–22% OEE spread across plants using the same equipment. The gap is almost always a maintenance discipline difference, not a technology difference.
Top-quartile target
< $5.50/t
The most financially direct KPI. Plants spending $8.50/t while peers spend $5.50/t are losing $3/t on every tonne of cement produced. At 1 million tonnes per year, that is $3 million annually — entirely preventable with maintenance program improvement.
55% of total maintenance cost in bottom-quartile plants flows into reactive emergency repairs that cost 4–6× more per event than planned interventions.
Target to prevent reactive failures
> 90%
The most powerful leading indicator. Plants below 85% PM compliance experience significantly higher unplanned failure rates within 90–120 days. At group level, PM compliance rate predicts which plant will have the next major breakdown — before it happens.
OxMaint cement plants report PM compliance improvements from 62% to 91% within 90 days of deployment — driven entirely by automated scheduling and mobile checklist enforcement.
Industry target
80% planned
The operational fingerprint of maintenance maturity. World-class cement plants run 80% planned, 20% reactive. Most plants in a group not using centralized CMMS run the inverse — 54% reactive or higher — which means the majority of maintenance spend is driven by failures, not prevention.
Moving from 54% reactive to 80% planned reduces maintenance cost per tonne by $3.20 on average across cement plant benchmarking data.
Kiln main drive target
> 8,000 hrs
Cross-plant MTBF comparison for identical asset classes reveals where preventive maintenance programs are working and where they are not. If Plant A's raw mill MTBF is 4,200 hours and Plant B's identical mill runs 7,800 hours, the PM schedule difference is recoverable — and measurable.
OxMaint MTBF trending identifies degrading equipment 6–8 weeks before catastrophic failure. Plants using MTBF tracking report 68% reduction in unplanned kiln stops within 12 months.
Top-quartile target
> 91%
Kiln availability is the revenue-generating heartbeat of every cement plant. At $20,000–$50,000 per hour of unplanned downtime, a 3% availability gap between the group's best and worst plant represents $5–15 million in annual production value. This metric demands group-level attention.
Plants that track real-time kiln availability — not retrospective monthly reports — respond to performance drifts 12× faster than those reviewing weekly or monthly summaries.
Implementation
How OxMaint Deploys Across a Multi-Plant Cement Group
Multi-site CMMS deployment does not require a multi-year transformation project. OxMaint follows a phased rollout that delivers group-level visibility within the first 90 days while building site-level operational depth over the following six months.
Asset Register Standardization
OxMaint implementation team works with each site to build a normalized asset hierarchy using a common taxonomy — so a kiln main drive at Plant A is the same asset class as a kiln main drive at Plant D. This is the foundation that makes cross-plant comparison meaningful rather than misleading.
Outcome: Unified asset taxonomy across all plants. Group dashboard structure confirmed.
KPI Framework Activation
Work order systems at each plant are connected to the central OxMaint instance. OEE, MTBF, MTTR, PM compliance, and planned-to-reactive ratio begin calculating automatically from work order data — no manual entry. Group dashboard shows live KPI position for every plant within 48 hours of go-live.
Outcome: Live cross-plant KPI dashboard. First benchmarking report generated automatically.
PM Standardization & Inventory Consolidation
PM schedules are normalized across plants for equivalent asset classes — using the best-performing plant's schedule as the group standard. Spare parts inventory visibility is consolidated across all sites, enabling group-level procurement and inter-site stock transfer before emergency purchasing occurs.
Outcome: Standardized PM library. Group inventory visibility. First procurement consolidation savings realized.
Predictive Analytics & Best Practice Replication
OxMaint's AI begins identifying which maintenance patterns at top-performing plants correlate with higher MTBF and lower reactive ratios — and flags when other plants deviate from those patterns. Group maintenance director receives weekly cross-plant performance alerts with root cause attribution and recommended actions.
Outcome: Automated best practice replication. Predictive alerts across all plants from a single interface.
FAQs
Multi-Site CMMS: Questions from Group Maintenance Directors
Can OxMaint handle plants in different countries with different languages and currencies?
Yes. OxMaint supports multi-language interfaces, local currency display, and region-specific regulatory compliance documentation — while maintaining a single normalized data layer for group-level KPI comparison. Plant teams interact with the platform in their preferred language; the group dashboard normalizes all data to the group's reporting currency and KPI definitions automatically.
Book a demo to see multi-region configuration.
How does OxMaint normalize OEE across plants that calculate it differently?
OxMaint calculates OEE from work order data and production system feeds directly — not from manually entered figures. This means the calculation methodology is identical across all plants. When OEE is shown on the group dashboard, it reflects a consistent availability × performance × quality calculation, not each site's own interpretation of the metric.
What does cross-plant spare parts consolidation actually look like in practice?
OxMaint's inventory module provides a single group-level view of all spare parts held at every plant. When a plant raises an emergency purchase request, the system automatically checks whether the part exists at a sister plant before routing to external procurement. This alone recovers $200,000–$800,000 annually for most five-plant groups.
See the inventory module in a free trial.
How long does it take for a group of five plants to be live on OxMaint?
The group dashboard with live KPI feeds from all plants is typically active within 60 days. Full PM standardization and inventory consolidation completes within 90–120 days. Plants can go live sequentially — with the group dashboard aggregating data from each plant as it joins the platform, rather than requiring all sites to be fully configured before any value is delivered.
Can site-level maintenance teams continue working as they do today, or does everything have to change?
Site teams operate through the same work order, PM scheduling, and inspection tools they would use in any OxMaint deployment. The difference is that their data feeds into the group dashboard automatically. For plant-level users, the experience is a site-level CMMS. For group management, it is a portfolio intelligence platform.
See both views in a 30-minute demo.
OxMaint · Multi-Site Cement Group Management
Your Best Plant Knows Something Your Other Plants Don't.
OxMaint makes that knowledge visible — and replicable. One platform for every plant, every KPI, and every maintenance decision in your cement group. Group dashboard live within 60 days.