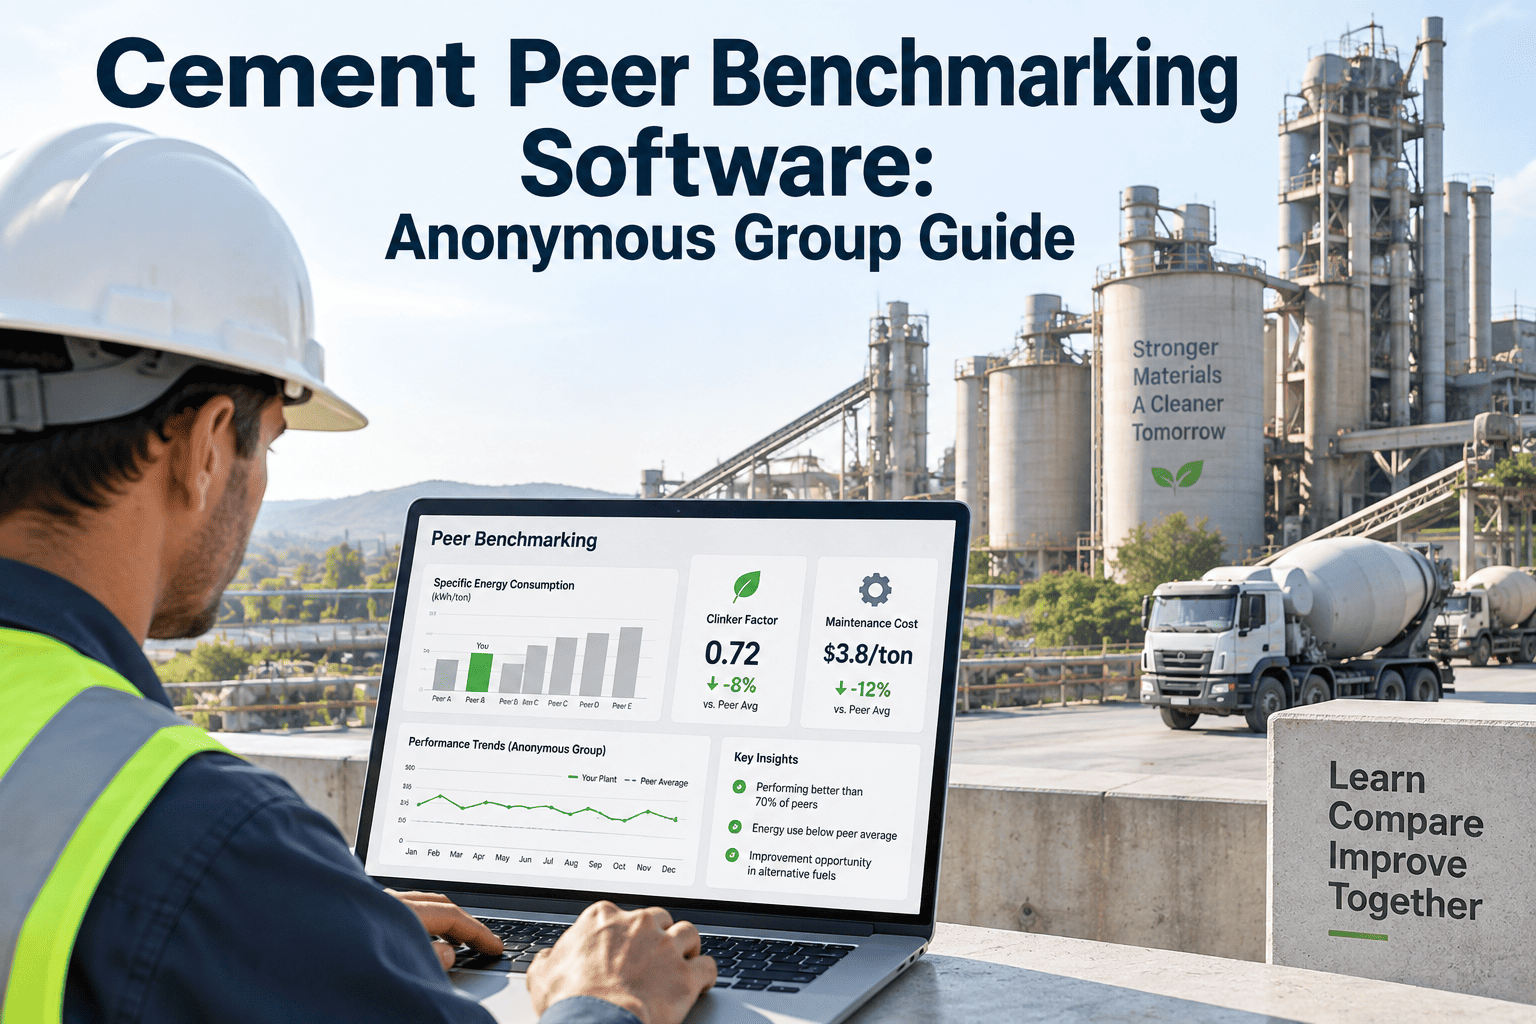
Group finance, reliability, and sustainability teams at multi-plant cement companies spend the first two weeks of every month doing one thing: chasing a dozen different spreadsheets from a dozen different plants, each built by a different engineer, using a slightly different definition of "downtime" or "cost per tonne." By the time those numbers are reconciled into a board deck or a GCCA GNR submission, the data is already weeks stale and nobody fully trusts the total. Layer on CDP climate disclosure, ISO 55001 audits, and quarterly investor reporting using the same manual process, and reporting season stops being a management tool and becomes a recurring fire drill. This guide looks at where multi-plant cement reporting actually breaks, the KPI stack group teams need standardized across every site, and how a CMMS-driven reporting layer turns a dozen spreadsheets into one live, audit-ready number. To see your own plants rolled into one dashboard, start a free trial and connect your first two sites today.
CEMENT GROUP & MULTI-PLANT REPORTING GUIDE
How many hours does your board deck cost you every quarter?
Most group teams running six to twenty cement plants can trace real time and real risk back to one root cause: every plant reports its numbers a slightly different way. Consolidating that into one GNR, CDP, or board-ready figure becomes a manual reconciliation project instead of a report that already existed.
WHERE IT BREAKS
Four reasons multi-plant cement reporting falls apart
None of these problems come from bad people or bad plants. They come from twelve sites each solving the same reporting problem independently, with no shared definition of what a number actually means.
Inconsistent KPI definitions
One plant counts a planned maintenance stop as downtime; another excludes it. One plant calculates cost per tonne on clinker, another on cement equivalent. Roll those numbers up and the group total is technically wrong before anyone opens a spreadsheet.
Version control chaos
Twelve plant files get emailed, edited, and re-emailed across a week, and nobody is fully sure which version is final. A formula error in one plant's tab can silently distort the group number with no way to trace it back.
Manual GNR and CDP assembly
Mapping clinker factor, alternative fuel rate, and Scope 1 and 2 emissions per plant into the GCCA GNR template or a CDP climate questionnaire by hand is slow, repetitive, and easy to get subtly wrong under deadline pressure.
No audit trail behind the number
When a board member or an ISO 55001 auditor asks where a group figure came from, "it's in last quarter's spreadsheet somewhere" is not an answer that holds up. Numbers used externally need a traceable source, not a memory.
THE SHIFT
The old way versus the connected way
The gap between a spreadsheet-driven group report and a CMMS-driven one is not cosmetic — it changes how fast a number moves and how much you can trust it once it does.
The spreadsheet way
- Each plant defines KPIs its own way
- Consolidation is a manual copy-paste job
- Board pack lags month-end by weeks
- No drill-down from group total to plant or asset
- GNR and CDP data re-typed from scratch each cycle
The connected way
- KPI definitions standardized once, applied everywhere
- Consolidation happens automatically as plants log data
- Board pack reflects near real-time numbers
- Every group figure drills down to the source plant and asset
- GNR and CDP fields export directly from live plant data
Turn twelve plant spreadsheets into one number you trust
Standardize KPI definitions across every plant once, then let the group report build itself from data your teams are already logging.
THE KPI STACK
What belongs in a standardized multi-plant reporting stack
Group reporting only works if every plant is feeding the same categories into the same definitions. Here is the KPI stack that covers internal management, GCCA sustainability disclosure, and investor-facing reporting in one structure.
| KPI Category | Example Metric | Reporting Standard | Typical Frequency |
|---|---|---|---|
| Production & OEE | Kiln uptime, OEE% | Internal board deck | Weekly / Monthly |
| Energy & emissions | Specific thermal energy, CO2 per tonne clinker | GCCA GNR, CDP | Annual |
| Alternative fuels | Thermal substitution rate | GCCA GNR | Annual |
| Safety | LTIFR, near-miss count | GCCA Sustainability Charter | Monthly |
| Asset reliability | MTBF, PM compliance % | ISO 55001, internal | Monthly |
| Cost | Cost per tonne, maintenance cost % of RAV | Board / investor deck | Monthly / Quarterly |
Once every plant logs against these same six categories with the same definitions, the group number is not a reconciliation exercise anymore — it is a sum of numbers that already agree with each other.
REPORTING CADENCE
A reporting rhythm that keeps every level fed on time
Multi-plant reporting is not one deadline a year — it is a cadence that runs from daily plant logs up to an annual GNR and CDP submission. Here is how the layers stack.
Plant-level production and downtime logs
Each plant logs production, downtime cause, safety events, and maintenance activity against the same standardized categories, so the raw data is already consistent the moment it is entered.
Group KPI roll-up review
Reliability and operations leads review a live cross-plant dashboard for OEE, downtime, and safety trends, catching outliers at the site level before they reach a monthly board pack.
Board pack and cost-per-tonne consolidation
Finance and plant managers pull a consolidated cost-per-tonne, reliability, and safety pack straight from the group dashboard instead of rebuilding it from scratch in a spreadsheet each cycle.
Investor and ESG progress update
Sustainability and investor relations teams pull trend data against decarbonization and reliability targets for quarterly disclosure, backed by the same numbers used internally rather than a separate reconciliation.
GCCA GNR and CDP submission
Clinker factor, alternative fuel rate, and Scope 1 and 2 emissions data export directly into the GNR and CDP formats from the same plant-level data used all year, instead of a separate annual data-gathering project.
CMMS CONFIGURATION
How a CMMS makes multi-plant reporting run itself
The difference between a group report that takes three weeks and one that takes a click is not more staff — it is a CMMS layer that enforces consistent definitions and rolls plant data up automatically. Here is what that setup looks like.
Shared KPI dictionary across sites
Define downtime causes, cost categories, and safety metrics once at the group level and push the same definitions to every plant instance, so no site can quietly report a different number.
Automatic multi-plant roll-up
Group dashboards consolidate plant-level data as it is logged, replacing manual spreadsheet merges with a total that updates itself continuously through the reporting period.
Drill-down from group to asset
Click any group-level number and drill straight down to the plant, the line, and the specific asset behind it, giving board members and auditors a traceable source in seconds.
GNR and CDP export templates
Map clinker factor, alternative fuel, and emissions fields directly to GCCA GNR and CDP submission formats, cutting the annual disclosure cycle from a data-gathering project to a review step.
Role-based dashboards
Plant managers see their own site's detail, while group directors see the consolidated view — the same underlying data presented at the right altitude for each role.
Audit-ready history
Every KPI, edit, and roll-up is timestamped and exportable, so an ISO 55001 audit or a board question about a specific figure has a documented trail instead of a spreadsheet search.
We ran eleven plants on eleven different versions of the same spreadsheet template, and every quarter close turned into a two-week reconciliation project before the board pack was even started. After we standardized KPI definitions and moved group reporting into the CMMS, the monthly pack builds itself from live plant data, and our GNR submission this year took a fraction of the time it used to.
FREQUENTLY ASKED
Multi-plant cement reporting — straight answers
Why does multi-plant KPI consolidation take so long today?
Most groups consolidate by hand from separate plant spreadsheets, each built independently with its own KPI definitions. Reconciling those inconsistencies before a group number can be trusted is what stretches a monthly close into weeks.
What is the GCCA GNR and why does it matter for reporting?
GNR, or Getting the Numbers Right, is the GCCA's industry database for cement CO2 and energy performance, built on standardized plant-level data like clinker factor and alternative fuel rate. Submitting accurate GNR data each year depends on having that data consistent across every plant all year, not assembled once at deadline.
How is CDP disclosure different from GCCA GNR reporting?
CDP is an investor-facing climate disclosure covering Scope 1, 2, and 3 emissions and climate risk, while GNR is an industry-specific cement energy and CO2 database. Both draw from the same underlying plant emissions and energy data, so keeping that data consistent once serves both submissions. Book a demo to see how the mapping works.
Can a CMMS replace our board reporting spreadsheet entirely?
Yes, when plant-level production, cost, safety, and reliability data is logged consistently, a CMMS can roll that data up into a live board dashboard automatically. Most teams still export a formatted deck, but the numbers behind it stop being manually reconciled.
How long does it take to standardize KPI definitions across plants?
Defining a shared KPI dictionary for a mid-sized group typically takes a few working sessions with plant and group leadership, since the definitions themselves are usually a governance decision rather than a technical one. Start a free trial to configure your group's dictionary and connect the first two plants.
Give your board a number they don't have to double-check
Standardize your KPI dictionary, connect every plant, and let group reporting build itself from data your teams are already logging every day.
Free 14-day trial · No credit card