Unified IoT Visibility for Multi-Plant Cement Operations
By John Snow on February 20, 2026
A cement group operating six plants across three countries reduced cross-plant equipment failures by 41% after implementing unified IoT visibility that enabled corporate engineering to identify maintenance patterns invisible at individual plant level. When Plant 3 experienced repeated gearbox failures on their vertical roller mill, the centralized analytics revealed Plants 1 and 5 had solved the same issue two years earlier through modified lubrication intervals—knowledge that never transferred through traditional reporting channels. Multi-plant cement operations generate millions of sensor readings daily across dozens of locations, but without unified visibility, each plant operates as an isolated data silo where problems are solved repeatedly and best practices never propagate. Sign up for Oxmaint to deploy unified IoT visibility across your cement plant network.
Enterprise View
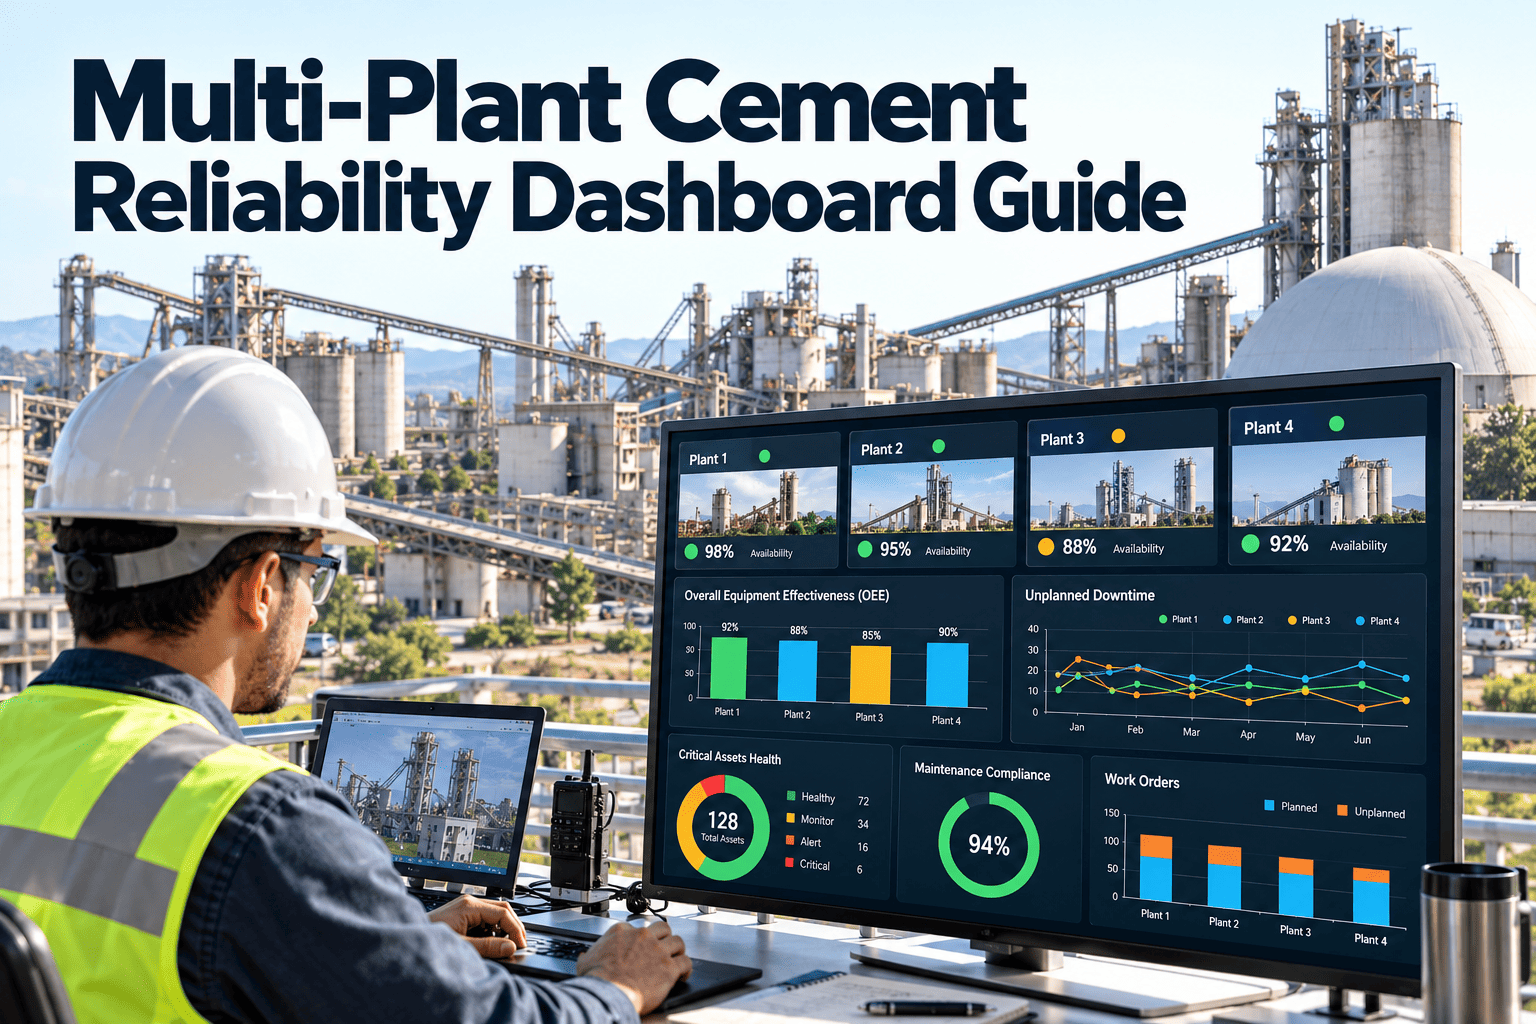
Multi-Plant Operations Dashboard
Consolidated IoT visibility across all cement manufacturing locations
6
Plants Connected
4,847
Active Sensors
94.2%
Average OEE
23
Active Alerts
Plant Status Overview
Monitor equipment health and operational status across all locations from a single dashboard. Identify which plants need attention and drill down to specific equipment issues.
Connected Plants
All Systems Reporting
Plant 1 - Gujarat
Surat, India
96.4%
OEE
847
Sensors
4,280
TPD Clinker
18
Days to Outage
Plant 2 - Rajasthan
Jaipur, India
91.8%
OEE
923
Sensors
5,100
TPD Clinker
7
Days to Outage
Plant 3 - Maharashtra
Pune, India
94.7%
OEE
756
Sensors
3,800
TPD Clinker
32
Days to Outage
Cross-Plant Performance Comparison
Identify best practices and improvement opportunities across locations
Plant
OEE
Specific Energy (kWh/t)
Unplanned Downtime
Alert Response
Plant 1 - Gujarat
96.4%
142 kWh/t
1.2%
4.2 min avg
Plant 2 - Rajasthan
91.8%
156 kWh/t
4.8%
12.1 min avg
Plant 3 - Maharashtra
94.7%
138 kWh/t
2.1%
3.8 min avg
Swipe horizontally to view all columns
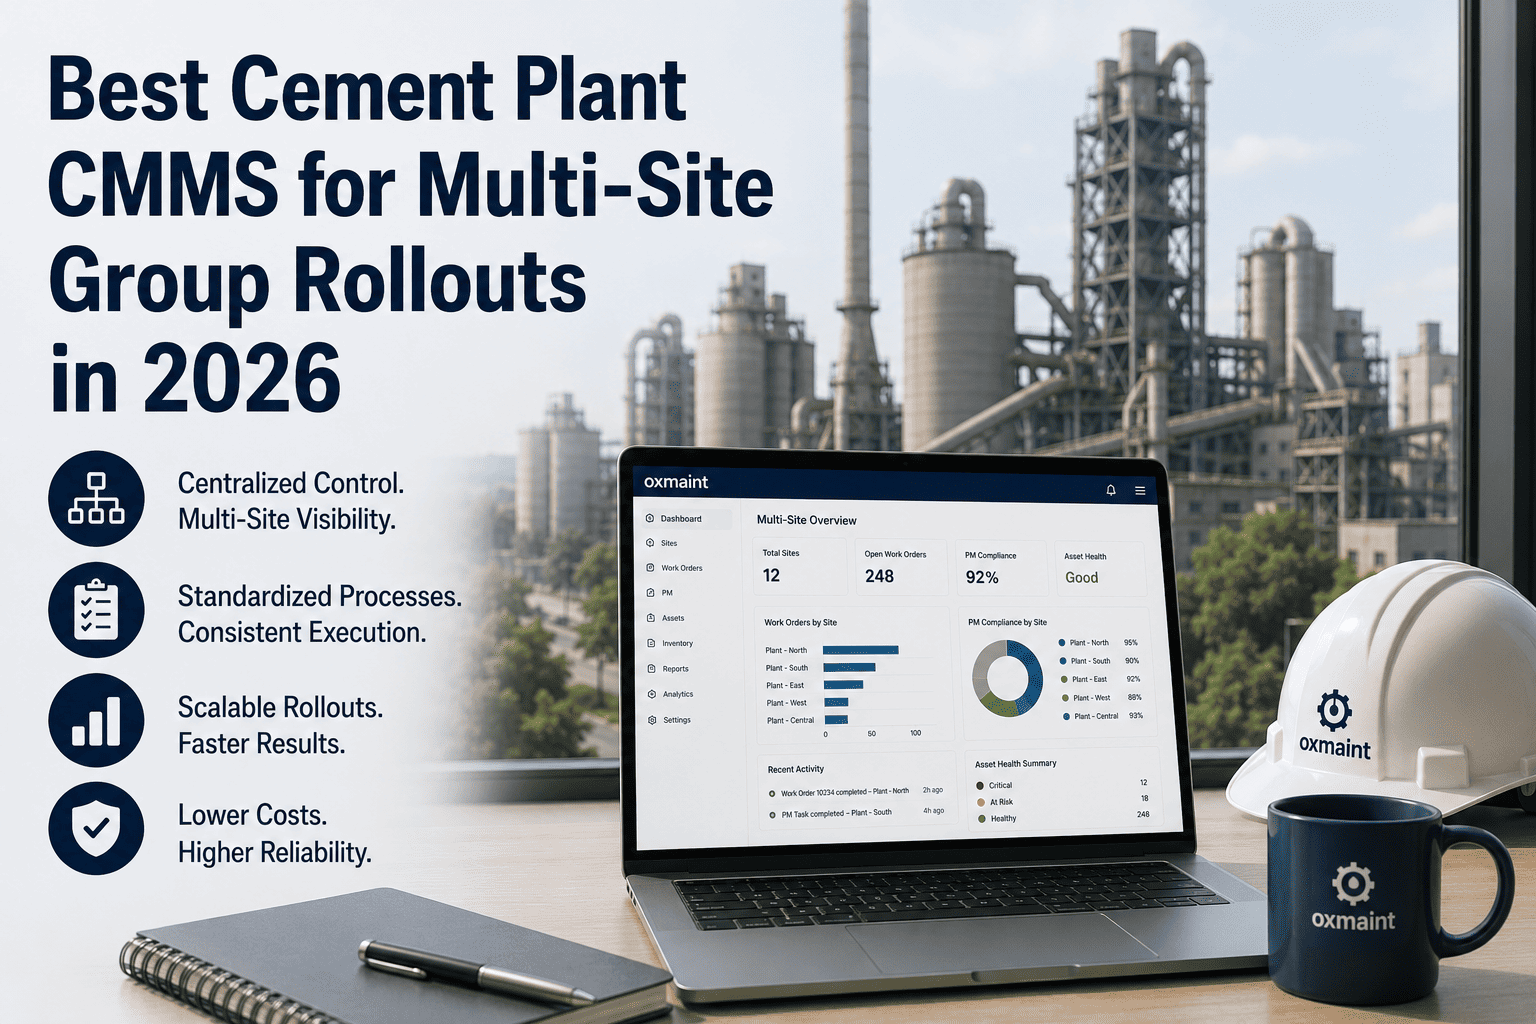
Unify visibility across all your plants. Oxmaint consolidates sensor data from every location into a single enterprise view—enabling corporate engineering to identify patterns, share best practices, and optimize maintenance across your entire network.
Enterprise-grade features designed for multi-plant cement operations. Book a demo to see how unified visibility transforms multi-site maintenance management.
Multi-Location Map View
Geographic visualization showing all plant locations with real-time status indicators. Drill down from global view to individual equipment.
Global operations overview
Click-to-drill navigation
Cross-Plant Analytics
Compare KPIs, equipment performance, and maintenance metrics across all locations to identify best practices and underperforming areas.
Benchmarking reports
Best practice identification
Consolidated Alerting
All plant alerts flow to a unified notification center with priority ranking. Corporate teams see enterprise-wide alert trends and patterns.
Priority-ranked alerts
Pattern recognition
Enterprise Data Hierarchy
Enterprise
Global operations view
1 Organization
Plants
Individual facilities
6 Locations
Equipment
Individual assets
847 Assets
Sensors
IoT data points
4,847 Devices
Role-Based Access Control
Different stakeholders need different views. Oxmaint provides role-based dashboards optimized for each user type. Sign up for Oxmaint to configure role-based access for your organization.
Corporate Engineering
Enterprise-wide visibility with cross-plant analytics, benchmarking reports, and pattern identification across all locations.
All PlantsBenchmarkingAnalytics
Plant Management
Single-plant focus with detailed equipment status, maintenance schedules, and team performance metrics.
Single PlantFull DetailTeam Mgmt
Maintenance Technicians
Work order queues, equipment health details, and sensor data for assigned equipment areas.
Assigned AreaWork OrdersSensor Data
Control Room Operators
Real-time equipment status, active alerts, and process parameters for operational monitoring.
Real-TimeAlertsRead-Only
Frequently Asked Questions
How does data from multiple plants aggregate without overwhelming the dashboard?
Oxmaint uses hierarchical data aggregation that summarizes plant-level KPIs for enterprise views while maintaining full-resolution sensor data accessible through drill-down navigation. Corporate users see consolidated status indicators and can click through to progressively more detailed views—from enterprise to plant to equipment to individual sensor readings.
Can different plants use different sensor types and protocols?
Yes. Oxmaint normalizes data from diverse sensor networks, DCS systems, and communication protocols into a unified data model. Each plant can use whatever sensors and infrastructure they have—the platform handles protocol translation and data standardization so enterprise views present consistent metrics regardless of underlying technology. Book a demo to discuss your specific integration requirements.
How do you handle network connectivity issues at remote plant locations?
Edge computing gateways at each plant buffer data locally during network outages and synchronize when connectivity restores. Plants maintain full local monitoring capability during disconnections—corporate visibility shows last-known status with timestamps indicating data freshness.
What level of plant-specific customization is possible within the unified platform?
Each plant can customize their local dashboards, alert thresholds, escalation rules, and reporting schedules while corporate views aggregate standardized metrics. This allows plants to optimize for local conditions while maintaining enterprise-wide consistency for benchmarking and comparison. Sign up for Oxmaint to explore customization options.
One Platform for All Your Plants
Stop managing isolated data silos. Oxmaint unifies IoT visibility across every cement plant in your network—enabling corporate engineering to identify patterns, share best practices, and optimize maintenance across your entire operation.