A worn or poorly tuned separator is one of the most expensive problems in a cement grinding circuit, and one of the easiest to miss, because the mill keeps running and the tonnage keeps moving even as the specific energy consumption quietly climbs in the background. This is a composite scenario built from the typical performance recovery reported across third-generation separator retrofits industry-wide — the kind of result a finish-mill circuit can expect when rotor wear, bypass, and circulating load are brought back under control. It walks through the root cause, the upgrade rollout, and the 5 kWh/t recovery a plant can realistically target, along with what it took to keep that recovery from eroding afterward. See how a CMMS-tracked wear program keeps that recovery from drifting back inside OxMaint.
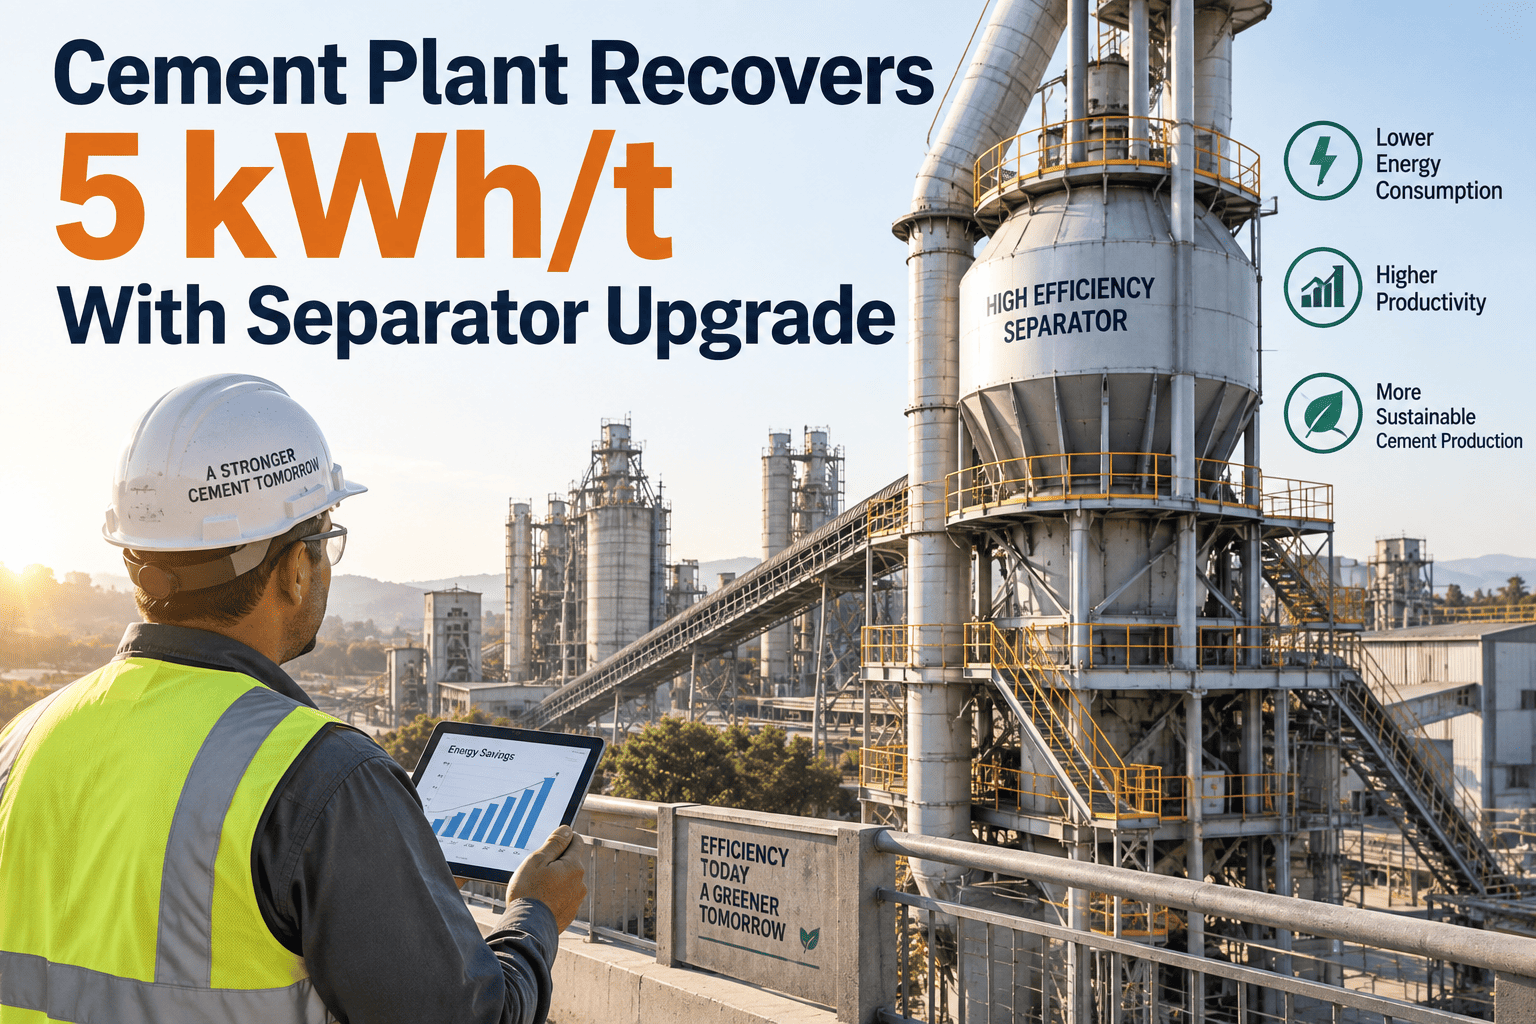
How a finish-mill circuit recovered 5 kWh per tonne with a 3rd-generation separator upgrade
A worn separator was quietly forcing the mill to grind finished cement twice. A rotor and classifier upgrade, backed by a Tromp curve audit program, cut specific energy consumption and paid back the investment in just over a year — without touching product fineness or throughput targets.
The circuit before the upgrade
The plant runs a closed-circuit ball mill on OPC 43 and 53 grade cement, targeting 3,200 to 3,600 Blaine. The separator was a second-generation mechanical air classifier, original to the mill, running well past its typical wear-replacement window.
Nothing about daily production looked obviously wrong. Tonnage targets were being met and product fineness stayed in spec, which is exactly why the underlying classification problem went unaddressed for as long as it did — the symptoms showed up on the power meter, not on the quality report.
What the Tromp curve showed: instead of a sharp S-curve with a defined cut point, the plant's curve was flattened, with a long bypass tail and a visible fish-hook distortion at the fine end. That shape means a meaningful share of already-fine material was reporting back to the mill as reject, forcing the grinding circuit to do the same work twice for no gain in product fineness — and burning electricity on regrinding that added no value to the finished cement.
Why the separator drifted this far before anyone caught it
A separator does not fail all at once. It degrades across several wear surfaces on independent timelines, and a plant that only tracks tonnage and Blaine can run for years without noticing the classifier has quietly stopped doing its job.
Each of the four issues below compounds the others. A worn rotor forces a speed increase to hold fineness, the higher speed accelerates seal wear, and the resulting bypass pushes more material back through the mill, which raises circulating load and masks the root problem behind what looks like a mill capacity issue instead of a classification issue.
Rotor cage blade wear
Worn cage blades shift the cut size coarser. Operators compensate by raising rotor speed, which draws more separator motor power for the same finished fineness.
Guide vane and distributor plate wear
Eroded vanes disrupt airflow distribution across the classifying zone, widening the fish-hook distortion on the Tromp curve and raising bypass.
Seal ring clearance
A seal gap beyond roughly 2 mm lets fines leak into the reject stream and coarse particles bleed into the product, degrading classification from both directions at once and making the fish-hook distortion on the Tromp curve worse over time.
No connected wear record
Inspection notes for the rotor, vanes, and seals lived in separate paper logs. Without a single trend line connecting all three wear surfaces, gradual drift across the classifier never triggered a corrective work order until the energy cost was already substantial.
Where the old classifier sat versus the upgrade
Separator technology falls into three broad generations, and knowing which one is running in a circuit sets realistic expectations for how much energy recovery an upgrade can deliver.
A generational jump from a first-generation static cyclonic unit will typically recover more than a jump from a well-maintained second-generation classifier, so the size of the realistic win depends as much on current condition as on the nameplate generation of the equipment being replaced.
| Generation | Design | Typical Bypass | Typical SEC |
|---|---|---|---|
| 1st Gen — Static Cyclonic | Fixed guide vanes, no rotor | 25-40% | Above 40 kWh/t |
| 2nd Gen — Mechanical Air Separator | Distributor plate, variable-speed top rotor (the plant's original unit) | 15-25% | 35-40 kWh/t |
| 3rd Gen — High-Efficiency Cage Rotor | High-speed horizontal cage rotor, fixed guide vanes, sharp classification (installed unit) | 5-10% | 32-37 kWh/t |
The plant's original classifier was already a second-generation design, but years of accumulated wear had pushed its actual bypass toward the top of the first-generation range — which is why the recoverable energy in this case landed closer to the high end of what a generational upgrade can typically deliver, rather than the more modest gain a well-maintained second-generation unit would have shown.
How the retrofit was phased across the outage window
Baseline Tromp curve audit
Sampled feed, product, and reject streams across multiple production runs to establish the pre-upgrade bypass fraction and cut size as a documented baseline, rather than relying on the OEM's original design curve from years earlier.
Rotor and classifier replacement
Swapped the worn second-generation rotor and distributor assembly for a third-generation high-efficiency cage rotor during a scheduled mill outage, sequenced alongside other planned maintenance to avoid a dedicated shutdown.
Fan and damper recommissioning
Rebalanced separator fan airflow and damper settings to match the new rotor's design operating point rather than leaving legacy settings tuned for the old classifier geometry.
Post-upgrade Tromp curve verification
Re-sampled the classification streams at 30, 60, and 90 days to confirm bypass had stabilized in the new target band rather than reading a short-lived best case immediately after commissioning.
CMMS wear-tracking handoff
Loaded rotor, vane, and seal inspection intervals into OxMaint so future wear drift triggers a work order before bypass climbs back toward its pre-upgrade level.
Before and after: the 90-day verified numbers
The upgrade was measured against the same production mix, feed rate range, and target Blaine used in the baseline audit, so the comparison isolates the separator's contribution rather than a shift in product mix.
Isolating the variable matters here. A plant that changes clinker chemistry, additive dosage, or product mix at the same time as a separator upgrade cannot cleanly attribute the resulting energy change to the classifier alone — which is why this comparison held every other input constant across the 90-day verification window.
| Metric | Before Upgrade | After Upgrade | Change |
|---|---|---|---|
| Specific energy consumption | 39.5 kWh/t | 34.5 kWh/t | -5 kWh/t |
| Separator bypass fraction | ~20% | ~8% | -60% relative |
| Circulating load | ~270% | ~200% | Back in target band |
| Mill throughput at target Blaine | Baseline | Higher, same feed conditions | Improved |
| Payback period | — | Roughly 13-15 months | Including hardware and outage cost |
A 5 kWh/t reduction across a 1 million tonne annual finish-grinding output represents a meaningful, recurring line item on the plant's power bill — the kind of saving that compounds every year the classifier stays in its tuned band, without requiring any further capital investment beyond routine wear-part replacement.
What the upgrade cost against what it returned and delivered over time
The payback calculation on a separator retrofit needs to include more than the rotor and classifier hardware. Outage time, fan recommissioning, and the verification audits all belong in the same ledger as the electricity savings they produce, or the payback figure ends up understating the real capital commitment.
Hardware & installation
Rotor, classifier internals, and fan/damper recommissioning installed during a single scheduled mill outage, avoiding the added cost and production loss of an unplanned shutdown just for the retrofit.
Recurring energy savings
5 kWh/t recovered against the plant's finish-grinding output translates into a recurring annual power cost reduction that scales directly with production volume.
Throughput gain
Lower circulating load freed mill capacity, so the circuit produced more tonnes per hour at the same target Blaine — a secondary return on top of the direct energy saving that shortened the effective payback further.
Combining the direct power savings with the throughput gain is what pulled the payback period back inside 13 to 15 months rather than the longer window a plant would see from energy savings alone.
Model your own separator recovery before you commit to an upgrade
OxMaint tracks Tromp curve audits, wear intervals, and kWh-per-tonne trending in one dashboard so you can see where your circuit actually sits before spending on hardware, and confirm the recovery holds after installation.
Why the savings held instead of drifting back in six months
A separator upgrade recovers energy the day it is commissioned. Whether that recovery survives the next two years depends entirely on whether wear is tracked and acted on before bypass creeps back up.
This is the step most plants skip, and it is why so many separator upgrades show a strong result in year one and a disappointing one in year three. The hardware did not fail — the wear program that was supposed to protect it never got built.
- Rotor and vane inspections logged on paper, if at all, with no shared visibility across shifts
- Bypass drift only noticed when the power bill rises well above expectations
- No trend line connecting inspection findings to specific energy consumption
- Corrective work happens reactively, after a Blaine miss or an operator complaint
- Rotor, vane, and seal wear logged against one shared asset record
- Monthly Tromp curve audit scheduled as a standing recurring work order
- SEC trend line flags deviation before it reaches 5% above baseline
- Replacement parts staged ahead of the next planned mill outage
The four metrics the plant now watches every week
Commissioning a new separator is the easy part. Turning the underlying Tromp curve, bypass, and load figures into a weekly habit is what actually protects the 5 kWh/t recovery going forward.
Frequently asked questions about separator upgrades and payback
How much energy can a 3rd-generation separator upgrade typically recover?
Recoverable energy depends on how far the existing classifier has drifted, but plants moving from a worn second-generation unit to a well-tuned third-generation cage rotor commonly see 3-6 kWh/t, depending on baseline bypass and circulating load at the time of the audit.
What is a Tromp curve and why does it matter here?
The Tromp curve plots what fraction of each particle size reports to the reject stream versus the product stream. A flat curve with a long bypass tail means fine material is being reground unnecessarily, which is exactly what drives up specific energy without improving finished product quality.
How long does a separator upgrade take to install?
The mechanical swap is typically completed within a single scheduled mill outage, though fan and damper recommissioning plus Tromp curve verification extend the full evaluation window to around 90 days before results are confirmed as stable.
How does a CMMS help protect the energy savings after go-live?
OxMaint schedules rotor, vane, and seal inspections against wear-specific intervals and tracks kWh-per-tonne trending, so a drifting bypass triggers a work order before it erodes the savings back to pre-upgrade levels. You can Get Started to set up your own wear-tracking dashboard.
Is a separator upgrade worth it if circulating load is already near target?
If circulating load and bypass are already within their healthy bands, a wear and maintenance program will likely deliver more value than a full hardware replacement — an audit should confirm which case applies before committing capital to new rotor hardware.
Track your own separator's Tromp curve and kWh/t trend in OxMaint
Connect wear inspections, bypass audits, and specific energy trending in one CMMS dashboard, so a recovery like this one doesn't quietly drift back over the next two years the way the original classifier did.
Free trial available · No credit card required