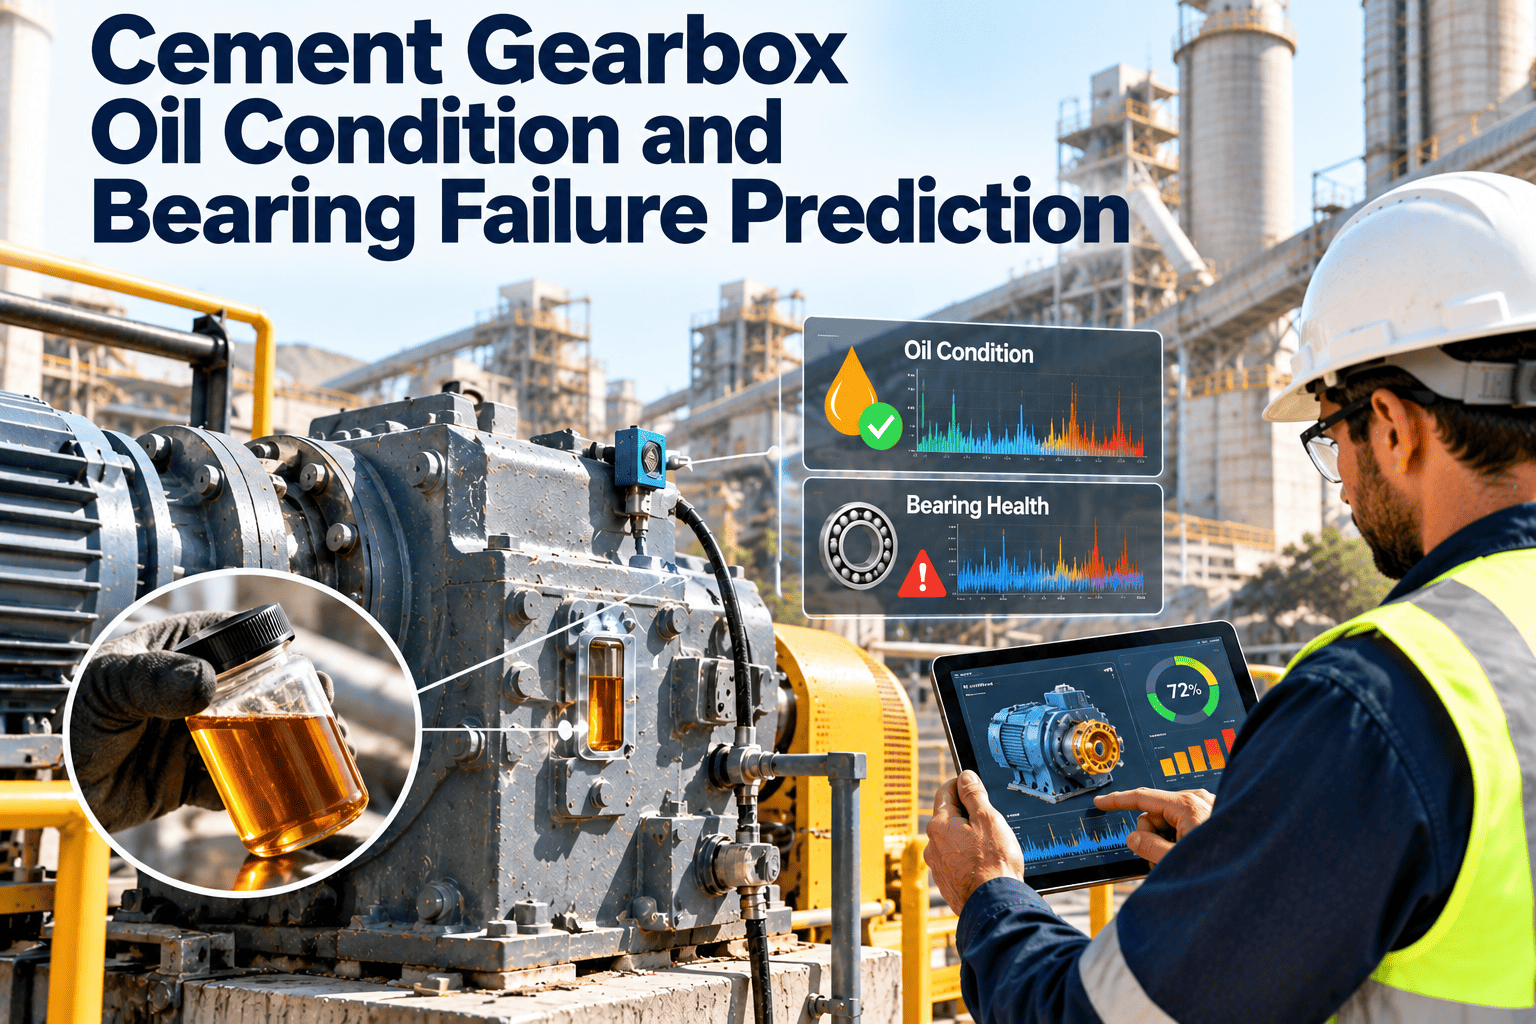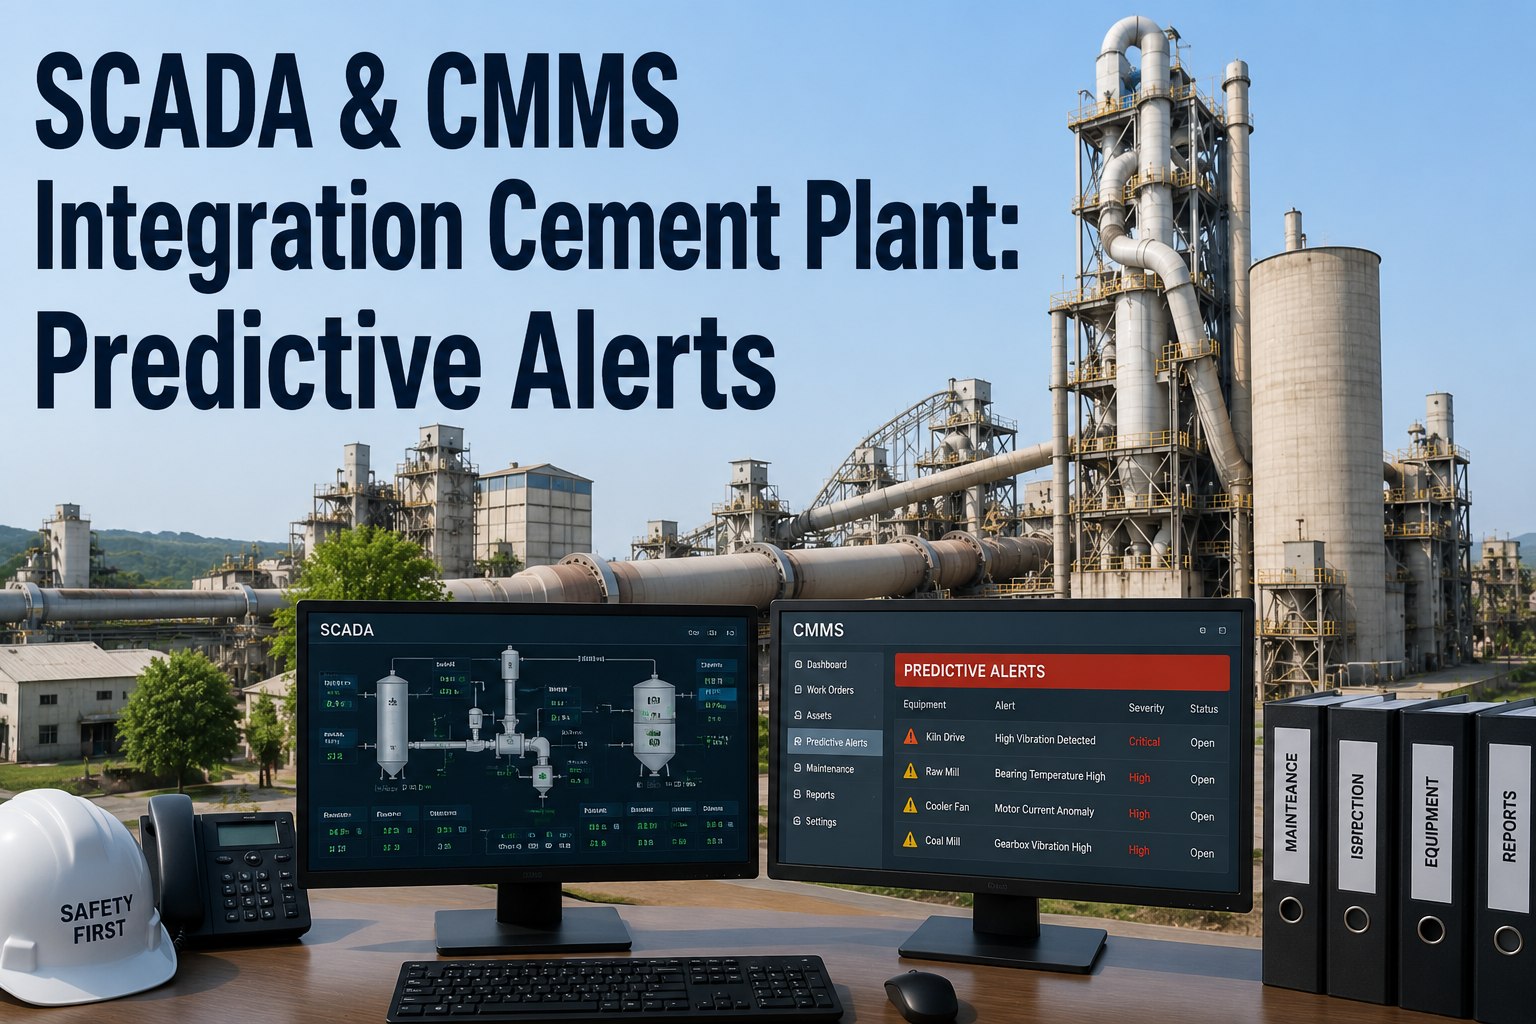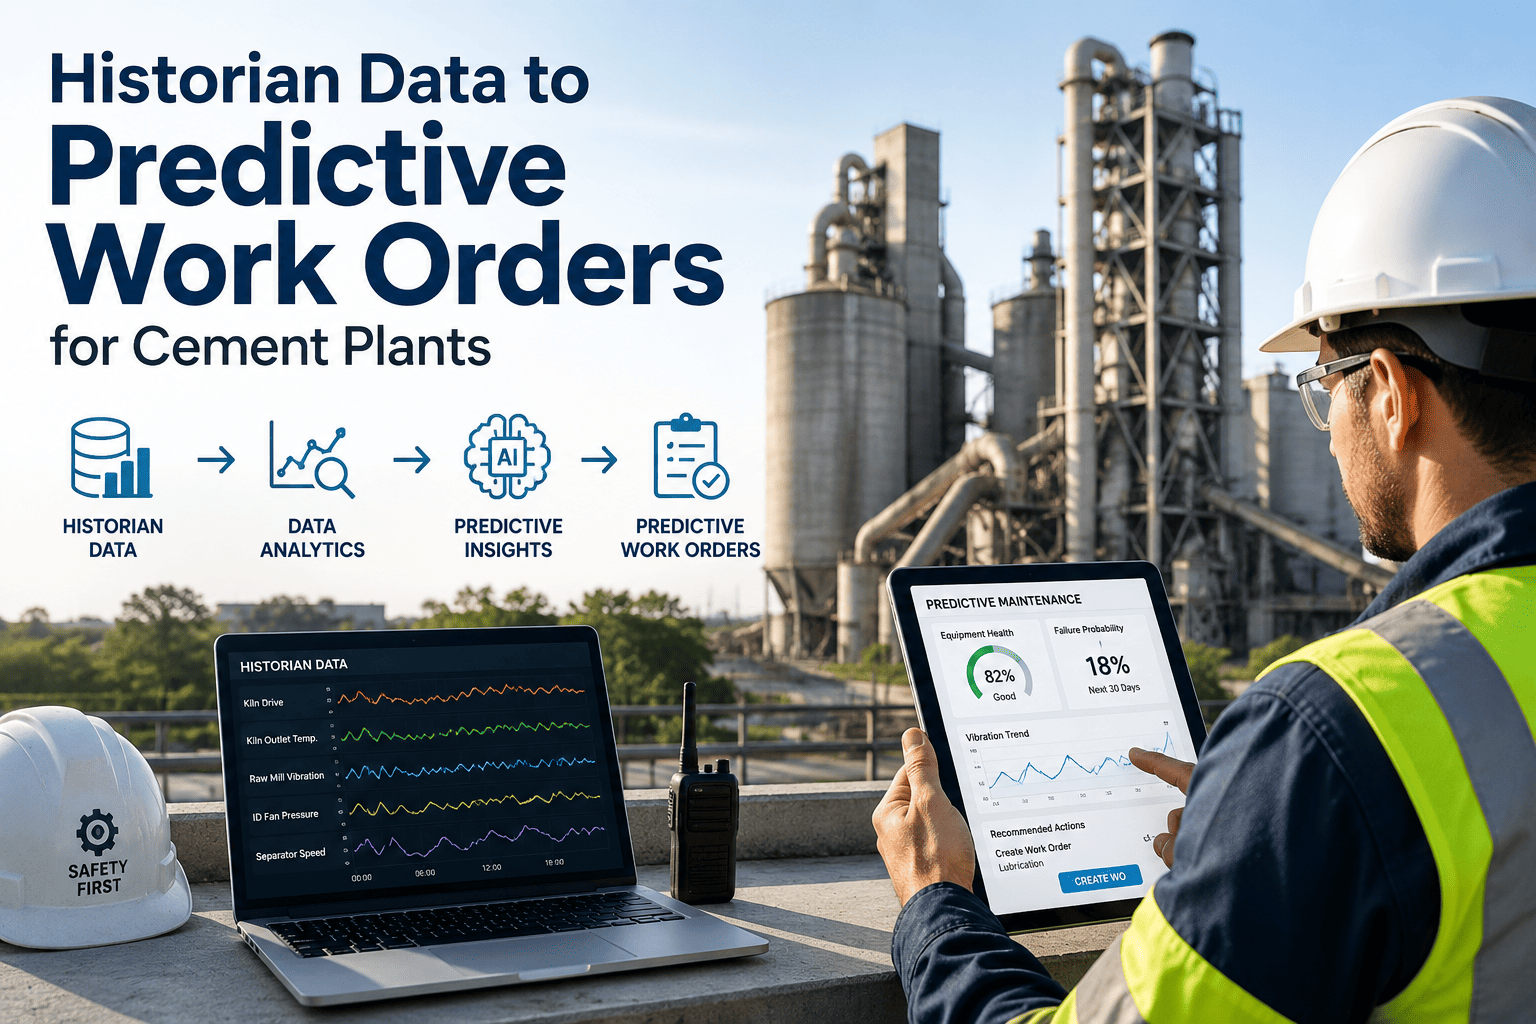
A cement plant already produces the raw material for predictive maintenance: thousands of SCADA tags logging temperatures, currents, vibration, pressures, and speeds every few seconds. Most of that data sits in a historian where it is used for process troubleshooting and then forgotten. Turning it into early warnings requires a deliberate pipeline that cleans the data, ties tags to assets, runs analytics, and delivers results to the people who plan repairs. This guide explains each stage for cement operations, and how maintenance management software closes the loop with work orders.
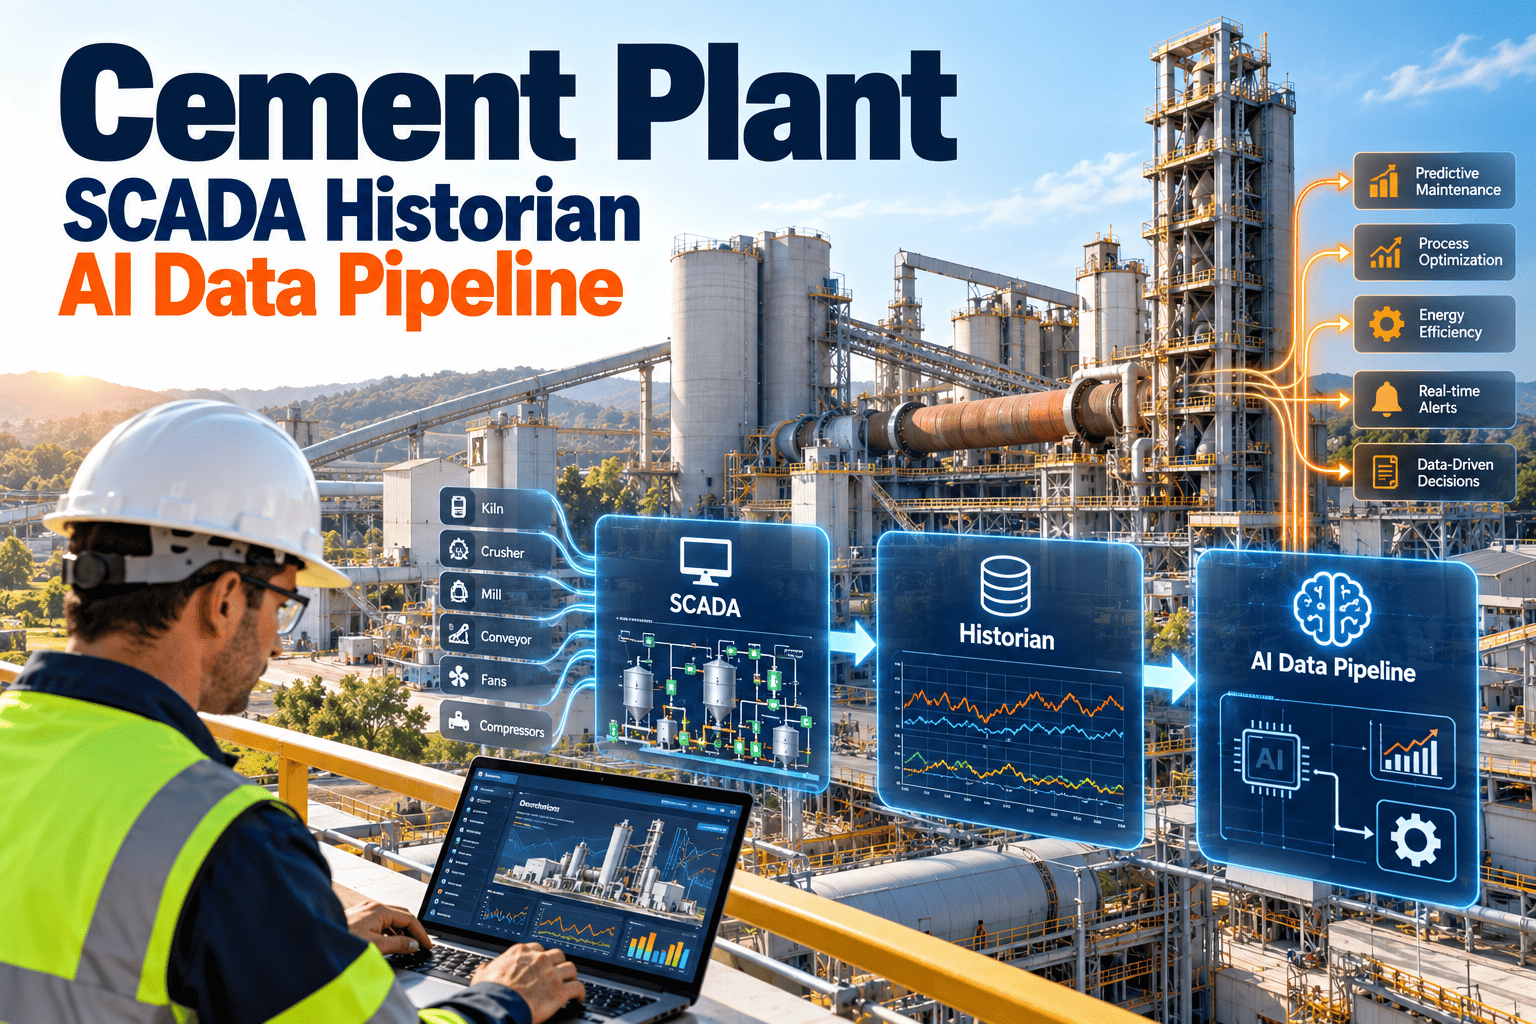
Cement Plant SCADA Historian AI Data Pipeline
Build a practical path from historian tags to maintenance action, so process data predicts equipment problems in kilns, mills, fans, and crushers.
Why Historian Data Alone Does Not Prevent Failures
Historians are built to store process data reliably. They are not built to decide which signal change matters to a maintenance planner on a Tuesday night.
- Thousands of tags with years of history
- Trend screens used by operators
- Alarm lists tuned for process safety
- Separate maintenance records in another system
- Clean, trustworthy signals for analytics
- Tags mapped to specific assets
- Models that understand normal operation
- A route from alert to repair task
The pipeline described below fills those gaps in order, so each stage builds on the previous one.
Stage 1: Choose Use Cases Before Choosing Tags
Collecting everything is expensive and noisy. Start from the failures that cost you most in production hours or repair cost.
| Equipment area | Typical failure concern | Signals often available in SCADA |
|---|---|---|
| Kiln main drive and support rollers | Gear and bearing wear, misalignment, shell issues | Motor current, torque, speed, bearing temperatures, shell temperature scanner |
| Kiln ID fan and cooler fans | Imbalance, bearing damage, buildup, blade wear | Vibration, bearing temperatures, motor current, damper position, pressure |
| Raw mill and cement mill | Gearbox faults, motor issues, lubrication problems | Motor power, vibration, oil temperature and pressure, mill load, differential pressure |
| Vertical roller mill | Roller and table wear, hydraulic system faults | Hydraulic pressure, vibration, motor current, product fineness trends |
| Crushers and conveyors | Bearing failures, belt issues, overload | Motor current, belt speed, bearing temperature, pull-cord and alignment switches |
| Compressors and baghouses | Energy loss, filter and valve problems | Pressure, differential pressure, power, valve cycle data |
| Packing plant and loading | Drive and mechanical wear | Drive data, counters, fault codes |
Stage 2: Collect Data Reliably From the OT Network
Collection should never disturb control. Most plants already have an interface layer between PLCs, SCADA, and the historian.
- Use the standard interfaces already in place, such as OPC, instead of adding new connections to controllers.
- Agree sampling intervals by signal type. Fast signals suit vibration analysis, slower ones suit temperatures.
- Understand historian compression and deadband settings, since they can hide small trends that analytics need.
- Preserve the quality flag attached to each value, because bad or substituted values must not train a model.
- Synchronize clocks across PLCs, SCADA, and historian so events line up across systems.
- Document every tag: description, unit, range, source device, and owner.
- Record sensor replacements and recalibrations as events, so a step change in a signal is not mistaken for an equipment fault.
- Decide how long raw data is retained, since model training needs history that includes past failures.
Poor timestamps and unit confusion cause more failed analytics projects than weak algorithms.
Close the Loop Between Data and the Maintenance Team
Insight has no value until it becomes an assigned task. Use Oxmaint to turn confirmed alerts into work orders with history, parts, and results.
Stage 3: Prepare and Contextualize the Data
Operating state labeling matters in cement. A fan vibration reading means something different at full feed than during warm-up.
Stage 4: Analytics and AI Methods That Fit Cement Equipment
Plants rarely have enough labeled failures for fancy models. Simple, explainable methods usually deliver value first.
| Method | What it does | Good fit |
|---|---|---|
| Threshold and trend rules | Flags values above limits or drifting upward | Bearing temperatures, vibration, oil pressure |
| Normal behavior models | Predicts expected value from related tags and alerts on deviation | Motor current versus load, fan current versus damper position |
| Statistical anomaly detection | Finds unusual combinations of signals | Mills and fans with many related measurements |
| Failure classification | Learns patterns from labeled past failures | Equipment with enough recorded failure history |
| Remaining useful life estimates | Projects time until a limit is reached | Wear-driven components with steady degradation |
Rules for trustworthy models
- Train on periods of known normal operation, with maintenance events excluded or labeled.
- Compare against similar equipment, such as two parallel fans or twin drives.
- Always show which signals caused an alert, so engineers can judge it.
- Track alerts that were true, false, or not confirmed, and retrain or retune from that record.
Process Changes Versus Equipment Problems
A cement kiln line changes behavior with fuel mix, raw feed, clinker quality targets, and ambient conditions. Models that ignore this produce false alarms.
Stage 5: From Alert to Work Order
The feedback step is what makes the system improve. Without it, the same false alarms repeat indefinitely.
Where Oxmaint Fits in the Pipeline
Oxmaint is maintenance management software. Historian, analytics, and AI tools generate the signals, and Oxmaint organizes the maintenance response and records what happened.
- Asset hierarchy for the plant, so every tag and alert maps to a real piece of equipment.
- Work orders created from confirmed alerts, with priority, assignment, parts, and labor.
- Mobile inspection checklists for field confirmation, such as measuring vibration or checking temperature.
- Preventive and condition-based tasks that complement predictive alerts.
- Inventory for critical spares such as bearings, seals, and gearbox parts.
- Failure and repair history that provides labeled events for improving models.
- Reports and dashboards on downtime, repeat failures, and the split between planned and unplanned work.
Ask how your historian or analytics outputs can feed the maintenance workflow in your plant, since integration depends on the systems you run.
OT Cybersecurity and Data Governance
Analytics should be read-only. Any model output that influences setpoints belongs in a separate, controlled project.
Edge, Plant Server, or Cloud
| Option | Strengths | Considerations |
|---|---|---|
| Edge processing near equipment | Fast response, less data transfer, works if the link fails | Limited compute, more devices to manage |
| Plant server | Close to historian, simple security boundary | Local IT support and upgrades needed |
| Cloud platform | Scalable analytics and multi-plant comparison | Data transfer rules, connectivity, and security review |
Many cement groups use a plant server for data preparation and a central platform to compare sites.
KPIs for the Data and Maintenance Pipeline
| KPI | Meaning |
|---|---|
| Data availability and quality score | Share of important tags with good quality data |
| Tags mapped to assets | Coverage of the asset hierarchy by tags |
| Confirmed alert rate | Share of alerts verified as real faults |
| Lead time from alert to failure or repair | Planning time created by the system |
| Unplanned downtime on monitored equipment | Operational outcome |
| Alert to work order time | Speed of response |
A Phased Implementation Roadmap
Common Pipeline Mistakes
- Starting with a platform instead of a failure problem
- Training on data with bad quality or unlabeled repairs
- Ignoring process changes in model design
- Sending alerts to email with no owner
- Treating the pilot as the finish line
- Starting from costly failures and available signals
- Cleaning data and labeling maintenance events
- Separating process and equipment effects
- Assigning each alert to a named reviewer and work order flow
- Planning ongoing model review and feedback
Worked Use Case: Kiln ID Fan Bearing Fault
This walk-through is illustrative and shows how the stages connect. Equipment, signals, and limits differ by plant.
Tag Naming and Asset Mapping
A consistent scheme lets analytics and maintenance speak about the same equipment.
| Element | Example format | Why it matters |
|---|---|---|
| Area | Kiln, raw mill, cement mill, packing | Groups equipment for reporting |
| Equipment ID | Same ID as the maintenance asset record | Links signals to work order history |
| Measurement type | Temperature, vibration, current, pressure | Allows rules to be reused across assets |
| Position | Drive end, non-drive end, inlet, outlet | Identifies the failing location |
| Unit and range | Degrees, millimeters per second, amperes | Prevents unit mistakes in models |
Fix naming gaps early. Renaming tags after models are built is slow and error prone.
Managing Alert Volume and Alert Fatigue
- Rank alerts by asset criticality, so a kiln drive alert is seen before a minor conveyor one.
- Combine related alerts into one case instead of sending separate messages for each tag.
- Require a reason and an outcome for every closed alert.
- Set review meetings for open watch items, not only for urgent ones.
- Retire or retune rules that regularly produce unconfirmed alerts, and document why the change was made.
- Keep a short list of alerts that always requires immediate action, with clear escalation.
A smaller number of trusted alerts does more for reliability than a long list that people stop reading.
Roles and Skills Needed
Trends in Cement Plant Data and AI
- Edge analytics for fast signals: more processing is happening near equipment to reduce data volume.
- Multi-plant comparison: groups compare similar equipment across sites to benchmark health and failure patterns.
- Digital twins and process models: simulation is used alongside data models for kiln and mill optimization.
- Natural language tools: some platforms let engineers query historian data and maintenance history in plain language, which still needs validation.
- Energy and emissions links: the same data supports energy and emissions monitoring, which adds value beyond maintenance.
Cement SCADA Historian and AI Questions
Turn Plant Data Into Planned Repairs
Pair your historian and analytics with a maintenance system that records every alert, inspection, and repair. Start with Oxmaint.