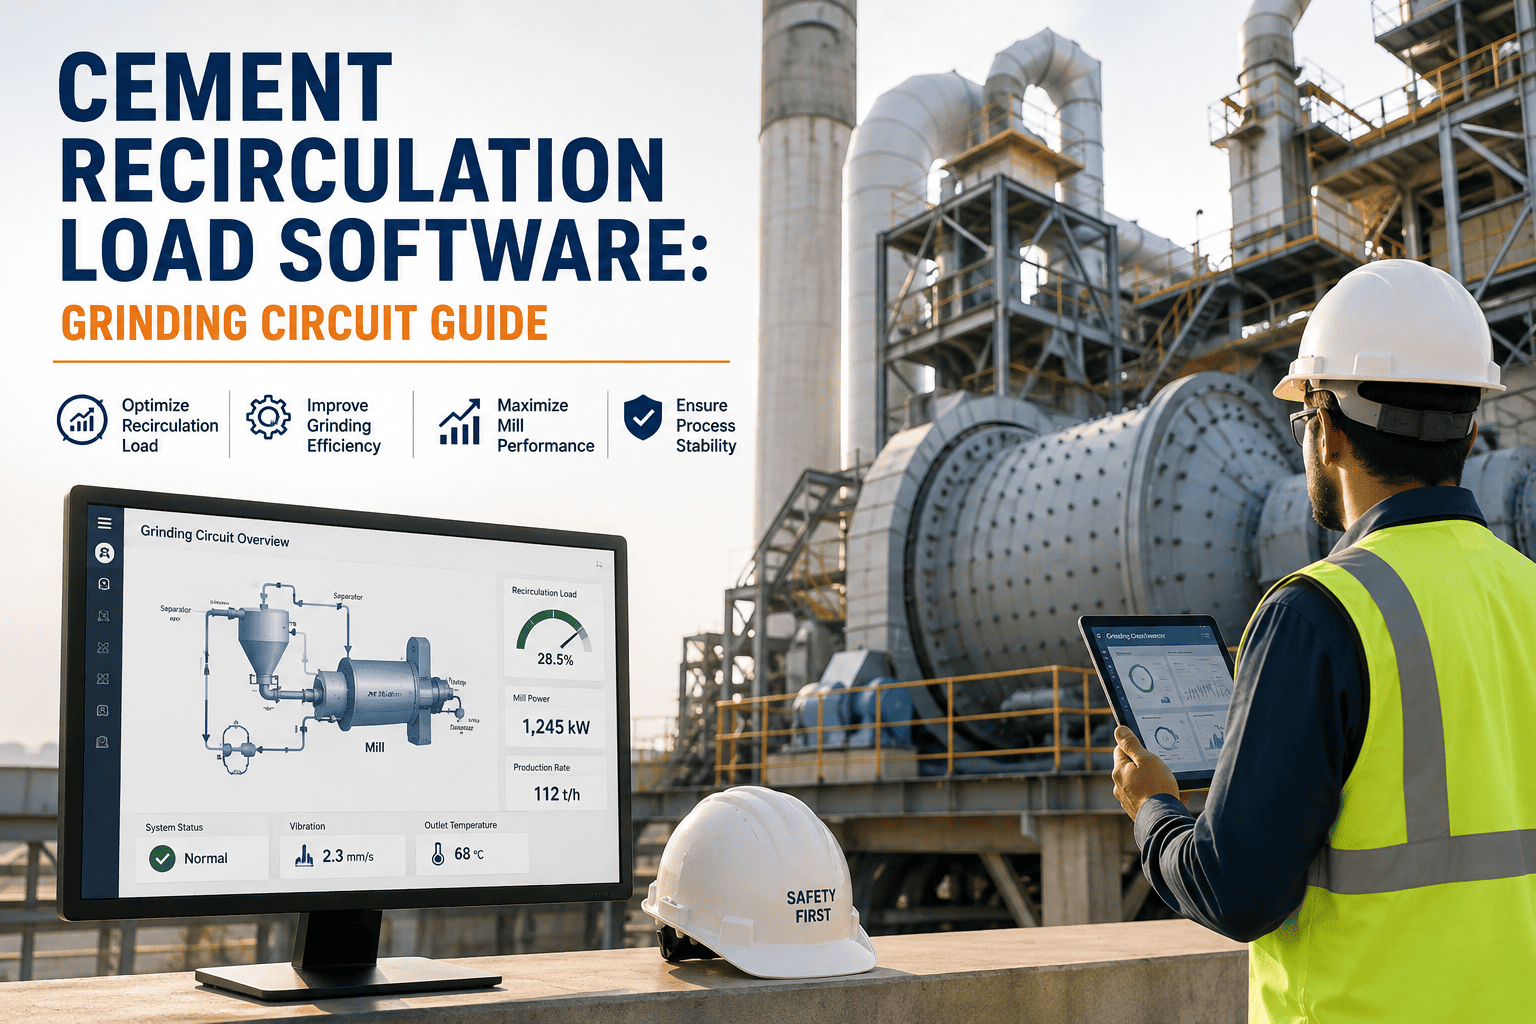
Cement grinding circuits rarely fail loudly — they just get expensive, tonne after tonne. When circulating load in a ball mill or roller press circuit climbs past 300-400%, specific energy consumption creeps up, separator efficiency drops, and mill throughput stalls without anyone touching a single setpoint. Most plants only notice when the monthly power bill lands or when cement fineness starts drifting off spec across shifts. Tracking recirculation load as a live KPI, shift over shift, is what separates circuits running at a lean sub-200% load from ones quietly burning kWh on rework. OxMaint's recirculation load module logs mill amps, separator reject tonnage, and feed rate together so the trend is visible before it becomes a cost problem.
Cement Recirculation Load Software for Grinding Circuit Control
Move your grinding circuit from a reactive 300-400% recirculation load down to a controlled sub-200% range with continuous separator tuning, load trending, and shift-level KPI tracking built into your CMMS.
What Recirculation Load Actually Tells You About a Grinding Circuit
Recirculation load (or circulating load ratio) is the tonnage of coarse material returned from the separator back to the mill feed, expressed as a percentage of fresh feed. A ball mill in closed circuit with a dynamic separator naturally runs some recirculation — that is how the separator classifies product away from oversize. The problem starts when load climbs beyond design intent: separator rotor speed drifts low, air flow through the cage drops, or feed size distribution changes upstream at the crusher or raw mill. Each of these pushes more coarse material back into the mill, and the mill grinds the same tonnes twice, sometimes three times, before they leave as finished product. A circuit sitting at 350% load is effectively wasting a third of its grinding energy on material that should have exited already. Reading recirculation load alongside mill motor amperage and separator reject weightometer readings, shift by shift, is the fastest way to catch this drift before it shows up as a fineness complaint from quality control.
The downstream effects compound quickly once a circuit runs over-loaded for an extended period. Mill internals see more tonnes pass through them per unit of finished product, which accelerates liner and grinding media wear well beyond the plant's normal replacement schedule. Bucket elevators and air slides carrying the reject stream run closer to their design capacity, increasing wear on buckets, chains, and fabric filters handling the extra dust load. Cement fineness becomes harder to hold steady because the separator is working against a moving target rather than a stable feed, which often shows up first as strength variability at 28 days rather than an obvious process alarm. None of these consequences trace back cleanly to "recirculation load" unless someone is actually watching that number — which is exactly why it deserves its own dashboard rather than living buried inside a DCS trend screen nobody opens outside of a fault investigation.
Circulating Load Thresholds and the Action They Should Trigger
A single circulating load number means little without a baseline for that specific mill and separator combination. What matters operationally is the trend across shifts and the threshold at which someone actually intervenes. The table below reflects the ranges most finish-grinding circuits use once a baseline has been established through a few weeks of stable logging. Building this baseline early is worth the effort — a threshold set from a generic industry range rather than your own mill's actual history will either trigger false alarms constantly or, worse, stay silent while a real problem develops underneath it.
| Load Range | Circuit Status | Likely Cause | Recommended Action |
|---|---|---|---|
| <150% | Under-loaded | Separator cut too coarse, fineness risk | Increase rotor speed gradually, verify Blaine |
| 150-220% | Stable target band | Normal balanced operation | Log and hold, no action needed |
| 220-300% | Elevated, watch closely | Airflow drop or feed size shift | Check fan damper, review upstream feed |
| 300-400% | High, energy loss active | Separator wear or rotor imbalance | Schedule separator inspection within days |
| >400% | Critical inefficiency | Mechanical fault or major misadjustment | Stop and inspect separator internals |
These bands are a starting point, not a fixed rulebook. A roller press pre-grinding circuit or a VRM will naturally sit well above the 400% line as part of normal operation, so the same absolute numbers need to be re-based against that circuit's own design tonnage before they mean anything. What stays constant across every configuration is the value of watching the trend line rather than a single reading — a circuit climbing 40 points over two weeks is a very different story from one bouncing within a stable band shift to shift, even if both happen to touch the same number on a given day.
Turn Circulating Load Into a Shift KPI, Not a Monthly Surprise
OxMaint pulls mill amps, separator reject tonnage, and fresh feed rate into one live circulating load figure your shift team can act on immediately, instead of discovering the drift in next month's energy report.
Separator Tuning: The Two Levers That Actually Move Load
Most recirculation load problems trace back to one of two adjustable variables on the dynamic separator: rotor speed and classifying air volume. Raising rotor speed sharpens the cut point, sends more material to reject, and raises circulating load while improving product fineness. Reducing classifying air has the opposite effect on load but can also drop fineness if pushed too far. Tuning is an iterative process — a 5-10% change in rotor speed, held for a full shift while circulating load and Blaine are logged, tells you more than any single spot check. Circuits that log this pairing consistently converge on a stable operating point within two to three weeks, and that point drifts again as separator vanes and rotor blades wear, which is why ongoing tracking matters more than a one-time tuning exercise.
Beyond the two primary control handles, a handful of secondary factors quietly shift the operating point without any deliberate adjustment. Grinding media charge and ball size distribution change the particle size distribution entering the separator, which changes how much material the classifier has to reject to hit a given fineness target. Mill ventilation, feed moisture, and even ambient humidity affecting cement flowability inside the separator housing can each nudge circulating load by 10-20% without a single control room setpoint being touched. This is exactly why a tuning session logged only against rotor speed and air, without also capturing feed rate, moisture, and ball charge age, tends to produce results that don't repeat cleanly the next time the same rotor speed is dialed in.
Common Mistakes When Monitoring Recirculation Load
Plants that struggle to keep recirculation load under control usually share a handful of monitoring habits rather than a fundamentally different mill design. Reading load only during the day shift misses the overnight drift that this guide's case study below describes, since separator setpoints are sometimes altered informally between shifts without a documented reason. Relying on a single monthly energy report to catch load problems means a circuit can run 30-40% over target for weeks before the number even reaches anyone's desk. Treating recirculation load as a standalone number, disconnected from feed rate, ball charge age, and separator maintenance history, also makes it hard to diagnose why a load spike happened even after it has been noticed — the trend tells you something changed, but only the surrounding context tells you what.
Case Study: Cutting Recirculation Load From 380% to 190%
The plant reported a secondary benefit alongside the energy saving: separator wear rates dropped once the rotor was no longer being cycled between two very different speed setpoints every 12 hours, extending the interval between planned separator internal inspections. The team also used the same shift-level logging habit to catch a slower, unrelated drift in raw mill feed size a few months later, applying the exact same "compare reject against feed, shift by shift" approach that first uncovered the finish mill issue.
Frequently Asked Questions — Recirculation Load in Cement Grinding
Stop Grinding the Same Tonnes Twice
OxMaint gives your grinding circuit a live recirculation load KPI, separator tuning history, and shift-level trending in one CMMS dashboard — so energy loss gets caught in days, not at month-end. Free to start.