An operator round produces a number of small facts throughout the day: a bearing temperature, a vibration note, a refractory observation, a lubrication level. Any single reading rarely tells you much. It's the pattern across dozens of rounds, weeks, and assets that reveals which failure mode is quietly building — and that pattern is exactly what gets lost when rounds live in a logbook instead of a database that a reliability engineer can actually query.
Rounds-to-Trend Analytics
Turn every operator round observation into defect trend intelligence
OxMaint captures round data as structured, comparable records — not free-text notes — so reliability engineers can see which components are generating repeat defects across the kiln line before the pattern turns into an unplanned stop.
A single round tells you almost nothing. A hundred rounds tell you everything.
One observation of a warm bearing is noise. The same bearing flagged as warm on four consecutive rounds, with a rising trend line behind it, is a signal that deserves a work order today rather than a note for later. The difference between those two outcomes is entirely a function of whether the earlier observations were recorded in a way that could be compared at all.
Free-text notes can't be trended
"Bearing a bit warm" written three different ways by three different operators across a week cannot be compared, charted, or trended — it can only be read one entry at a time.
Recurring defects hide across shifts
If the same defect is flagged by three different shifts on three different sheets, nobody connects the dots unless someone happens to read all three logbooks in sequence.
Root cause investigations start from zero
Without a searchable history, an RCA after a failure often starts by asking "did anyone notice anything before this?" — a question paper logs answer poorly, if at all.
PM intervals stay generic
Without defect trend data by component, PM schedules default to OEM recommendations even when a specific asset's actual failure history suggests a different interval is needed.
From observation to insight: how rounds data becomes a trend
Turning a round into analytics is a four-stage pipeline. Skipping structure at the first stage breaks everything downstream of it.
01
Structured capture
Each round observation is logged against a defined field — asset, component, defect type, severity — instead of open text.
02
Asset-level aggregation
Every observation is stored against the specific asset and component, building a continuous history rather than isolated entries.
03
Pattern detection
Repeat defect types on the same component, or rising severity over time, surface automatically in dashboard views rather than requiring manual review.
04
Action and feedback
A confirmed pattern triggers a PM interval review or a targeted RCA, and the outcome feeds back into the next round's checklist.
Defect Pattern Examples
What a repeat defect trend actually looks like on a cement plant kiln line
These are the kinds of patterns that only become visible once round data is structured and compared across time — patterns that a single logbook entry could never reveal on its own.
Refractory wear clustering
Multiple rounds flag thinning refractory in the same kiln zone over several weeks — a pattern that points to a burner alignment or feed issue rather than normal wear, visible only when the observations are grouped by location.
Bearing temperature drift
A raw mill bearing shows a slow upward temperature trend across consecutive rounds, well before it crosses any single alarm threshold — the trend line is the warning, not any one reading.
Repeat conveyor idler failures
The same section of a clinker conveyor generates idler defects every few weeks, suggesting a misalignment or loading issue that a one-off repair keeps missing.
Seasonal lubrication pattern
Grease-related defects on outdoor equipment spike at the same time each year, pointing to a seasonal PM interval adjustment rather than a random maintenance gap.
See what patterns are already hiding in your round history
Bring your current round sheets and we'll show you what trend analysis would surface on your kiln line, mills, and conveyors.
Manual review vs. connected analytics: the practical difference
Reliability engineers can technically spot patterns by manually reading through logbooks — the difference is how long that takes, and how much gets missed along the way.
| Task | Manual Logbook Review | Structured Rounds Analytics |
|---|---|---|
| Finding all defects on one asset over 90 days | Search through multiple binders or shift sheets by hand | Filter by asset in a dashboard, results in seconds |
| Spotting a repeat defect across shifts | Depends on someone reading every shift's notes | Automatically grouped by component and defect type |
| Comparing severity trend over time | Not practically possible from free text | Plotted as a trend line against threshold values |
| Feeding findings into PM interval reviews | Requires a separate manual analysis project | Trend data is already attached to the asset record |
What OxMaint's rounds analytics gives reliability teams
Component-level defect history
Every observation is tied to the specific component on the asset hierarchy, so a bearing's full defect history is one click away, not scattered across weeks of notes.
Automatic repeat-defect flags
When the same defect type recurs on the same asset within a defined window, it's surfaced automatically rather than waiting for someone to notice the pattern manually.
Severity trend dashboards
Reliability teams can view severity trends by asset class or plant area, turning round data into the same kind of visibility usually reserved for sensor-based condition monitoring.
PM interval feedback loop
Confirmed defect trends can be reviewed directly against the asset's current PM schedule, giving planners the evidence to adjust intervals with confidence.
Three analytics views every reliability team should have access to
Rounds data becomes genuinely useful once it can be sliced in more than one way. These three views cover most of the questions a reliability engineer actually asks day to day.
Pareto view by defect type
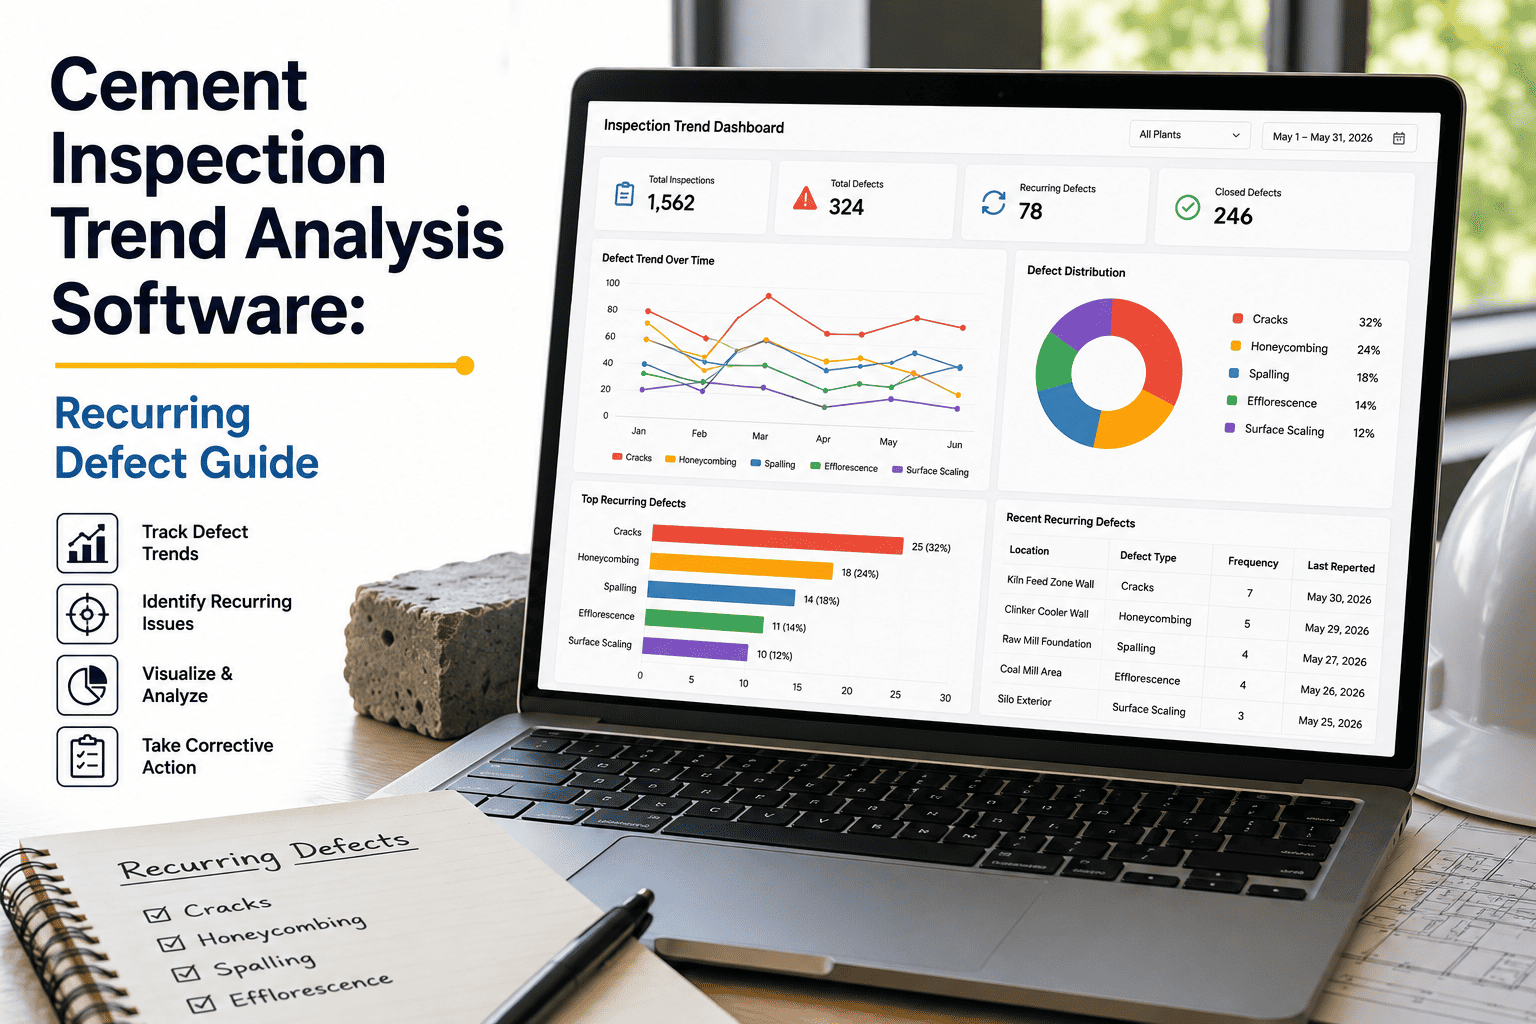
Ranking defect categories by frequency across the plant shows which failure modes — lubrication, alignment, wear, electrical — are consuming the most round-to-work-order volume, focusing improvement efforts where they matter most.
Asset view by repeat count
Sorting assets by how often they generate a repeat defect within a rolling window surfaces the bad actors on the kiln line — the same targeted approach reliability programs use for downtime, applied to round observations instead.
Location view by plant area
Grouping defects by physical location rather than asset type can reveal environmental factors — heat, dust, vibration from a nearby machine — that individual asset records alone wouldn't show.
Time-based view by shift or season
Comparing defect volume and type across shifts or seasons can highlight training gaps, environmental patterns, or process changes that correlate with when defects are actually occurring.
Connecting rounds analytics to the rest of your CMMS
Trend data only creates value when it connects to the systems that actually act on it — the PM schedule, the work order queue, and the spare parts inventory that supports the repair.
- PM schedule review. A confirmed defect trend on a component should be reviewed against its current PM interval as a standing monthly practice, not a one-time project.
- Spare parts forecasting. A rising trend on a specific bearing or seal type across multiple assets is an early signal for inventory planning, well before a stockout forces an emergency order.
- RCA prioritization. Assets generating the most repeat defects are natural candidates for a formal root cause analysis, rather than continuing to absorb one-off repairs indefinitely.
- KPI reporting. Repeat-defect rate by asset class becomes a trackable reliability KPI alongside MTBF, MTTR, and OEE, giving plant managers another lens on where the program stands.
From lagging to leading: what changes when rounds data feeds reliability decisions
Most reliability metrics — downtime hours, MTTR, cost per repair — are lagging indicators. They tell you what already happened. Structured rounds data is one of the few sources that can function as a leading indicator, because it captures degradation before it becomes a failure.
Early signal capture
An operator noting a slight vibration or unusual sound on a round is often the first recorded evidence of a developing failure, well before it shows up in downtime statistics.
Trend confirmation
A single early signal is treated as noise until it repeats. Structured data lets the system confirm a genuine trend rather than reacting to every isolated observation.
Proactive intervention
A confirmed trend triggers a planned inspection or repair while the equipment is still running, converting what could have been an unplanned stop into scheduled work.
Closed-loop learning
The outcome of the intervention — what was actually found and repaired — feeds back into the asset record, sharpening how future trends on that component are interpreted.
Getting started without boiling the ocean
Plants that try to structure every observation on every asset from day one tend to stall. A narrower starting point produces usable trend data faster and builds the habit before expanding scope.
- Start with the critical path. Kiln, raw mill, and cement mill rounds generate the highest-value trend data first, since these assets carry the most downtime risk per failure.
- Limit initial fields to what's actionable. A handful of well-defined defect categories beats twenty vague ones that operators apply inconsistently.
- Review trends monthly before automating alerts. Understanding what a normal pattern looks like for your plant before setting automatic thresholds avoids a flood of false alarms.
- Expand asset coverage once the habit sticks. Once the core round is running reliably, extending structured capture to secondary equipment is a much smaller lift.
What good defect trend data looks like six months in
By the time a plant has six months of structured round history, the analytics stop being a novelty dashboard and start functioning as a working reference for planning and reliability decisions.
| Question | Without Structured History | With Six Months of Trend Data |
|---|---|---|
| "Is this bearing a repeat problem?" | Depends on who remembers the last time it was flagged | A direct query against the component's defect history |
| "Which assets need an RCA next quarter?" | Chosen based on the most recent or most visible failure | Ranked by actual repeat-defect frequency across the plant |
| "Should we shorten this PM interval?" | A judgment call based on OEM guidance alone | Backed by observed defect trend data specific to the asset |
| "What's our current reliability trend?" | Downtime hours after the fact | A leading indicator visible weeks before downtime occurs |
How rounds analytics differs from predictive maintenance sensors
It's worth being precise about what rounds analytics is and isn't. It is not a replacement for vibration sensors, oil analysis, or thermal imaging — it's a way of extracting the same kind of trend value from data that was already being collected by hand, using equipment the plant already owns.
Sensor-Based Predictive Maintenance
- Continuous, high-frequency readings from installed instrumentation
- Requires capital investment in sensors and integration
- Best suited to specific failure modes like bearing wear or misalignment
- Typically covers a defined set of critical assets
Rounds Analytics
- Periodic, human-observed readings captured at the point of the round
- Uses existing mobile devices and existing round schedules
- Captures a wider range of defect types, including ones sensors don't monitor
- Extends across every asset that gets a physical round, not just instrumented ones
In practice, the two approaches are complementary. Sensors catch what they're built to catch continuously; rounds analytics catches everything else an experienced operator would notice, and turns those observations into the same kind of trend data sensors already provide. For most cement plants, the more practical starting point is rounds analytics, since it builds on inspection routines that are already in place rather than requiring new instrumentation budget approval.
Frequently asked questions
How much round history is needed before trends become useful?
Meaningful patterns typically start to emerge after 60 to 90 days of structured round data on a given asset, though a clearly recurring defect can surface sooner if it appears on consecutive rounds.
Can rounds analytics work alongside sensor-based predictive maintenance?
Yes. Operator round observations and sensor data complement each other — rounds capture what a technician can see, hear, or feel, while sensors capture continuous readings, and both feed the same asset history.
Do operators need to change how they walk rounds?
The physical round stays the same. What changes is how the observation is recorded — through a structured mobile checklist instead of a paper sheet — so analytics can be built on top of it.
Can defect trend data support an ISO 55000 reliability program?
Yes. A documented, evidence-based process for adjusting maintenance intervals based on observed defect trends supports the kind of continuous improvement record ISO 55000 audits look for.
How do we get started with rounds analytics in OxMaint?
Start by digitizing your existing round checklists with structured fields for asset, component, and defect type. Book a demo and the team will help map your current sheets into that structure.
Turn Rounds Into Reliability Intelligence
Stop reading logbooks for patterns your data already contains
OxMaint structures every round observation so repeat defects, severity trends, and PM adjustments surface automatically — before they become downtime.
Free trial available · No credit card required