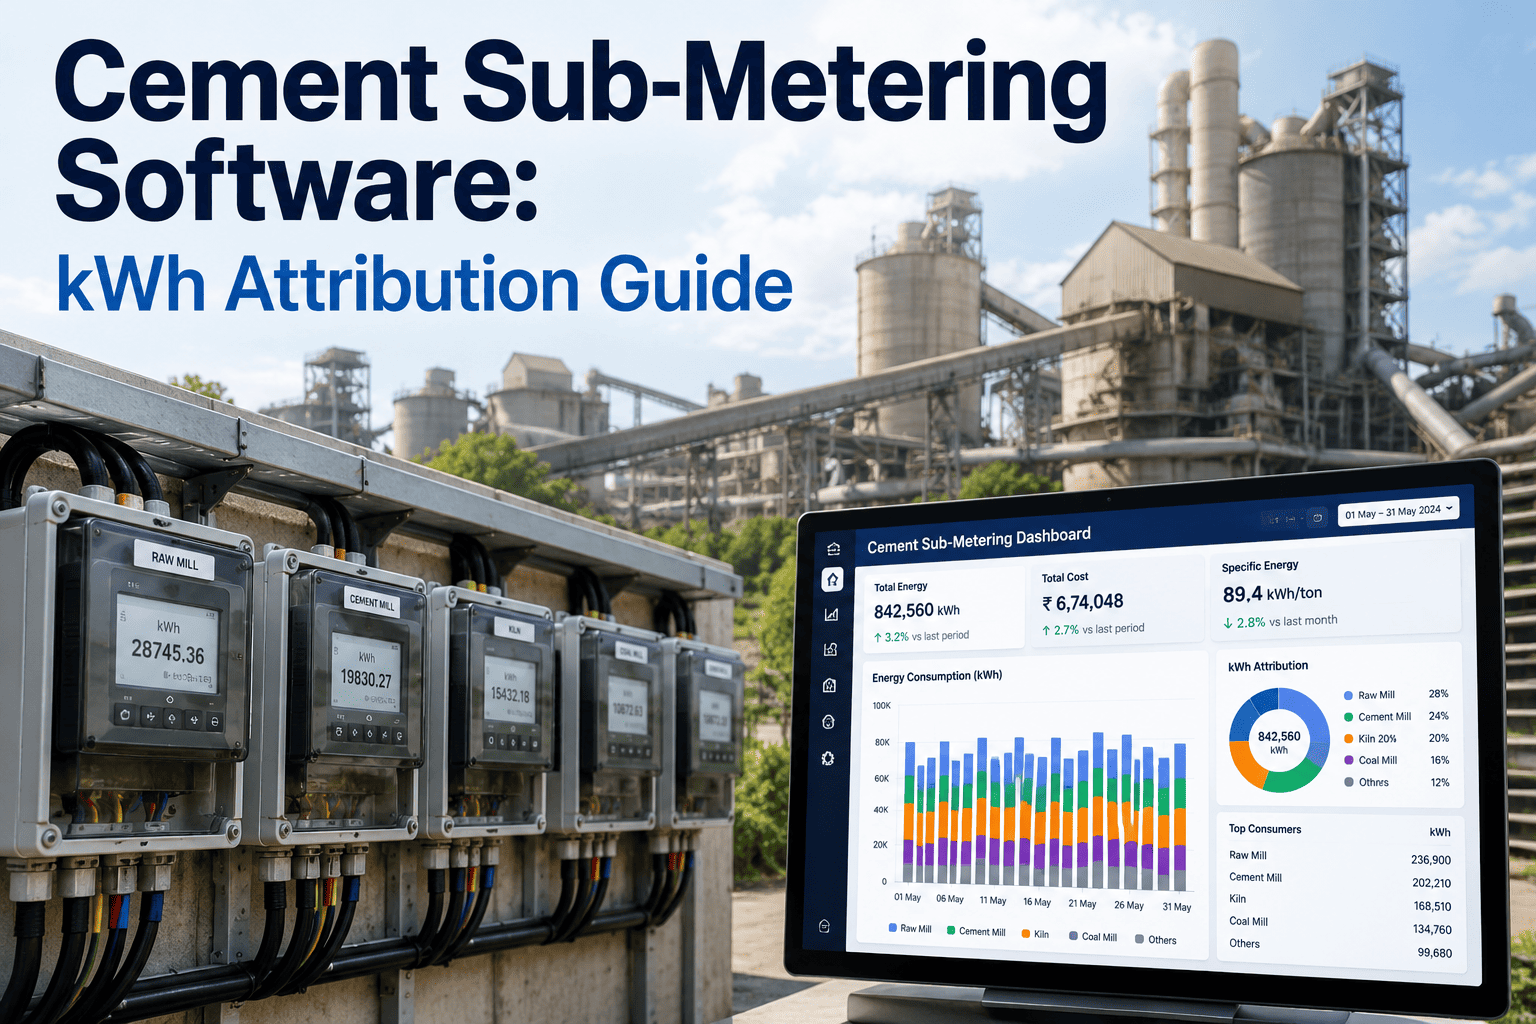
Most cement plants can tell you exactly what last month's electricity bill was. Almost none can tell you, without a special study, how many of those kilowatt-hours went to the raw mill, how many went to the kiln drive and ID fan, and how many leaked out of a compressor room running 12% above its rated specific power. A single utility meter answers one question — did the number go up or down — and answers nothing about which asset caused it. Sub-metering is what turns that one blunt number into twelve or fifteen department-level answers, and attributing every one of them back to a specific asset is exactly what plants build inside OxMaint.
Cement Sub-Metering Software
Attribute every kilowatt-hour to raw mill, kiln, cooler, cement mill, and packing — so an anomaly on any circuit becomes a work order instead of a line on next month's bill.
One Meter Tells You What Happened. Fifteen Meters Tell You Why.
A plant running on utility-level metering alone is, in a very real sense, navigating without instruments. The monthly bill moves up or down, and every department has a theory about why — the kiln team blames the mills, the mills blame the compressors, and nobody has the circuit-level data to settle the argument. Sub-metering ends the theory-trading by giving every major consumer its own number, refreshed continuously instead of once a month.
One Number, Once a Month
Total site consumption only. No visibility into which department, let alone which asset, drove a swing. By the time the bill arrives, the anomaly that caused it may already be three weeks old.
Grinding, Kiln, Utilities Split
Consumption separated into the major process areas — grinding typically 38 to 42% of the total, kiln system next, then compressed air, fans, and material handling.
kWh/t Per Machine, Per Shift
Individual mills, drives, and fan groups each carry a specific power figure that can be compared directly against a design or Blaine-normalised baseline, asset by asset.
Where the Kilowatt-Hours Actually Go — The Plant-Wide Attribution Map
Cement manufacturing consumes roughly 90 to 120 kWh per tonne of product depending on technology and grinding system, and that total splits unevenly across five process areas. Knowing the rough share each area should carry is the first check against a sub-meter reading that looks wrong.
The Meters That Matter Most — Priority Sub-Metering Points
A full circuit-level installation with 40 to 60 meters gives near-complete visibility, but most plants do not need to start there. Eight to fifteen meters placed on the highest-consumption circuits typically cover roughly 70% of total plant consumption, which is where the attribution program should start before expanding further. The order below reflects both consumption share and how quickly a deviation on that circuit translates into a real cost — a kiln drive anomaly, for instance, is worth catching within hours, while a slow drift on a bag filter fan can reasonably wait for a weekly review.
Kiln Main Drive
Baseline set at 5% deviation threshold — the tightest tolerance on the plant because drive load reflects bed condition and refractory buildup directly.
Raw Mill
Specific power tracked against a Blaine-normalised baseline. An 8% deviation threshold typically flags media depletion or liner wear before quality is affected.
Cement Mill
Same baseline logic as the raw mill, with the added value that a specific-power deviation here often precedes a fineness non-conformance by days.
Compressor Room Busbar
A single meter on the compressor room isolates the utility with the least visibility elsewhere on the plant and the fastest-growing waste when leaks accumulate.
Clinker Cooler Fan Group
Fan group consumption tracked with a wider 15% deviation threshold, since load naturally varies more with clinker bed depth and ambient conditions.
Bag Filter & Dust Collection Fans
Smaller individually, but a fan running 10% above baseline for weeks before discovery is a common and entirely avoidable source of wasted kWh.
Stop Discovering Waste on the Monthly Bill
OxMaint integrates with your energy sub-meters and routes anomaly alerts straight to maintenance as pre-populated work orders — closing the gap between energy data and the technician who can act on it.
Why an Aggregate Bill Hides More Than It Reveals
Electricity typically represents 30 to 40% of total cement production cost, which makes it one of the largest controllable line items on the plant's entire budget — and yet most sites manage it with less granularity than they apply to raw material cost or labor. A raw mill separator bearing wearing out will push consumption up 8 to 12% before the failure is ever detected on a maintenance report, and on an aggregate bill that rise simply disappears into the plant-wide total, indistinguishable from a change in production mix or ambient temperature.
The practical effect is that energy waste and mechanical degradation are, in most plants, the same signal arriving too late to act on. A fan losing efficiency, a compressor developing a leak, a mill running with depleted media — every one of these shows up as an energy anomaly well before it shows up as a breakdown. Sub-metering is what lets a plant catch the energy signal instead of waiting for the mechanical one.
A Sub-Metered Plant, Live — What the Attribution Board Looks Like
The board below shows what department and asset-level kWh attribution looks like inside a CMMS on a live production day. Every meter carries its own baseline, its own deviation threshold, and its own linked work order the moment a reading crosses that threshold — instead of a single number waiting to be explained at month-end.
Utility Bill Review vs Attributed Sub-Metering — The Practical Difference
Every plant already reviews the electricity bill every month. The difference between a plant that closes energy waste quickly and one that repeats the same review indefinitely is whether that number can be traced down to a circuit and an asset the same week it moves.
| Attribution Element | Utility Bill Only | Sub-Metered & Attributed | Typical Outcome |
|---|---|---|---|
| Detection Time | Anomaly visible only at month-end close | Deviation flagged within days against a live baseline | Weeks of avoidable waste recovered |
| Fault Attribution | Total site figure, cause unclear | Anomaly tied to a specific circuit and asset | Correct technician dispatched first time |
| Response Path | Manual investigation after the fact | Work order auto-generated with anomaly data pre-populated | Root cause addressed, not just noted |
| Compliance Reporting | Manual compilation for ISO 50001, CBAM | Per-asset energy history maintained automatically | Audit-ready without a special data pull |
Six Practices That Make Sub-Metering Actually Pay Off
Installing meters is the easy part. Plants that turn that hardware into real savings run these six practices as a standing routine rather than a one-time commissioning exercise, so the meters keep earning their cost every month rather than fading into background noise on a dashboard nobody opens. A meter that reports a number nobody reviews is not meaningfully different from having no meter at all — the value is entirely in the routine built around it, not the hardware itself.
Baseline Per Asset, Per Condition
Every meter tied to a rated power figure and a design or Blaine-normalised baseline before it goes live, so day-one readings mean something.
Deviation Thresholds Set Per Asset Type
Tighter tolerance on kiln drive and mills, wider tolerance on fans and coolers where natural load variation is expected and normal.
Auto-Generated Work Orders
Anomaly data pre-populated into the work order the moment a threshold is crossed, removing the manual investigation step entirely.
Coverage Expansion Review
Priority circuits reviewed for expansion from the initial 8 to 15 meters toward fuller circuit-level visibility as budget allows.
Live Attribution Board Review
Shift supervisors check the attribution board the same way they check production numbers, not just at month-end reporting time.
Baseline Recalibration
Baselines refreshed after major overhauls, VFD retrofits, or grinding media changes so the threshold logic never drifts out of date.
What Attributed Sub-Metering Returns Across a Plant
These figures reflect what cement plants report after moving from utility-only billing review to asset-level sub-metering with automated anomaly routing, tracked across the first year of operation. The pattern across every one of them is the same — the savings rarely come from one dramatic fix, they come from dozens of small anomalies caught in weeks instead of months, each one small enough to have gone unnoticed on a single aggregate bill but large enough, in aggregate, to justify the meter program on its own within the first year.
Typical coverage achieved with just 8 to 15 priority meters placed on the highest-consumption circuits plant-wide.
Annual cost of a 15 kWh/t gap against best-in-class benchmark at 1.5 Mt/year output and typical industrial tariff.
Wasted by a single 200 kW bag filter fan running 10% above baseline for 60 days before discovery.
Every meter, baseline, and linked work order living in one system instead of a separate energy spreadsheet nobody maintains.
Frequently Asked Questions
How many sub-meters does a cement plant actually need?
What deviation threshold should trigger an investigation?
Where does most of a cement plant's electricity actually go?
How does sub-metering connect to maintenance work orders?
What is a realistic payback period for a sub-metering rollout?
Turn Your Next Electricity Bill Into a List of Answers, Not Questions
OxMaint keeps sub-meter baselines, deviation alerts, and every linked work order inside one attribution record — so every kilowatt-hour on the bill has a name attached to it.