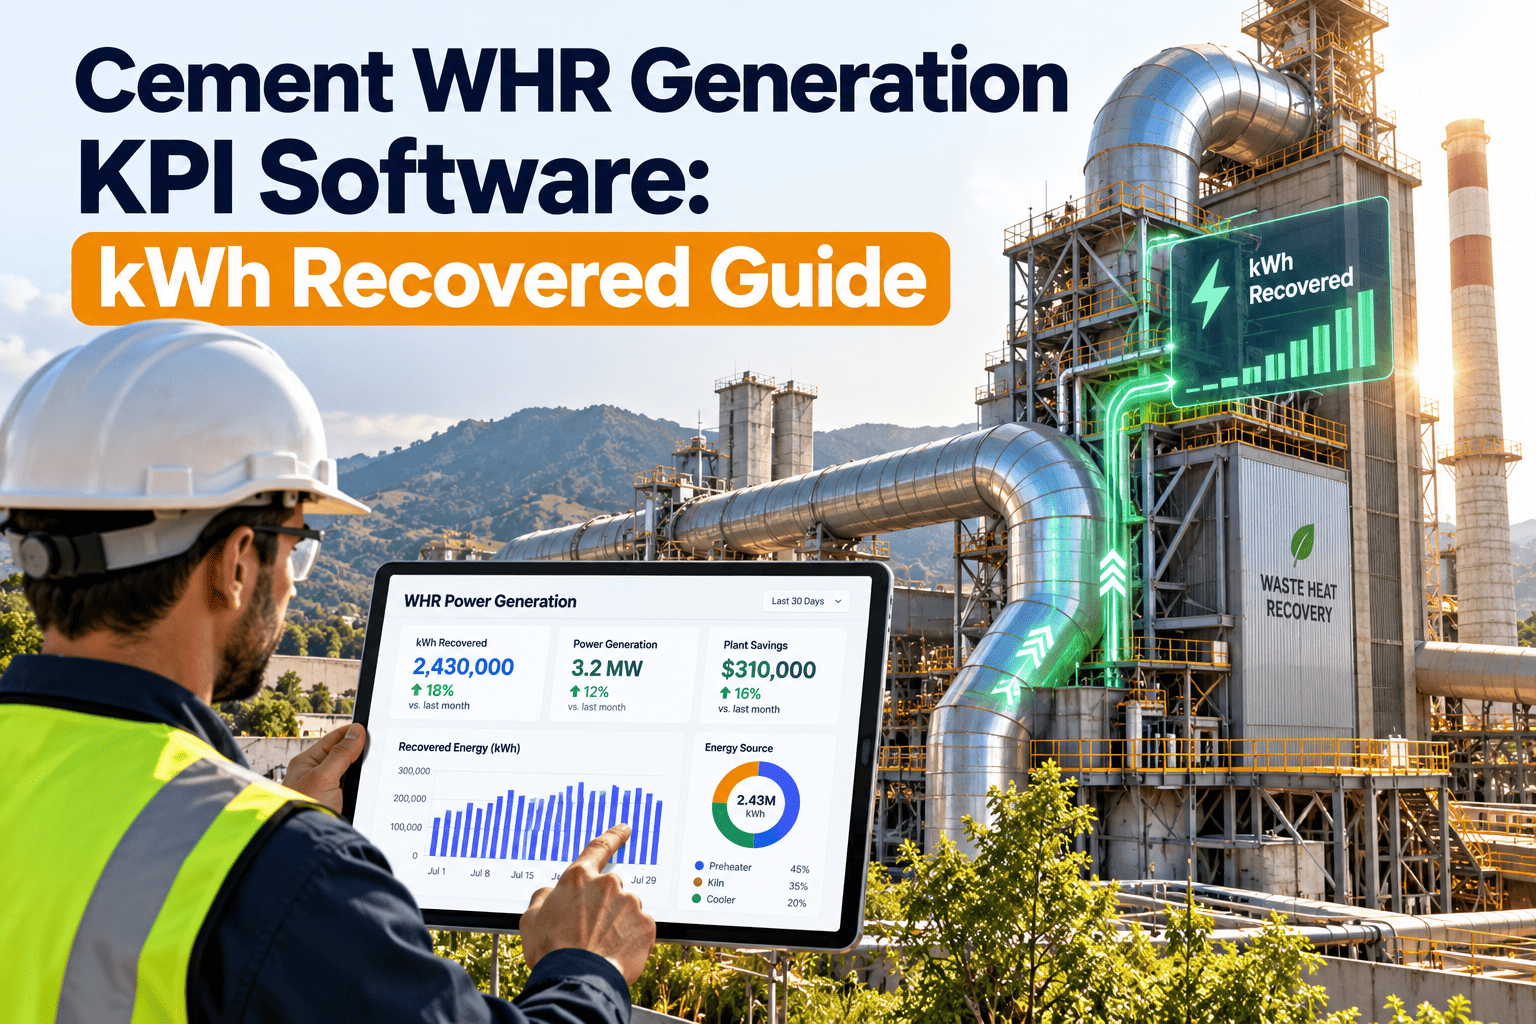
Waste heat recovery (WHR) turns kiln and cooler exhaust into electricity, but a generator rating says little about what the plant actually recovers. Boards, CDP disclosures and energy teams want proof in kWh recovered, capacity factor and grid offset. This guide shows how to define those WHR generation KPIs, which losses distort them and how maintenance records connect output back to equipment condition. Explore how a cement plant maintenance platform from Oxmaint supports the data behind the numbers.
Cement WHR Generation KPI Software: Track kWh Recovered, Capacity Factor and Grid Offset
A WHR plant only earns its keep when it runs, and it only runs when boilers, turbine and auxiliaries stay healthy. Oxmaint ties maintenance work to the KPIs that sustainability and energy teams report.
Why WHR deserves production-grade KPIs
Electricity is a large operating cost in cement, and WHR is one of the few sources of power that uses heat already leaving the process. When it underperforms, the cost shows up quietly as extra grid purchases.
Without defined KPIs
Generation is reported as a single monthly total, outages are described informally and nobody can say whether a low month came from the kiln, the equipment or the meter.
With defined KPIs
Output is normalized, availability is separated from kiln downtime, and each shortfall is tied to a coded cause and a work order.
The KPI ledger: what to measure and how to define it
Agree each definition before the first report goes out. Different formulas for the same KPI are the fastest way to lose credibility with auditors and boards.
A worked example with illustrative numbers
The figures below are invented to show the arithmetic. They are not benchmarks, so replace them with your own meter data.
A capacity factor of 70 percent does not automatically mean a problem. Kiln load, ambient conditions and planned stops all shape the result, which is why KPI context matters.
Where recovered kWh go missing
Shortfalls fall into three families. Sorting each event into a family keeps the review honest and shows where maintenance can actually act.
- Kiln stops and reduced kiln load
- Lower exhaust gas temperature or flow
- Changes in clinker cooler operation
- Mill-on and mill-off gas conditions
- Dust fouling on boiler heat surfaces
- Air in-leakage through ducts and joints
- Turbine, condenser and cooling tower losses
- Pump, valve and instrument failures
- Meter faults or unsynchronized time stamps
- Inconsistent clinker tonnage records
- Missing outage reasons
- Auxiliary consumption not metered
Maintenance has direct influence over the second family and indirect responsibility for the third. Clean data and reliable equipment make the first family easier to explain.
Two quiet thieves: boiler fouling and air in-leakage
Neither problem trips an alarm, yet both lower recovered energy day after day. Treat them as routine reliability topics rather than surprises found at overhaul.
Boiler fouling
- Dust builds on tubes and insulates them from the gas
- Exit gas temperature and draft loss trend upward
- Cleaning intervals should follow trends, not only the calendar
- Record cleaning dates so effects on output are visible
Air in-leakage
- Cold air enters through ducts, joints and hopper valves
- Gas temperature falls and fan power rises
- Leak surveys at planned stops find most sources
- Repairs are logged against the duct section involved
WHR subsystems, risks and the KPIs they move
| Subsystem | Maintenance risk | KPI affected | Planned task |
|---|---|---|---|
| Preheater and cooler boilers | Dust deposits and tube wear reduce heat transfer | Specific generation, capacity factor | Cleaning, rapping system checks and thickness inspections |
| Ducts and expansion joints | Air in-leakage and thermal stress cracks | Gas temperature, net output | Leak survey and joint inspection at planned stops |
| Dust hoppers and valves | Jamming or leaking discharge | WHR availability | Valve inspection and drive checks |
| Steam turbine | Vibration, bearing wear and governor faults | Gross generation, availability | Vibration trending, oil analysis and overhaul planning |
| Condenser and cooling tower | Vacuum loss, fouled tubes, fill and fan problems | Efficiency, auxiliary power | Cleaning, vacuum checks and fan inspection |
| Feed water system | Pump wear and poor water quality | Availability and boiler life | Pump condition checks and water test records |
| Generator and protection | Insulation aging and relay setting errors | Trips and availability | Electrical testing and protection verification |
| Meters and instruments | Calibration drift and communication loss | All reported KPIs | Calibration schedule with records |
Reading the KPI trend: pattern to likely cause
These patterns are starting hypotheses for investigation, not diagnoses. Confirm each one with inspection and process data.
| KPI pattern | Possible cause | First check |
|---|---|---|
| Capacity factor low with kiln running steadily | Boiler fouling, in-leakage or turbine losses | Gas temperatures, draft loss and condenser vacuum |
| Specific generation drops after a stop | Incomplete cleaning or new leaks | Stop work scope and post-restart readings |
| Availability low with frequent short trips | Protection settings, instrument faults or auxiliary failures | Trip log and instrument calibration history |
| Net output low while gross looks normal | High auxiliary consumption | Pump, fan and cooling tower condition |
| Month-to-month figures do not reconcile | Meter error or boundary changes | Meter calibration and calculation rules |
Connect WHR output to the equipment behind it
Track boiler, turbine and auxiliary maintenance in the same platform that stores meter checks and inspection records, so every KPI dip has a documented cause.
Use kiln stops as the WHR maintenance window
WHR cannot generate without kiln gas, so planned kiln stops are the natural window for boiler and duct work. Planning around that window protects generation after restart.
- Review defect backlog on WHR assets
- Reserve spares and tubes
- Prepare job plans and isolation steps
- Book contractors and permits
- Clean boiler surfaces and hoppers
- Survey ducts for leaks
- Inspect turbine and condenser
- Test protections and instruments
- Check vacuum, vibration and temperatures
- Compare output with the previous period
- Close work orders with findings
- Record lessons for the next stop
From meter to board report: a clean data lineage
Sustainability teams need numbers they can defend line by line. A visible chain from meter to report prevents last-minute reconciliation.
Reporting rules differ by framework and country. Confirm boundary, emission factor and metering requirements with your sustainability team before publishing figures.
A monthly WHR review agenda
A short, repeatable agenda keeps energy, process and maintenance teams looking at the same facts.
Spares and contractor planning for a WHR plant
WHR equipment is specialized, and lead times can be long. A failure without the right spare in stock turns a short repair into weeks of lost generation.
- Link each spare to the asset and failure mode it protects
- Review stock levels before every planned kiln stop
- Keep contractor details, permits and past job reports in the asset record
- Track turbine and generator overhaul intervals alongside run hours
When inventory, assets and work orders sit in one system, planners can see which repair is blocked by a missing part before the stop begins.
Do not forget auxiliary power
Net generation depends on how much energy the WHR plant uses itself. Pumps, fans, cooling tower motors and dust handling all draw power that never reaches the plant grid.
- Meter auxiliary consumption separately so net figures are credible
- Trend pump and fan motor current to spot wear before it raises consumption
- Review cooling tower and condenser condition, because poor vacuum costs both output and auxiliary energy
- Record the cause whenever auxiliary load changes noticeably between months
Dashboard views by audience
| Audience | Question answered | Useful view |
|---|---|---|
| Shift technician | What must be checked and fixed this shift? | Open work orders and inspection route for WHR assets |
| Reliability engineer | Which failures repeat and why? | Failure causes, downtime and cost by asset |
| Plant manager | Is WHR delivering what the plant expects? | Availability, capacity factor and backlog trend |
| Energy manager | How much grid power was replaced? | Net generation and grid offset by month |
| Sustainability lead | Can we defend the number to a board or CDP? | Calibration status and documented outage causes |
Trends influencing cement WHR performance
Many cement producers want lower grid dependence and lower reported emissions, and WHR is one lever among several. At the same time, plant changes can move the heat available to the boilers, so KPI baselines should be reviewed when the process changes.
- Higher alternative fuel use can alter gas flow, dust load and temperature
- Changes in kiln feed or clinker factor strategies change kiln output and exhaust conditions
- Greater scrutiny of climate disclosures raises expectations for traceable numbers
- Ageing WHR installations need structured condition monitoring and spares planning
Common mistakes in WHR KPI reporting
How Oxmaint supports WHR KPI work
Oxmaint is a maintenance management platform rather than a metering or SCADA system. It keeps the maintenance side of WHR organized and traceable.
- Preventive maintenance schedules for boilers, turbine, condenser and cooling tower
- Inspection rounds with meter readings, notes and photos from mobile devices
- Work orders with priority, assignment and notifications for WHR trips and defects
- Asset records showing repair history, parts used and downtime per component
- Calibration tasks for meters and instruments that feed reported KPIs
- Dashboards and reports on completion, availability and repeat failures
- Condition-based triggers where sensor or vibration data is available in your setup
WHR data quality checklist
- Generator, export and auxiliary meters have current calibration records
- Clinker production figures use the same boundary as the KPI period
- Every WHR outage has a coded reason and a duration
- Planned stops are separated from trips in availability calculations
- Grid emission factors and their source are documented
- Open work orders on turbine and boiler assets are reviewed monthly
Frequently asked questions
What is a WHR generation KPI?
It is a defined measure of recovered electricity, such as net kWh, kWh per tonne of clinker, capacity factor or grid offset.
Why does capacity factor fall?
Common causes are kiln stops, lower gas temperature, boiler fouling, air in-leakage and turbine or condenser problems. Book a demo to see how causes are recorded.
Can a CMMS measure kWh?
It can log readings and calibrations, while meters and control systems measure generation. The CMMS shows the equipment story behind the numbers.
How do KPIs support ESG reporting?
Documented meters, outage causes and calculation rules make disclosures easier to defend to boards and external reviewers.
Where should we start?
Register WHR assets, load PM and calibration tasks, then sign up to pilot the workflow on the turbine and boilers.
Report WHR performance with the maintenance proof behind it
Give energy, sustainability and reliability teams one platform for WHR maintenance, calibrations and downtime causes, so every kWh recovered is easier to explain.