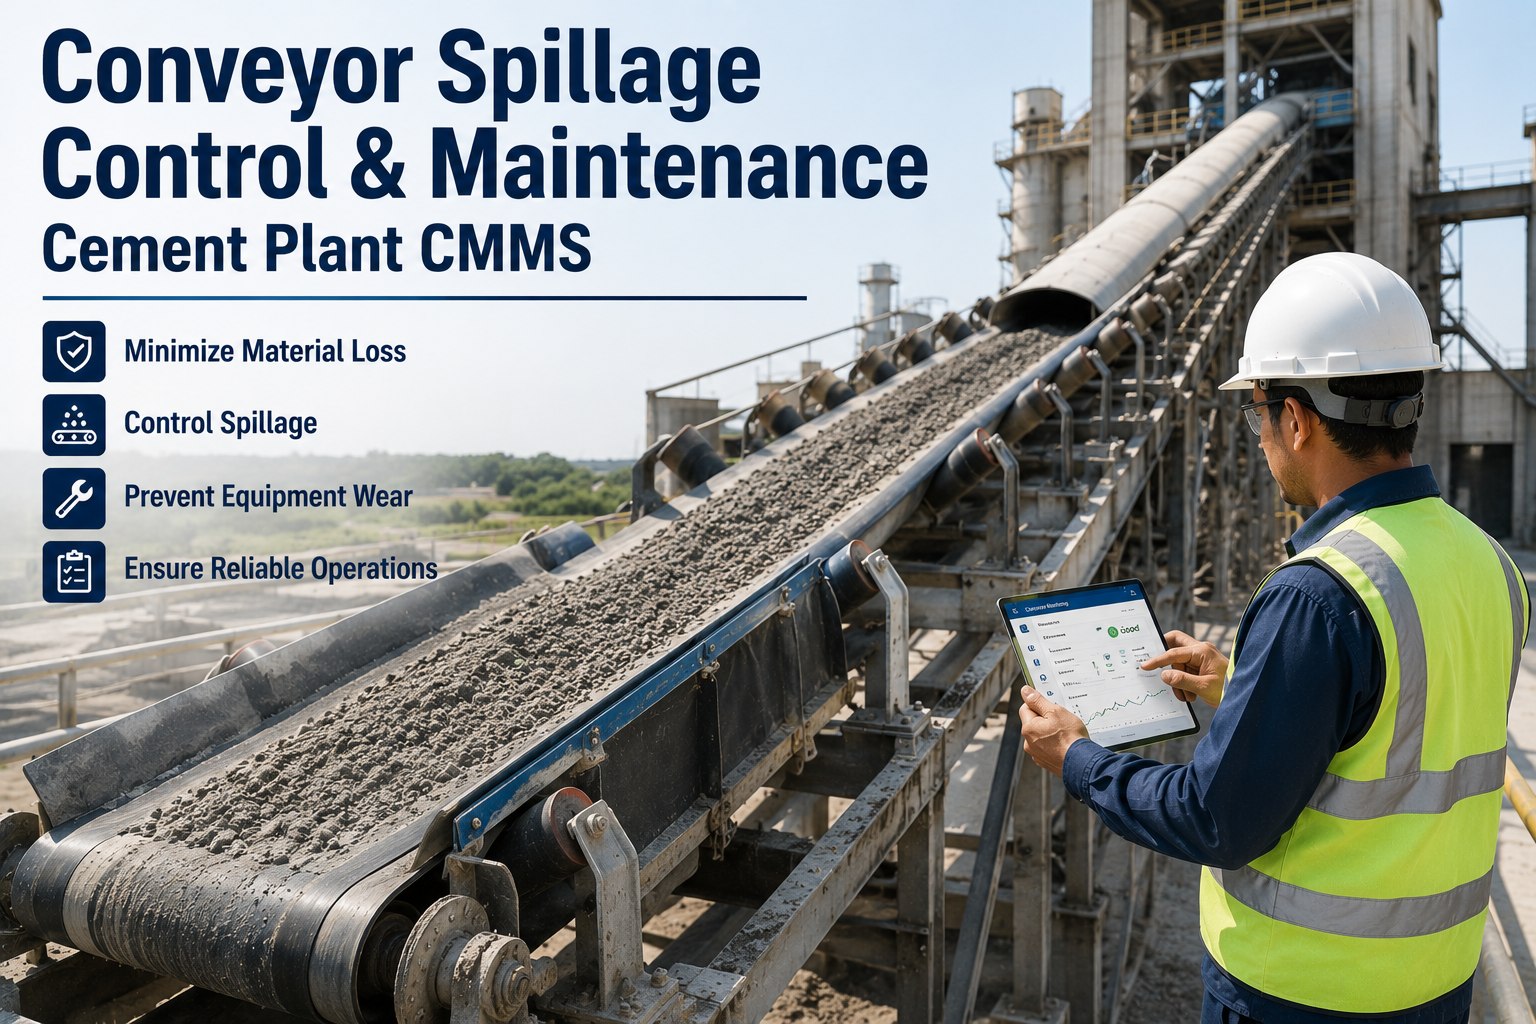
Conveyor spillage in a cement plant is rarely just a housekeeping nuisance — every kilogram of clinker dust or limestone fines that escapes the belt is paid for three times: in lost material, in the labour to shovel it back, and in the accelerated wear it inflicts on idlers, skirt rubber and the belt edge itself. Across a mid-size plant running 12 conveyors, uncontrolled spillage commonly accounts for 0.3–0.7% of annual throughput loss and is a leading contributor to belt fires, with friction against spilled material cited in roughly 1 in 4 conveyor fire incidents. This guide breaks the problem into a CMMS-linked maintenance program — chute design, skirt board service, impact bed PM, belt tracker adjustment and spillage collection — so spillage stops being a chronic operational and safety issue and becomes a tracked, scheduled KPI. Ready to digitise the whole program? Start Free Trial and configure your spillage PMs today.
Is spillage costing your cement plant more than the belt it runs on?
A single 1,200 mm belt carrying 800 TPH of clinker can shed 4–7 kg of material per kilometre per hour when skirting, impact beds and trackers fall out of spec — translating to tens of thousands of dollars in lost material, labour and premature belt replacement every year. A CMMS-driven spillage program brings that figure below 0.2% of throughput.
Why conveyor spillage is a P&L line, not a broom problem
A 180-asset cement plant spending roughly $42,000 a year on spillage-related cleanup labour, replacement skirt rubber and belt-edge repairs typically recovers 60–70% of that cost within the first year of a CMMS-scheduled spillage program. The breakdown below shows where the money actually goes.
A 2,500 TPD plant in the GCC was losing an estimated 6 kg of material per hour across its 14-belt clinker conveyor network — roughly 525 tonnes per year, or $31,500 in lost clinker at $60/tonne. After tagging each transfer point in the CMMS, scheduling weekly skirt-board inspections, monthly impact-bed checks and quarterly belt-tracker calibration, spillage dropped to under 1.5 kg per belt-hour within four months. The payback: 11 weeks, with belt-edge failures falling 38% year-over-year.
The 12-point conveyor spillage inspection grid
Every transfer point on a cement conveyor should be inspected against the same structured grid. These are the exact checks a CMMS schedules, assigns and tracks — weekly for high-tonnage belts, bi-weekly for secondary lines.
- Skirt rubber gap ≤ 3 mm at belt edge, full length of chute
- No hardened, glazed or cracked skirt rubber — replace at 40% wear
- Skirt board liners (Hardox/ceramic) inspected for cupping or pull-back
- Impact bars within 2 mm of belt profile, no missing or crushed bars
- UHMW polyethylene top surface free of gouges or melt grooves
- Transition idlers rotate freely, no frozen rollers at loading zone
- Belt runs within ±25 mm of centreline under full load
- Trainer idlers pivot freely, no seized bushings
- Pulle crowned and lagging intact — no uneven wear bands
- Chute liner wear ≤ 6 mm, no flow-restricting material build-up
- Spillage collection hoppers empty, discharge clear
- Dust suppression nozzles unblocked, water/air pressure at spec
Scheduling the spillage program in a CMMS
The table below maps each spillage control to its recommended PM frequency, trigger condition and the CMMS work-order type that should carry it. Frequencies are calibrated for cement service — abrasive, dusty, high-tonnage.
| Spillage control | PM frequency | Trigger condition | WO type |
|---|---|---|---|
| Skirt board gap & rubber condition | Weekly (primary belts) / Bi-weekly (secondary) | Gap > 5 mm or rubber hardness > 70 Shore A | Inspection + Corrective |
| Impact bed bar integrity | Monthly | Bar wear > 3 mm or visible crushing | Preventive inspection |
| Belt tracker calibration | Quarterly or after 500 run-hours | Belt drift > ±25 mm from centreline | Scheduled adjustment |
| Chute liner thickness check | Quarterly | Liner ≤ 6 mm remaining at any test point | Condition-based PM |
| Spillage collection hopper cleanout | Shiftly visual / Weekly deep clean | Hopper fill > 40% capacity | Autonomous maintenance |
| Dust suppression system check | Monthly | Nozzle blocked or pressure outside 2–4 bar range | Preventive inspection |
From audit to 0.2% — a 6-month deployment path
A structured CMMS rollout moves a cement plant from reactive spillage firefighting to a measurable KPI in roughly 180 days. Each milestone below carries a tangible deliverable and a target spillage-as-%-of-throughput figure.
Every transfer point, skirt zone, impact bed and tracker is tagged in the CMMS with photos, belt spec and current spillage kg/hr baseline. Target: 100% asset coverage, baseline spillage measured at 0.6–0.8% of throughput.
The 12-point checklist is configured as reusable PM templates, assigned to belts by criticality tier. Weekly, monthly and quarterly cadences go live. First automated work orders issue in week 6.
Corrective WOs close out the highest-leakage transfer points — rubber replaced, impact bars re-shimmed, chutes de-built-up. Spillage typically falls to 0.35–0.45% of throughput by end of month 3.
Quarterly tracker calibration cycle runs across all belts. Belt-edge failures drop sharply as drift is brought within ±25 mm. Spillage lands at 0.25–0.30%.
Spillage-as-%-of-throughput becomes a live CMMS dashboard KPI, reviewed monthly. Target 0.2% sustained. Belt fire risk and housekeeping labour costs are down 35–45% versus baseline.
What changes when spillage moves into a CMMS
The shift from a broom-and-shovel culture to a CMMS-scheduled program is not cosmetic — it shows up in material loss, belt life, fire risk and audit readiness within one quarter.
| Dimension | Reactive / manual | CMMS-scheduled |
|---|---|---|
| Spillage as % of throughput | 0.5–0.8% | < 0.2% |
| Skirt rubber replacement trigger | Visible leak / failure | 40% wear or 70 Shore A hardness |
| Belt-edge failure frequency | 1–2 per belt per year | 1 per belt per 2–3 years |
| Spillage fire incident exposure | Elevated — material accumulates unnoticed | Low — shiftly hopper checks logged in CMMS |
| Audit & compliance traceability | Paper logs, gaps, no photos | Full digital WO history with photos & signatures |
"After we moved spillage PMs into Oxmaint, our monthly cleanup labour dropped by 36% and we caught a skirt-board failure on the C-04 clinker belt three weeks before it would have shredded the edge. The work order, the photo and the sign-off are all in the system."
Turn spillage from a daily fire drill into a tracked KPI
Deploy the full 12-point spillage PM library, automated work orders and live KPI dashboards across every conveyor in your plant — in under a week.
Cement conveyor spillage — answered
What is an acceptable spillage rate for a cement conveyor?
A well-maintained cement conveyor should hold spillage below 0.2% of carried throughput. High-tonnage primary belts carrying clinker or limestone typically run at 0.3–0.7% before a CMMS PM program is in place; the target after deployment is <0.2%, measured as kilograms of material lost per belt-hour against TPH.
How often should skirt board rubber be inspected and replaced?
Skirt rubber should be inspected weekly on primary belts and bi-weekly on secondary lines, with replacement triggered at 40% wear or when hardness exceeds 70 Shore A. Hardened rubber stops conforming to the belt edge and leaks fines — scheduling this in a CMMS removes the guesswork. You can configure the full PM template when you Start Free Trial.
Why do impact beds matter for spillage control?
Impact beds absorb the kinetic energy of falling material at the loading zone, keeping the belt profile flat so the skirt seal stays effective. If impact bars are crushed, missing or worn more than 3 mm below spec, the belt sags, the skirt gap opens, and fines escape continuously along the full chute length.
How does a CMMS reduce conveyor fire risk from spillage?
Roughly one in four conveyor fire incidents is linked to friction from accumulated spilled material against the belt or rotating components. A CMMS schedules shiftly hopper cleanouts, weekly spillage inspections and monthly dust-suppression checks — so material is removed before it builds into a thermal event. Every check is logged with a photo and a signature for audit traceability.
What belt-tracker drift threshold should trigger corrective action?
Belt drift beyond ±25 mm from centreline under full load is the action threshold. At that point the belt edge begins riding over or under the skirt, opening a leak path and accelerating edge wear. Quarterly tracker calibration — or calibration after every 500 run-hours — keeps drift within tolerance and is one of the highest-ROI PMs in the spillage program.
Stop shovelling. Start scheduling.
Deploy a CMMS-backed spillage control program across every conveyor in your cement plant — 12-point PM library, automated work orders, live KPI dashboards, full audit trail.
Free 14-day trial · No credit card