Average campus space utilization across U.S. higher education fell to 45% in the last academic year, down from 53% the year before — meaning more than half of every building you heat, cool, clean, and maintain sits empty most of the week. Classrooms alone reach only about 40% utilization even during peak hours, and usage drops sharply on Fridays. Most institutions still spend the same maintenance budget on every square foot regardless of how often it's actually used. Pairing space utilization data with your maintenance plan changes that — and OxMaint's space and asset platform makes the connection visible in one place.
Why Maintenance Planning Without Space Data Wastes Budget
A building running at 35% utilization still needs full HVAC service, full custodial coverage, and a place on the same preventive maintenance schedule as a building running at 80%. Without occupancy data feeding into the maintenance plan, every square foot gets treated identically — and the spaces nobody uses quietly consume the same share of the budget as the spaces everybody fights over. Closing that gap doesn't require new construction. It requires connecting two data sets that usually live in separate departments: how a space is actually used, and how much it costs to keep running.
From Occupancy Data to a Smarter Maintenance Plan
See Which Buildings Are Costing You More Than They're Worth
OxMaint layers space utilization against maintenance spend per building, so you can see exactly where your budget is propping up rooms nobody is using.
Where Underutilization Hits Hardest
Not every space type is shrinking the same way. Some have held steady while others have dropped sharply year over year, and that pattern should directly shape where maintenance dollars go next.
Matching Maintenance Tier to Actual Usage
| Utilization Level | Typical Current Practice | Data-Informed Maintenance Plan |
|---|---|---|
| High (70%+) | Standard PM schedule | Priority PM tier, faster work order response |
| Moderate (40–70%) | Standard PM schedule | Right-sized custodial and HVAC cycles |
| Low (Under 40%) | Full service regardless of use | Reduced-frequency service, reallocation candidate |
| Near-zero | Often still fully serviced | Flagged for consolidation or repurposing review |
Give Your Facilities Team One View of Space and Spend
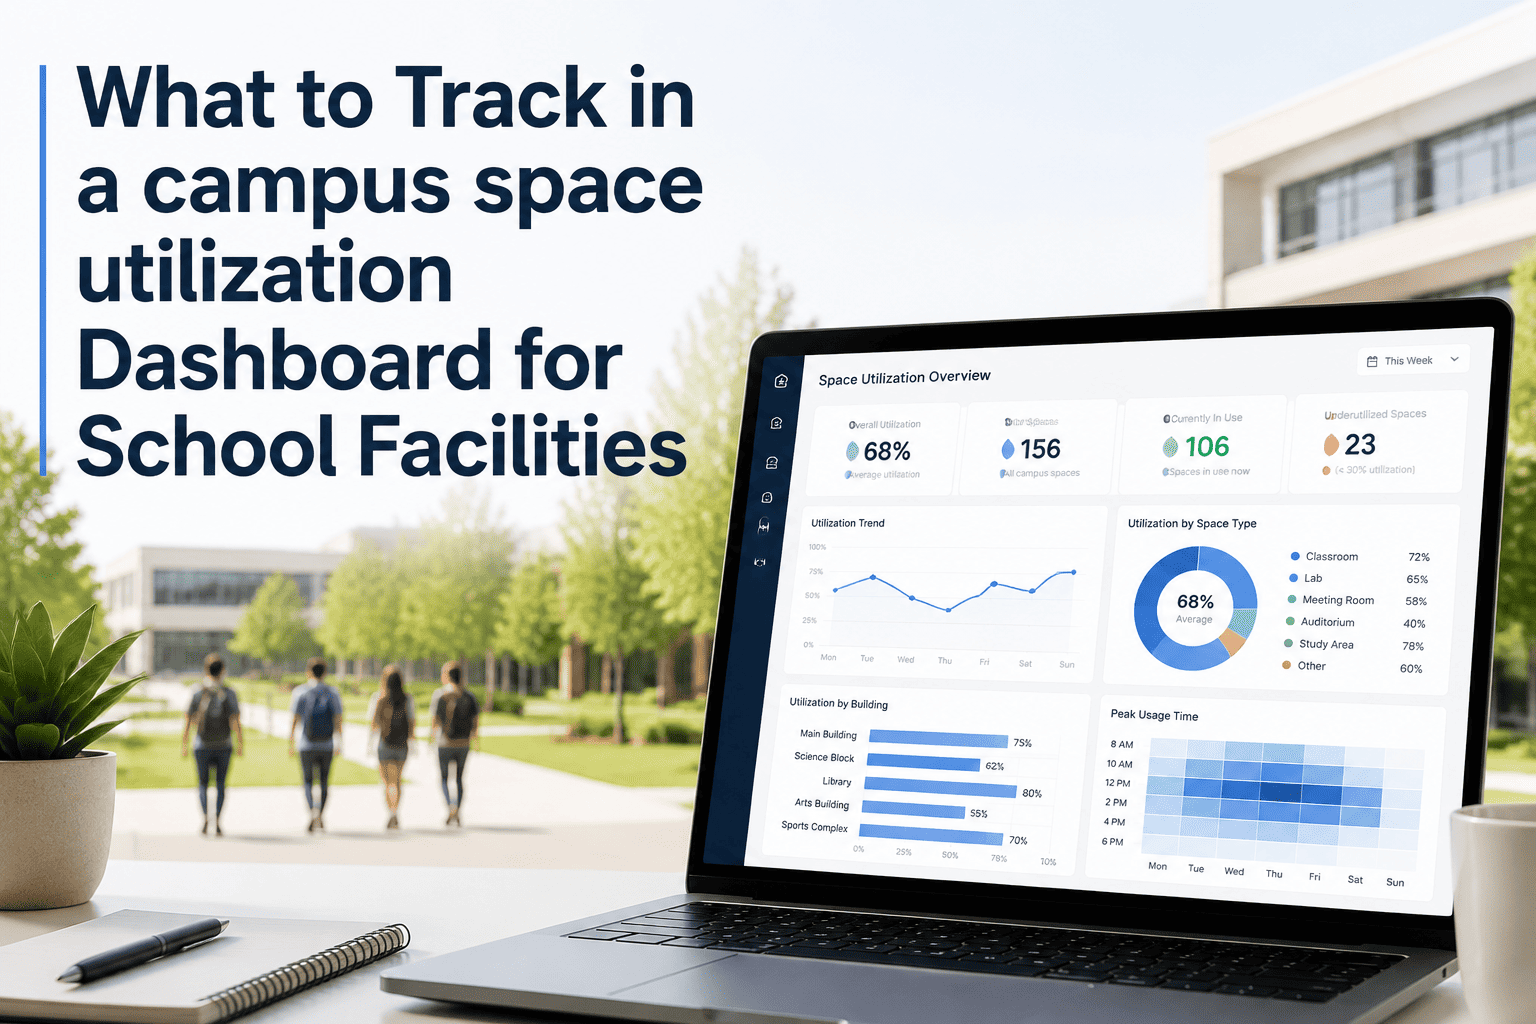
OxMaint's dashboard pairs occupancy trends with maintenance cost per building, so reallocation decisions are backed by data leadership can act on immediately.
Frequently Asked Questions
How Campuses Actually Measure Space Usage
Accurate utilization numbers depend on the measurement method, and most institutions end up combining more than one to balance cost against precision. Knowing the tradeoffs helps facilities teams decide where to invest first.
Who Should Be Acting on This Data
Space and maintenance decisions usually sit in separate departments, which is exactly why the data rarely gets connected without someone deliberately bridging the two.
Plan Maintenance Around How Your Campus Is Actually Used
OxMaint connects space utilization data to your maintenance plan, so every dollar follows real demand instead of a flat, campus-wide default.