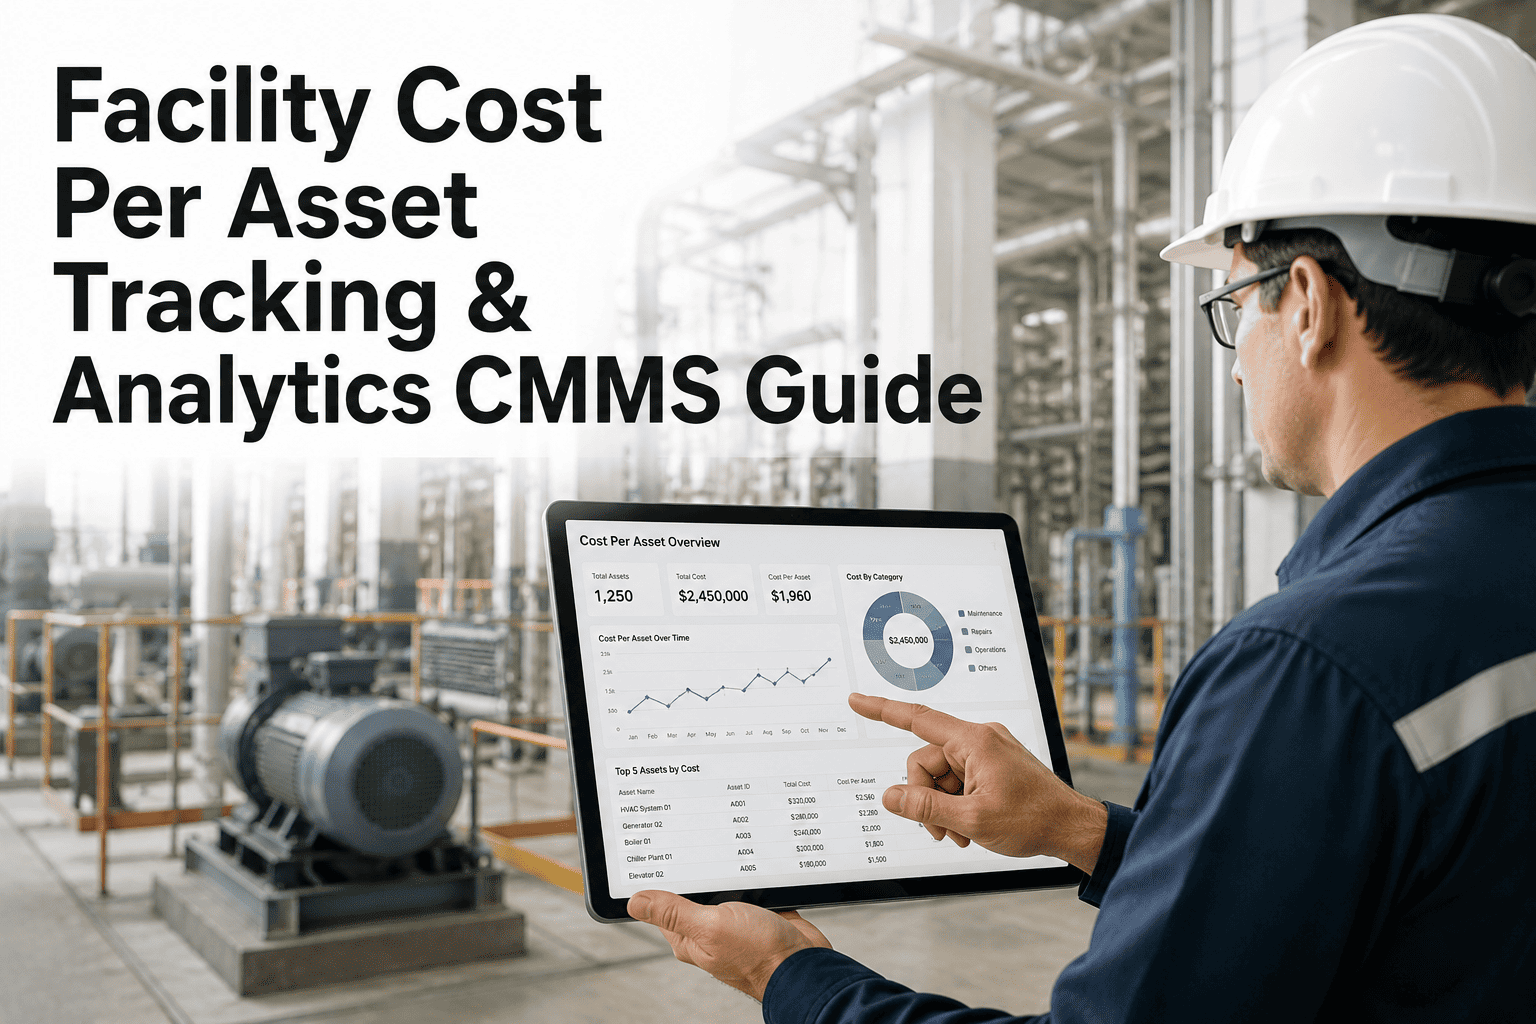
Most facility teams can tell you what a chiller, boiler, or air handler cost to buy. Far fewer can tell you what it has cost to own. Energy, repairs, labor, parts, downtime, and renewal spending land in different budgets and different systems, so the true figure never appears in one place. That gap is exactly where replacement decisions go wrong. This guide shows the fields to capture, how to capture them, and how to report them, using the ISO 15686-5 structure, and you can see how a maintenance management platform keeps that history attached to each asset.
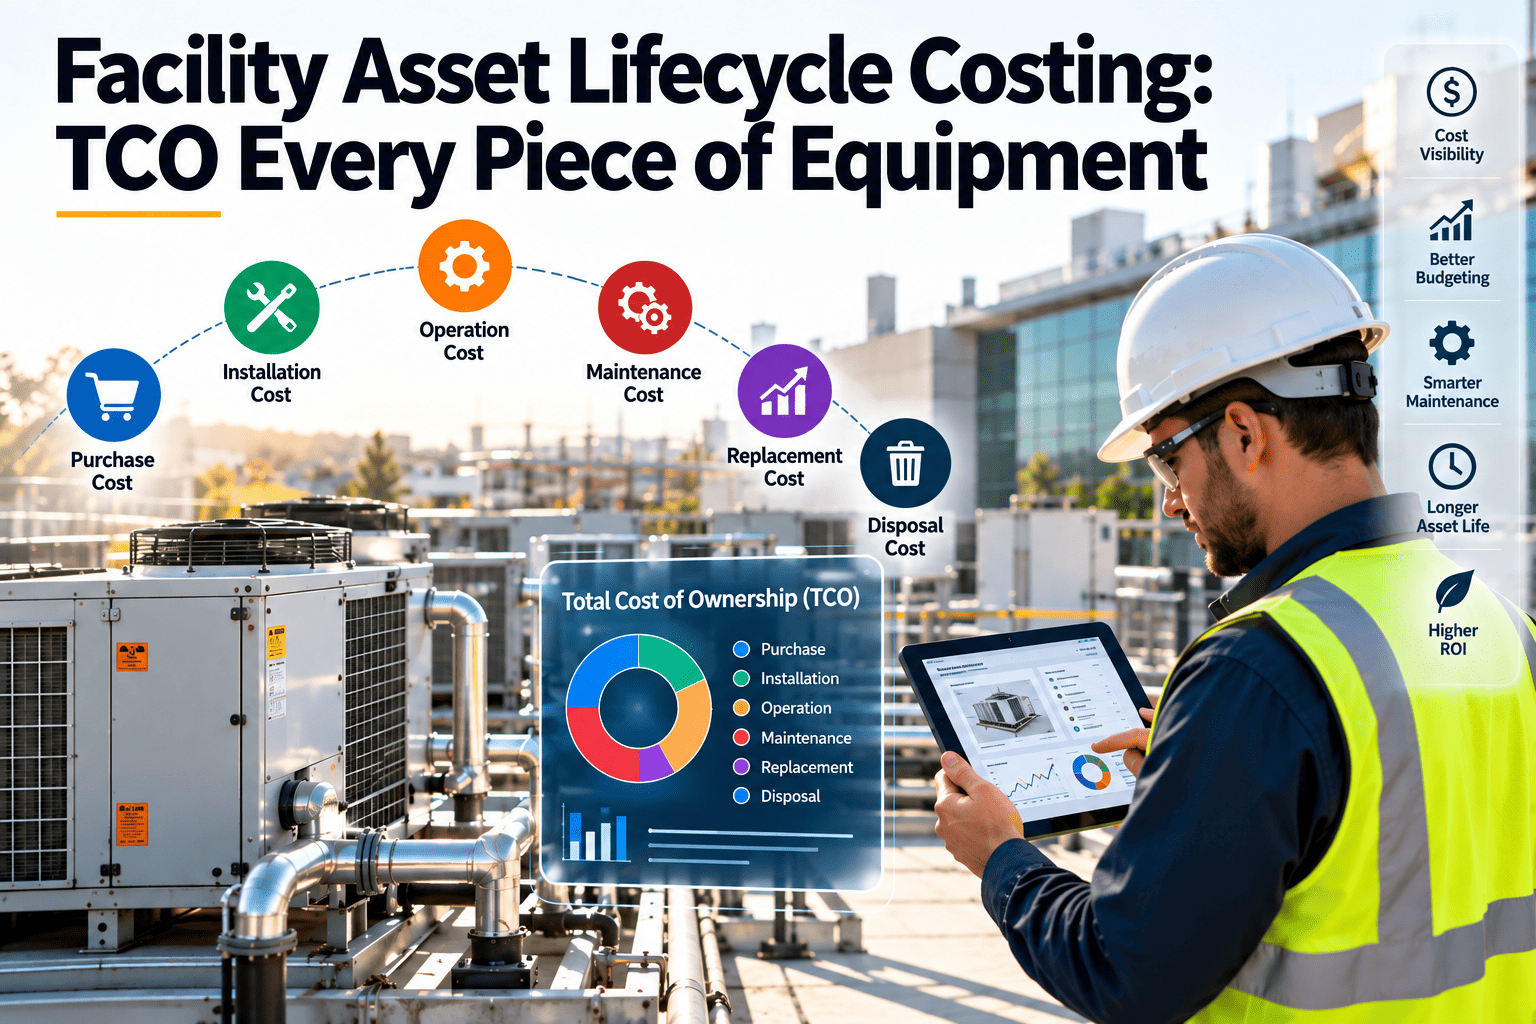
Facility Asset Lifecycle Costing: Know the Total Cost of Ownership of Every Piece of Equipment
Replacement and repair decisions need cost history, not guesses. Capture acquisition, energy, maintenance, downtime, and end-of-life cost per asset, then compare real TCO across your portfolio.
Why the purchase price is the wrong number to manage by
Purchase cost is visible, approved once, and easy to compare. Everything after commissioning is spread across years and cost centers, so it is easy to underestimate.
What the capital request shows
- Equipment price and installation
- Commissioning and handover
- Warranty period terms
What the asset really costs
- Energy or fuel across every operating year
- Scheduled service, parts, and consumables
- Emergency callouts and overtime labor
- Lost productivity when the asset is down
- Component renewals and final disposal
Lifecycle costing, often shortened to LCC, closes that gap by adding every cost the owner carries over the analysis period. Facility asset TCO is the practical version of the same idea, applied to each piece of equipment in your register.
The ISO 15686-5 cost structure, translated for facilities
ISO 15686-5 covers life cycle costing for buildings and constructed assets. It separates whole-life cost into construction, operation, maintenance, and end-of-life categories, and it allows related items such as income and externalities to be reported separately.
| Cost category | Typical facility examples | Where the data usually lives |
|---|---|---|
| Acquisition and construction | Purchase, delivery, installation, commissioning | Capital project files, purchase orders |
| Operation | Energy, water, fuel, operator labor, insurance | Utility bills, building management system, finance |
| Maintenance | Preventive tasks, repairs, parts, contractor invoices | Work orders, vendor invoices, storeroom records |
| Renewal and replacement | Compressors, motors, belts, controls, coils | Capital plans, major repair work orders |
| End of life | Decommissioning, disposal, residual value | Disposal contracts, asset register |
Why discounting matters
Costs that occur in different years are not equal. Standard practice discounts future costs to present value, so a comparison between a cheaper unit with high running costs and a dearer, efficient unit stays fair. Pick one discount rate and one analysis period, and apply both to every option.
A capture method that builds TCO as work happens
Reconstructing cost history at replacement time never works. Capture it at the moment of each event, in a single record tied to the asset.
Build a clean asset register
Give every asset a unique ID, parent location, class, install date, and criticality ranking.
Record the acquisition baseline
Store purchase price, installation cost, warranty end, expected service life, and supplier.
Charge every work order to the asset
Labor hours, parts, and contractor cost post to the work order, never to a general bucket.
Link energy and meter data
Allocate sub-metered or estimated consumption to major plant so operating cost sits beside repair cost.
Log downtime with a cause code
Capture start, end, and impact so the cost of failure includes more than the invoice.
Review cost-to-date every quarter
Compare cumulative cost against the replacement estimate and flag assets crossing your threshold.
Put every cost on the asset it belongs to
Oxmaint links work orders, parts, labor, and inspections to each asset, so cost history builds automatically.
Fields every asset record needs for TCO
You do not need dozens of fields. You need the right ones filled consistently, grouped by how they will be used in analysis.
- Asset ID, class, and location
- Manufacturer, model, serial number
- Install date and commissioning date
- Criticality and risk rating
- Purchase and installation cost
- Expected useful life
- Warranty and service contract terms
- Replacement cost estimate
- Energy or fuel consumption
- Labor hours by work order
- Parts and consumables issued
- Contractor invoices linked to jobs
- Failure date, mode, and root cause
- Downtime hours and impact
- Latest inspection or condition score
- Remaining life estimate
Why TCO data goes missing, and what changes it
The causes are rarely technical. They are process habits that make cost recording optional.
Calculating facility asset TCO step by step
The core arithmetic is simple. Discipline in the inputs is what matters.
A simple illustration
These round numbers are hypothetical and show the method only. Option A costs less to buy but more to run. Option B costs more at the start.
| Item over 15 years (present value) | Option A | Option B |
|---|---|---|
| Acquisition and install | 100 | 140 |
| Energy | 180 | 120 |
| Maintenance and parts | 90 | 60 |
| Downtime and callouts | 40 | 15 |
| Total cost of ownership | 410 | 335 |
The cheaper purchase is the more expensive asset. Your own history, not industry averages, should supply these inputs.
Repair or replace: a decision ladder
Lifecycle data turns a gut feeling into a ranked decision. Work down the ladder for each asset.
Risk and cost together
Lifecycle KPIs worth tracking
Choose a small set and report it by asset class, not only by building.
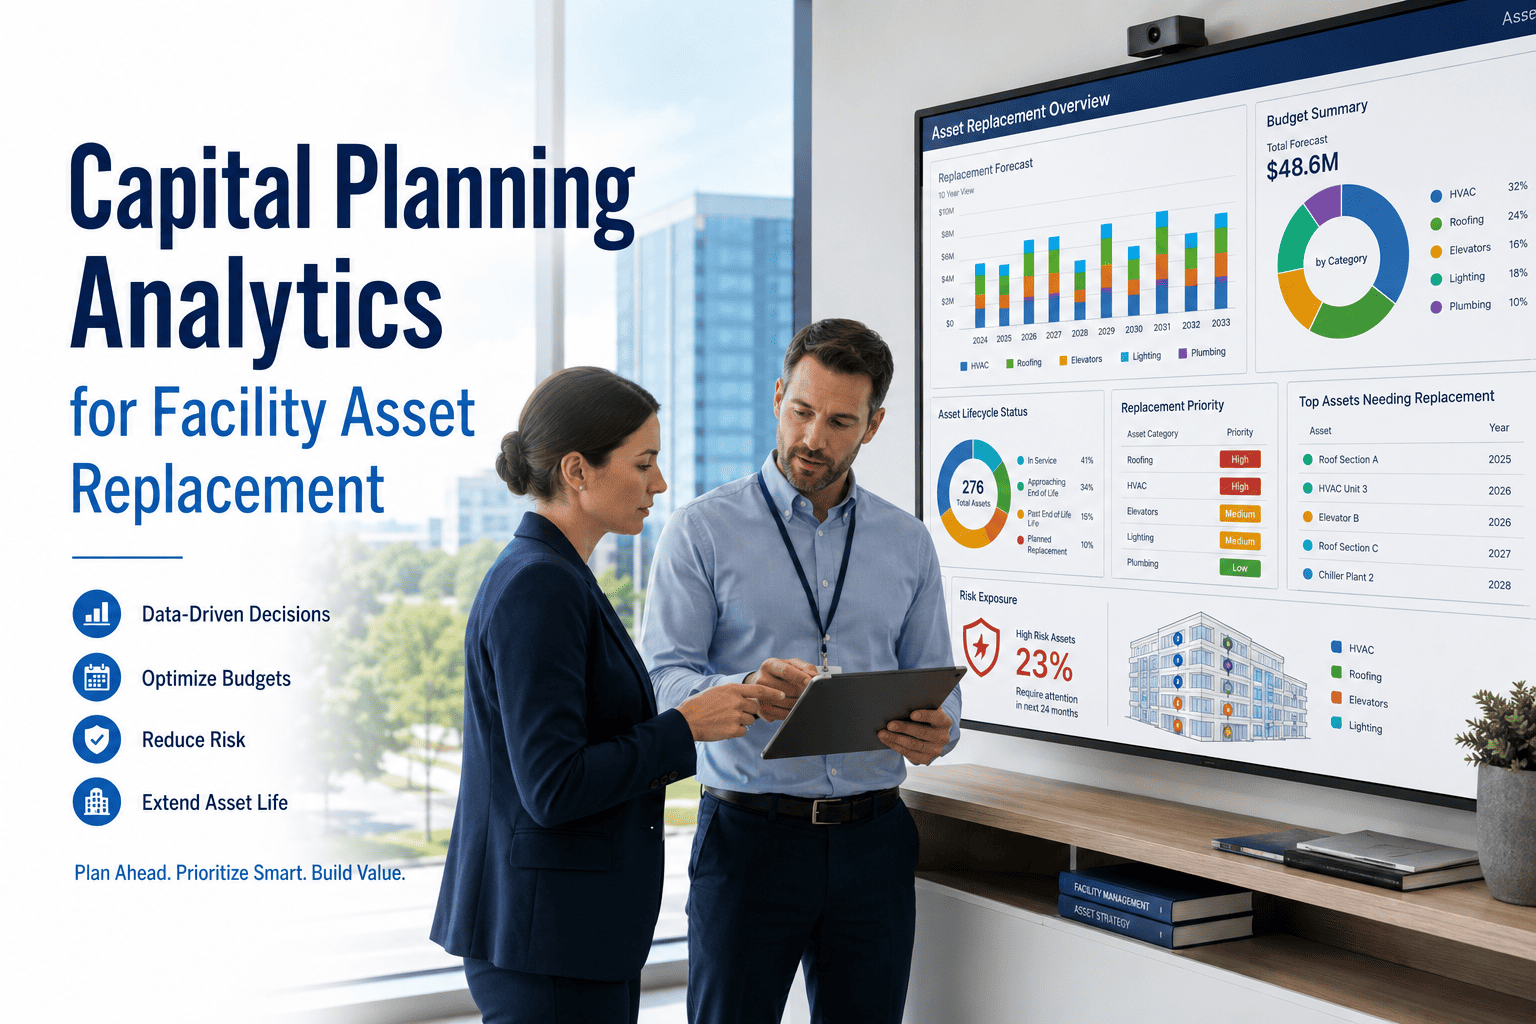
Using lifecycle history in capital planning
Once cost history exists, it feeds budgeting directly. Finance gets evidence instead of age-based guesses.
Reports that change conversations
- Top ten assets by cumulative maintenance cost, with condition scores beside them
- Replacement forecast by year, built from expected life and actual cost trend
- Reactive versus planned cost split by asset class
- Supplier and contractor cost comparison on equivalent assets
- Energy cost per asset against manufacturer or design expectations
Where Oxmaint fits
Oxmaint keeps asset records, preventive maintenance schedules, work orders, parts usage, inspections, and reports in one place. Mobile work order completion captures labor and parts at the job, and dashboards roll cost up by asset, class, or site.
- Asset management with unique IDs and location hierarchy
- Work orders that carry labor, parts, and notes to the asset
- Preventive and corrective maintenance cost split in reports
- Inventory links so parts spend reaches the asset record
- Inspection history that supports condition-based decisions
Frequently asked questions
What is the difference between LCC and TCO?
LCC is the formal method, as in ISO 15686-5. TCO is the everyday owner-focused version for equipment decisions.
Which assets should I start with?
Begin with high-cost, high-criticality plant such as chillers, boilers, generators, and air handlers. Book a demo to plan your register.
How many years of history do I need?
Even one year of clean cost data is useful. Accuracy improves each year as patterns emerge.
Do I need to include downtime cost?
Yes where downtime affects revenue, safety, or tenants. Record hours first and apply an agreed hourly impact value later.
Can a CMMS calculate TCO for me?
It captures and totals the cost inputs per asset. You can start free and test it on a few assets.
Make your next replacement decision with real cost history
Start building asset-level cost records today, so the next budget cycle runs on evidence.