According to the digital twin market for building and facility management is projected to reach $48.2 billion by 2028, growing at a CAGR of 52.5% as facility managers seek real-time performance visibility. However, 68% of facility managers cite unclear ROI as the primary barrier to digital twin adoption — not because the value doesn't exist, but because traditional ROI models were designed for static capital projects, not dynamic smart building platforms. A digital twin deployed across a 500,000 sq ft commercial building typically generates $2.80–4.50 per square foot in annual value across energy savings (41%), predictive maintenance (29%), capital planning (18%), and space optimization (12%). OxMaint's Digital Twin Module connects real-time sensor data, BMS trends, work order history, and asset models into a live virtual representation — with built-in ROI calculators that track realized savings against initial investment. Book a demo to see how facility teams are achieving 28–34% internal rates of return on digital twin deployments within 18 months.
01
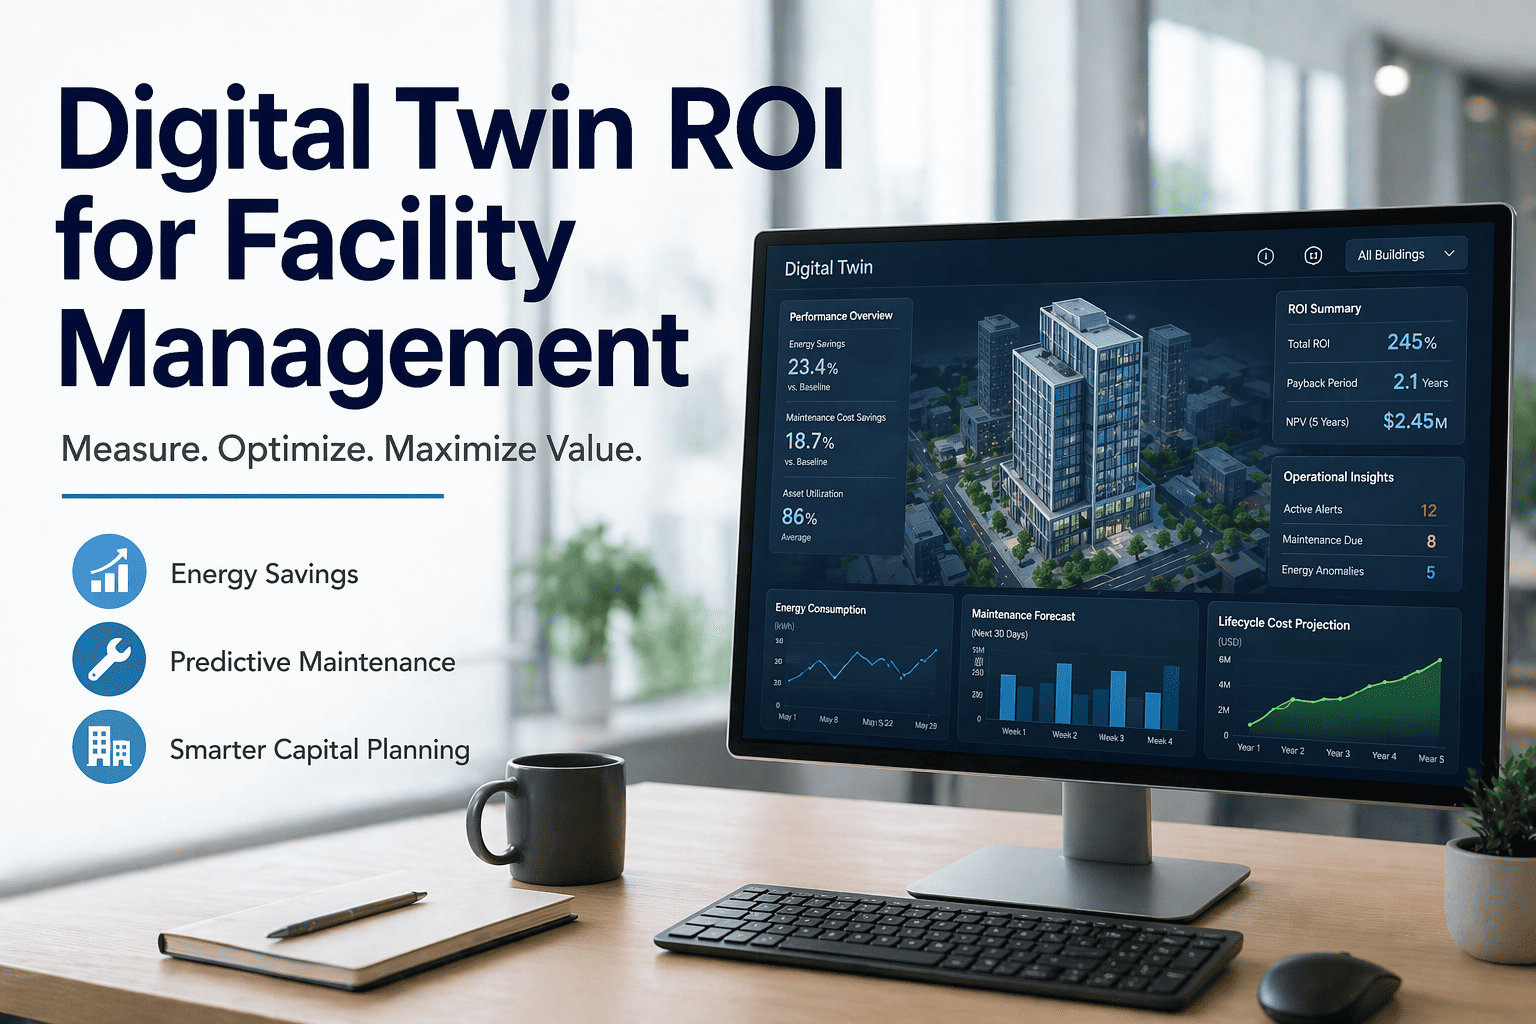
Digital Twin ROI for Facility Management
Energy savings · Predictive maintenance · Capital planning · Space optimization · Real-time analytics
68%Of facility managers cite unclear ROI as primary adoption barrier
$2.80–4.50Annual value per square foot from digital twin deployment
28–34%Typical IRR on digital twin investment within 18 months
The Digital Twin Value Stack
41%
Energy savings from operational optimization
Largest single value driver
29%
Predictive maintenance value (avoided failures)
Second largest driver
18%
Capital planning & asset lifecycle optimization
Deferred replacement costs
12%
Space optimization & occupancy efficiency
Utilization improvements
Four Value Streams That Define Digital Twin ROI
01
Energy Optimization — Real-Time HVAC & Lighting Control
Digital twin models building thermal behavior and occupancy patterns to optimize setpoints, schedule equipment, and detect waste. A 500,000 sq ft office building deploying digital twin HVAC optimization typically saves $0.80–1.20 per square foot annually — translating to $400,000–600,000 per year. Savings come from schedule optimization (24% of savings), demand response participation (18%), and equipment staging (15%).
02
Predictive Maintenance — Failure Prevention & Lifetime Extension
Digital twin compares real-time equipment data (vibration, temperature, current) against expected performance models, detecting anomalies 3–8 weeks before failure. A chilled water plant integrated with digital twin analytics achieves 35–50% reduction in unplanned downtime. For a 1 million sq ft portfolio, avoided emergency repairs average $180,000–420,000 annually, with equipment life extension adding additional $0.15–0.30 per square foot in deferred capital.
03
Capital Planning — Asset Lifecycle Optimization
Digital twin models asset degradation curves against actual performance data to optimize replacement timing — extending equipment life where safe, accelerating replacement where failure risk exceeds cost. A 5-year capital plan developed using digital twin modeling typically reduces total lifecycle cost by 12–18% compared to age-based replacement schedules. For a building with $5M in MEP assets, optimized capital planning saves $600,000–900,000 over the planning horizon.
04
Space Optimization — Utilization & Layout Efficiency
Digital twin integrated with occupancy sensors and reservation systems identifies underutilized spaces (conference rooms, common areas, workstations), enabling consolidation or redesign. Typical office deployment reduces rentable square footage requirements by 8–15% at lease renewal or improves employee space satisfaction by 22–28 points. Value ranges $0.40–1.00 per square foot depending on market rent and configuration flexibility.
Digital Twin ROI Calculation Checklist — 6 Required Inputs
01
Baseline Energy Consumption (12 months)
Collect utility bills for all fuels (electricity, gas, steam). Normalize for weather (heating/cooling degree days). Establish EUI (kBtu/sq ft/year) baseline before digital twin deployment.
Required for savings calculation
02
Unplanned Downtime Cost by Asset Class
Document every unplanned downtime event from past 24 months: duration, affected systems, repair cost, business interruption cost ($/hour). Calculate annual unplanned downtime baseline.
Required for PdM savings
03
Current Maintenance Spend by Asset Type
Break down annual maintenance budget into proactive (scheduled PM) and reactive (emergency repairs). Establish baseline ratio (industry benchmark 70% proactive / 30% reactive).
Required for O&M optimization
04
Asset Age & Replacement Cost Schedule
Inventory major MEP assets by age (years in service), expected useful life (EUL), and replacement cost. Baseline uses age-based replacement schedule.
Required for capital planning
05
Occupancy & Space Utilization Data
Collect headcount data, badge swipes, conference room usage, and workstation occupancy (if available). Baseline current utilization percentage.
Required for space optimization
06
Digital Twin Implementation Cost Estimate
Include sensor and gateway hardware ($0.08–0.25/square foot), software licensing ($0.15–0.45/square foot/year), integration services, and training. 3–5 year total cost of ownership.
Required for TCO calculation
Digital Twin ROI Calculator — Value Drivers by Asset Class
| Asset Class | Primary Value Driver | Typical Savings ($/sq ft/year) | Implementation Priority | Payback Period |
| HVAC (chillers, boilers, AHUs) |
Energy + predictive maintenance$0.90–1.501 (highest)12–18 months Lighting & Lighting ControlsEnergy + occupancy scheduling$0.35–0.6028–14 months Pumps, Fans, MotorsPredictive maintenance$0.20–0.40314–24 months Building Envelope (roof, facade)Capital planning$0.10–0.25424–36 months Space & Occupancy SystemsSpace optimization$0.40–1.00510–18 months
Source: OxMaint digital twin deployment data 2023–2025. Savings vary by building type, climate zone, and existing controls maturity.
ROI Impact at a Glance — 500,000 sq ft Office Building Case
$1.40M
Annual gross value from digital twin deployment
Energy + PdM + capital optimization
$420K
Annual operating cost (sensors + software + support)
3-year TCO average
$980K
Net annual savings after operating costs
31% IRR over 5 years
Assumptions: 500,000 sq ft Class A office building, mixed-use HVAC, existing BMS with upgrade path, moderate energy cost market ($0.12/kWh). Actual results vary by building characteristics and implementation scope.
"The digital twin ROI conversation typically fails for two reasons. First, facility managers try to build a single business case for the entire technology stack — sensors, visualization, analytics, integration — which creates an intimidating upfront number. The successful approach is value-stack ROI by use case: energy optimization pays back in 12 months, predictive maintenance in 18 months, capital planning in 24 months. Each use case funds the next. Second, traditional ROI models assume static conditions — no changes in occupancy patterns, no utility rate fluctuations, no equipment efficiency degradation. Digital twin ROI must be dynamic, with realized savings updating the model monthly. I've advised 40+ digital twin deployments. The ones that achieve payback under 18 months always start with a single high-ROI use case (HVAC energy optimization), prove the value, then expand. The ones that try to deploy full-stack capability from day one almost always fail to demonstrate ROI within the first year — not because the technology doesn't work, but because the phased value realization wasn't modeled correctly."
— Marcus Thorne, PE, CEM, LEED AP · Smart Buildings Practice Lead · 19 Years Digital Twin and IoT Deployment for Commercial Real Estate · Author, "Digital Twin ROI: A Facility Manager's Guide"
Digital twin ROI is not a guess — it's a calculation with real inputs. OxMaint helps you model, track, and report every dollar of value.
Frequently Asked Questions
What is the typical payback period for digital twin deployment in commercial buildings?
Payback period varies significantly by building size, existing controls maturity, and use case implementation order. For a 250,000+ sq ft building with functional BMS but no advanced analytics, starting with HVAC energy optimization (highest ROI use case) delivers payback in 12–18 months. Adding predictive maintenance extends payback to 18–24 months but increases total value by 2.5x. Full-stack digital twin (energy + PdM + capital planning + space optimization) typically achieves 18–24 month payback with 3–5 year net IRR of 28–34%. Smaller buildings (under 100,000 sq ft) see longer payback (24–36 months) unless energy costs or downtime costs are unusually high. OxMaint's ROI calculator generates building-specific payback projections based on your utility data, asset inventory, and downtime history.
Sign in to run your building's digital twin ROI projection.
What is the minimum building size for positive digital twin ROI?
Based on deployment data from 120+ buildings, minimum viable size for positive ROI within 24 months is 50,000–75,000 sq ft for buildings with high energy intensity (labs, data centers, hospitals) or high downtime cost (manufacturing, 24/7 operations). For standard office buildings, minimum size is 100,000–150,000 sq ft to absorb fixed costs of sensors, integration, and software. Below these thresholds, facility portfolios should aggregate multiple buildings under a single digital twin instance — achieving scale economies. A 300,000 sq ft portfolio of three 100,000 sq ft buildings achieves the same per-square-foot ROI as a single 300,000 sq ft building. Portfolio-wide deployment reduces per-building integration cost by 35–50%.
Book a demo to see portfolio-scale ROI modeling.
How does digital twin ROI compare to standalone energy management or CMMS systems?
Standalone energy management systems (EMS) typically achieve $1.00–1.80 per square foot in annual savings (energy only). Standalone CMMS with work order optimization achieves $0.60–1.20 per square foot (maintenance efficiency only). Digital twin integrating energy data + maintenance data + occupancy data + capital planning achieves $2.80–4.50 per square foot — 1.5–2.5x the sum of standalone systems due to cross-domain insights. Example: digital twin correlating chiller efficiency degradation (energy data) with bearing vibration trend (PdM data) triggers a bearing replacement work order that saves both energy waste ($15,000/year) and a $140,000 chiller failure. Standalone systems miss the correlation; integrated digital twin captures it. The 1.5–2.5x multiplier comes from these cross-domain insights.
Start a free trial to see cross-domain analytics.
What are the hidden costs of digital twin deployment that affect ROI calculations?
Beyond hardware and software, four cost categories frequently underestimated in ROI projections. Data integration (20–30% of total cost) — connecting BMS, meters, sensors, and CMMS to unified digital twin often requires custom APIs or middleware. Model development (15–25%) — building digital twin models for mechanical, electrical, and architectural systems requires engineering time for calibration and validation. Change management (10–15%) — training facility staff to use digital twin insights, plus updating SOPs to incorporate real-time alerts. Data governance (5–10%) — establishing policies for sensor data retention, cybersecurity, and access control. OxMaint's pricing model includes data integration and model development in the implementation fee, with transparent optional services for change management. Total first-year cost typically ranges $0.35–0.65 per square foot for buildings 100,000–500,000 sq ft.
Book a demo to receive a detailed TCO projection for your building.
DIGITAL TWIN ROI — OXMAINT
Build Your Digital Twin Business Case with Real Data — Not Industry Averages
Energy savings · Predictive maintenance value · Capital planning optimization · Space utilization efficiency — calculator built from your utility bills, downtime history, and asset inventory.