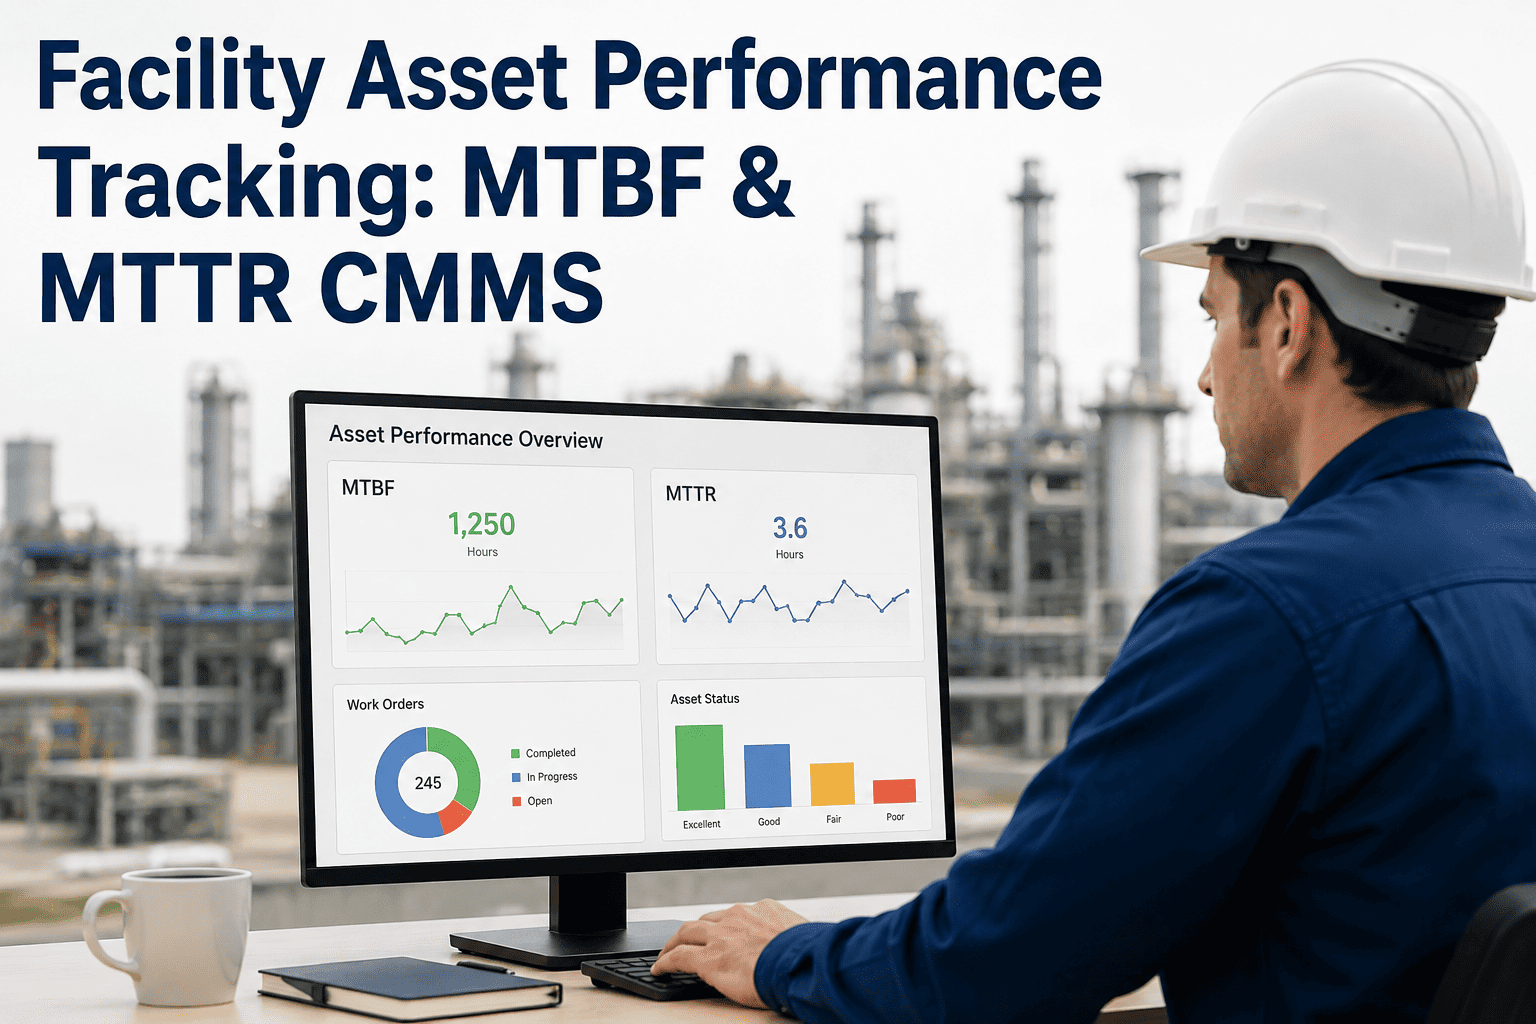
Ask five facility managers how reliable their equipment is and you'll usually get five different opinions, because "reliable" without a number is just a feeling. MTBF and MTTR turn that feeling into two figures that can be tracked, benchmarked, and improved — one measuring how long an asset runs before it fails, the other measuring how fast the team gets it back in service once it does. Together they separate a design or wear problem from a response problem, which matters because the fix for each is completely different, and confusing the two often leads a facility to invest time and budget in the wrong place entirely. This guide walks through the calculations as ISO 14224 defines them, gives realistic benchmark ranges by asset type, and covers the specific tactics that move each number — including where a CMMS like Oxmaint closes the gap between tracking these figures and actually acting on them.
Facilities · Reliability Metrics · MTBF & MTTR
Facility MTBF & MTTR: Calculate and Improve These Two Numbers
MTBF measures reliability — how long equipment runs between failures. MTTR measures maintainability — how fast it gets fixed. A facility with strong MTBF and weak MTTR has a different problem than one with the reverse, and mixing the two together hides which lever actually needs to be pulled.
The Two Calculations
How MTBF and MTTR Are Actually Calculated
MTBF
Mean Time Between Failures
Example: a chiller runs 8,760 hours in a year and fails 4 times → MTBF = 2,190 hours between failures.
MTTR
Mean Time To Repair
Example: those 4 chiller failures took 2, 3, 1, and 6 hours to fix — total 12 hours ÷ 4 repairs → MTTR = 3 hours.
ISO 14224 defines total operating time as uptime only, and repair time as the full duration from failure detection to the asset being returned to service — not just active wrench time. Facilities that measure only active repair time understate their true MTTR by ignoring diagnosis, parts sourcing, and permit delays. Getting this boundary right matters more than the arithmetic itself, since two facilities using different definitions of "repair time" can report the same underlying performance as very different-looking numbers.
What Good Looks Like
Benchmark Ranges By Asset Type
Benchmarks vary by equipment complexity and criticality, so a single facility-wide MTBF or MTTR target is rarely meaningful. These ranges give a starting point for comparison, not a universal standard, and should always be adjusted against an asset's own manufacturer specifications and duty cycle where those are available.
| Asset Type | Typical MTBF | Typical MTTR | Primary Driver |
|---|---|---|---|
| Chillers & Rooftop Units | 2,000–4,000 hrs | 2–6 hrs | Refrigerant circuit and controls faults |
| Pumps & Motors | 4,000–8,000 hrs | 1–4 hrs | Bearing wear, seal failure |
| Electrical Switchgear | 8,000–15,000 hrs | 3–10 hrs | Connection degradation, thermal stress |
| Elevators & Conveyance | 3,000–6,000 hrs | 2–8 hrs | Control system and door mechanism faults |
| BMS/Controls Hardware | 10,000+ hrs | 1–3 hrs | Sensor drift, communication faults |
Common Pitfalls
Mistakes That Quietly Distort The Numbers
Both calculations look simple on paper, but a handful of recurring errors make the resulting figures misleading — usually in a direction that makes the facility look better than it actually performs, which is exactly the failure mode a reliability program is supposed to prevent.
- Counting only "hard" failures. If a work order is only logged when the asset stops completely, degraded-but-running failures never enter the calculation, inflating MTBF above what technicians actually experience.
- Excluding standby time incorrectly. Redundant equipment that sits in standby shouldn't be counted the same as equipment running continuously — mixing the two skews the operating-time denominator.
- Measuring MTTR from dispatch, not detection. Starting the clock when a technician is dispatched rather than when the fault first occurred hides the diagnosis and triage delay that is often the largest part of total downtime.
- Averaging across dissimilar assets. Blending a new chiller's MTBF with a 20-year-old unit of the same type produces an average that describes neither asset accurately.
- Ignoring preventive maintenance downtime. Some programs only count unplanned failures in MTBF, which can make an aggressive preventive schedule look identical to a neglected one on paper.
- Small sample sizes. An MTBF calculated from only two or three failures in a year swings wildly month to month; treat any figure built on fewer than roughly ten events as directional rather than precise.
Diagnosing The Gap
What Low MTBF And High MTTR Are Actually Telling You
MTBF and MTTR are diagnostic, not just descriptive. Reading them together tells a facility team where to invest — in prevention, or in response capability — rather than treating "more maintenance" as a blanket answer.
A facility with strong MTBF but weak MTTR already has effective prevention; the money is better spent on parts stocking and technician access to information than on more frequent inspections. The reverse facility is fixing failures quickly but experiencing them too often, which points straight back at the preventive program rather than the response process.
Low MTBF — A Reliability Problem
- Preventive maintenance intervals are too long or missing entirely
- Assets are running beyond design load or past expected service life
- Root causes of repeat failures are never formally investigated
- Installation or commissioning defects were never corrected
High MTTR — A Maintainability Problem
- Spare parts are not stocked for known common failure modes
- Technicians lack access to equipment history or documentation on site
- No formal escalation path exists when a repair stalls
- Diagnosis time dominates because fault codes and history aren't accessible in the field
Track Both Numbers In One Place
A Spreadsheet Can't Tell You Which Lever To Pull
Calculating MTBF and MTTR once a quarter from a spreadsheet tells you where you stood — it doesn't tell you why. Sign up for Oxmaint to log failure and repair timestamps automatically from every work order and see both metrics update in real time, by asset and by failure mode.
Moving The Numbers
Tactics That Actually Improve Each Metric
Because the two metrics respond to different levers, a facility trying to improve both at once should treat them as two separate initiatives with two separate owners rather than folding them into one generic "improve maintenance" project that never gets specific enough to move either number. A reliability engineer typically owns the MTBF side while a maintenance supervisor owns MTTR, and progress on each should be reported independently.
To Raise MTBF
- 1Move high-failure assets from run-to-failure to a scheduled preventive interval based on manufacturer duty cycle data
- 2Conduct root cause analysis on every repeat failure rather than closing the work order once the symptom is fixed
- 3Add condition-based checks — vibration, temperature, current draw — ahead of the interval that catches degradation early
- 4Verify installation and commissioning quality on new equipment before failures are attributed to "normal wear"
To Lower MTTR
- 1Stock spare parts for the failure modes that already show up most often in the work order history
- 2Give technicians mobile access to asset history, manuals, and prior repair notes at the point of failure
- 3Standardize job plans for common repairs so diagnosis time doesn't reset to zero with every new technician
- 4Set an escalation trigger so a stalled repair automatically pulls in a supervisor or vendor rather than waiting silently
The Compounding Effect
Before and After: A Pump Fleet Example
The two metrics compound. A facility that improves both MTBF and MTTR doesn't just add the gains together — it multiplies uptime, because the asset both fails less often and comes back faster each time it does.
Before — Reactive Program
MTBF: 3,000 hrs · MTTR: 5 hrs
Annual failures per pump: ~2.9
Annual downtime per pump: ~14.6 hrs
After — Planned Program
MTBF: 6,000 hrs · MTTR: 2 hrs
Annual failures per pump: ~1.5
Annual downtime per pump: ~3 hrs
Doubling MTBF and cutting MTTR by more than half turns roughly 15 hours of annual downtime per pump into about 3 — a reduction driven by preventive intervals on the failure side and parts availability plus job standardization on the repair side.
Where The Data Comes From
Capturing Clean Timestamps Without Extra Paperwork
Every MTBF and MTTR calculation is only as accurate as the timestamps feeding it, and those timestamps have to come from somewhere technicians already interact with — otherwise the data collection itself becomes a burden nobody keeps up with consistently, and the metrics quietly drift away from what is actually happening on the floor.
Failure Detected
A work order is opened the moment a fault is reported or an alarm fires, timestamping the true start of downtime rather than the moment a technician arrives.
Diagnosis Logged
Time spent identifying the fault is captured as part of the same work order rather than a separate, easily-forgotten record.
Repair Completed
The technician closes the work order on-site from a mobile device, timestamping the exact moment the asset returned to service.
Metrics Update
MTBF and MTTR recalculate automatically for that asset and failure mode, without anyone running a manual export at month end.
Reading The Trend
Tracking MTBF And MTTR Correctly
-
Track By Failure Mode, Not Just Asset
A single blended MTBF for a chiller hides whether refrigerant issues or control faults are driving the number down — segment by failure mode to know which fix actually matters.
-
Use A Rolling Window, Not Lifetime
A trailing 12-month rolling average reflects current asset condition and recent maintenance changes far better than an all-time average that dilutes recent improvement or decline.
-
Pair With Availability
MTBF and MTTR combine into availability — MTBF ÷ (MTBF + MTTR) — which is the single number most useful for reporting uptime to an owner or tenant.
-
Separate Planned From Unplanned
Scheduled preventive downtime should be reported separately from unplanned failure downtime so an improving MTBF trend isn't masked by an increasingly proactive maintenance calendar.
Putting The Two Together
Availability: The Number Owners Actually Ask For
MTBF and MTTR are the inputs a maintenance team works with day to day, but when it comes time to report uptime to a building owner or tenant, availability is the figure that actually gets asked for — and it is calculated directly from the other two.
Using the pump fleet example above, the reactive program's availability works out to 3,000 ÷ (3,000 + 5) ≈ 99.83%, while the planned program reaches 6,000 ÷ (6,000 + 2) ≈ 99.97%. The gap looks small as a percentage, but across a full year of continuous operation it represents multiple additional hours of uptime per asset — hours that matter directly to tenants depending on that equipment.
Because availability compresses both numbers into one figure, it is useful for owner reporting but should never replace tracking MTBF and MTTR separately internally — a team that only watches availability can miss which of the two underlying metrics is actually driving a decline, and lose the early warning that comes from spotting the shift before it shows up in the blended number.
Frequently Asked
MTBF and MTTR Questions
What is a good MTBF for facility equipment?
It depends entirely on asset type — a chiller typically runs 2,000–4,000 hours between failures while electrical switchgear can exceed 10,000. Compare an asset's MTBF against its own trailing history rather than a generic industry number.
Does MTTR include the time waiting for parts?
Per ISO 14224, yes — MTTR covers the full duration from failure detection to the asset returning to service, which includes diagnosis, parts sourcing, and permit time, not only the hands-on repair itself.
Can MTBF and MTTR be tracked automatically?
Yes, when failure and repair timestamps are logged consistently through work orders. Sign up for Oxmaint to calculate both metrics automatically from work order data instead of a manual spreadsheet exercise.
Which metric should a facility improve first?
Start wherever the gap between current performance and benchmark is largest for the asset's criticality — a low MTBF on a critical asset usually deserves attention first, since prevention avoids the failure MTTR would otherwise have to respond to.
How often should MTBF and MTTR be reviewed?
Monthly at the asset level and quarterly at the portfolio level is a common cadence, giving enough failure events to be statistically meaningful without waiting so long that a real trend goes unnoticed. Book a demo to see a live reliability dashboard.
Two Numbers · One Reliability Picture
Stop Guessing Which Lever To Pull
MTBF tells you whether prevention is working. MTTR tells you whether your response is fast enough. Oxmaint calculates both automatically from every work order, timestamped from detection through closure, so your team knows exactly where to focus next instead of debating whose spreadsheet is right.