Equipment Reliability: MTBF, MTTR and Failure Analysis for Building Systems
By John Polus on March 25, 2026
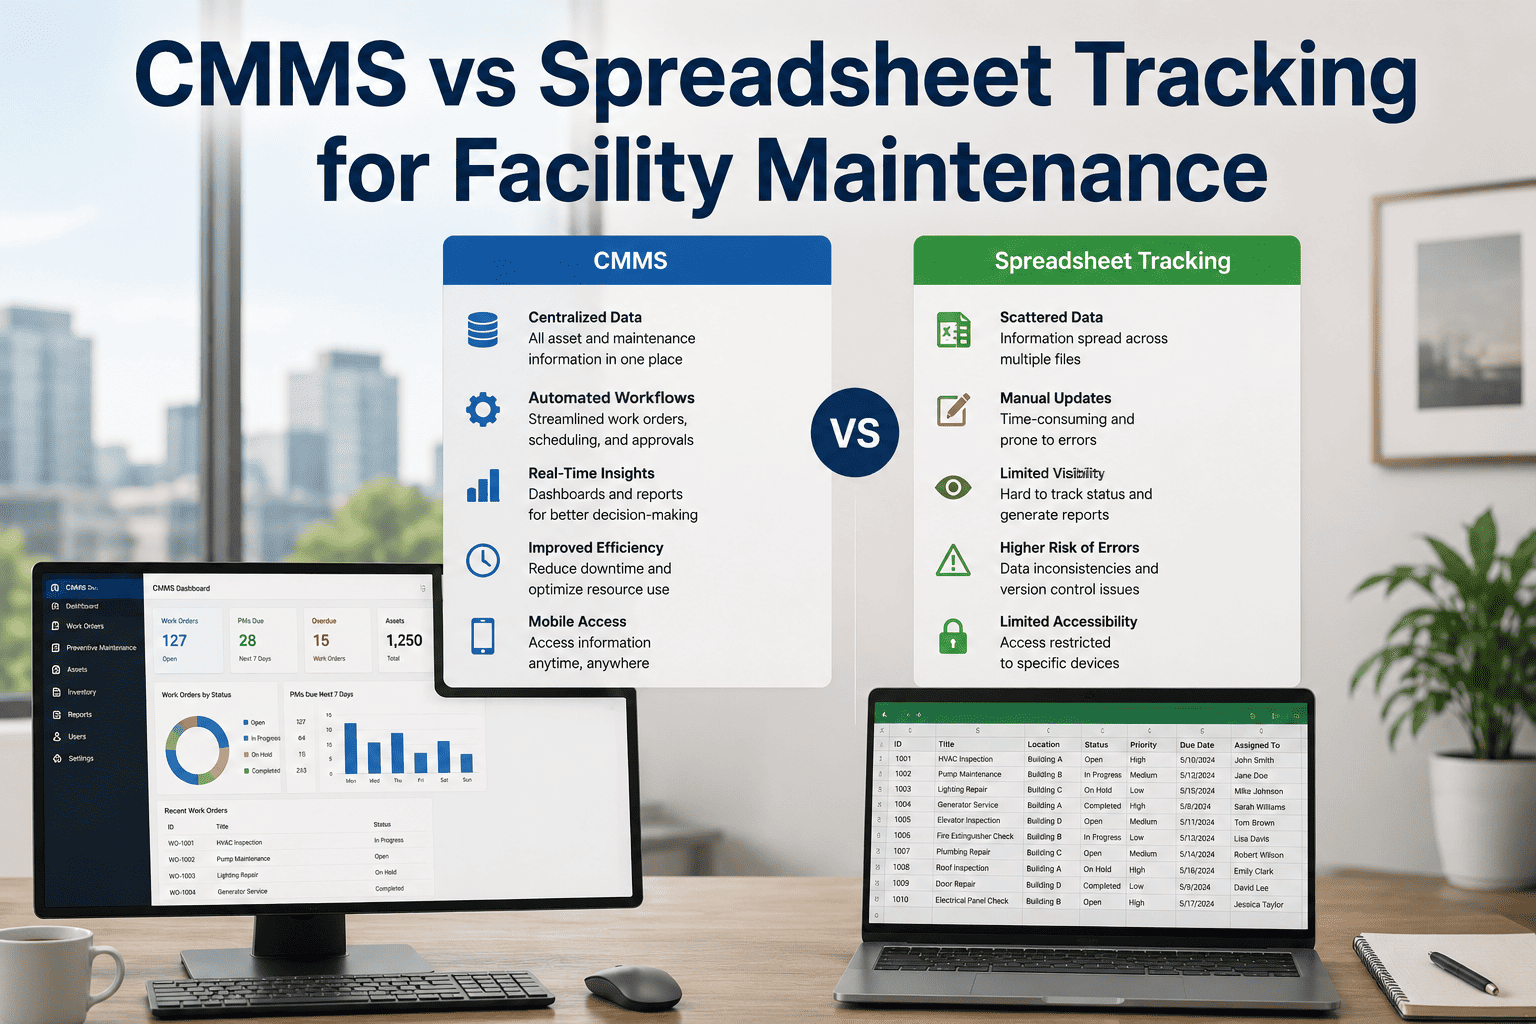
Facility managers who do not track MTBF and MTTR per asset are not managing equipment reliability. They are managing the consequence of failures they had no data to prevent. Mean Time Between Failures tells you how often an asset fails. Mean Time To Repair tells you how long the team takes to restore it. Together, these two metrics calculate equipment availability, the percentage of scheduled time an asset is operational and generating value. Without MTBF and MTTR data tracked per asset in a CMMS, a facility manager cannot identify which assets are deteriorating, which failures are recurring, or where maintenance labour is being absorbed by events that a PM schedule change could prevent. The result is a maintenance programme that reacts to failures rather than managing the conditions that cause them. Book a demo to see how Oxmaint tracks MTBF, MTTR, and equipment availability across your building systems.
ArticleEquipment Reliability: MTBF, MTTR and Failure Analysis for Building SystemsAsset and Inventory Management · Authority · P2 · 9 min read
4.8x
higher cost per repair event for reactive emergency maintenance versus planned intervention at equivalent asset criticality
68%
of facility equipment failures are preventable through structured PM when failure pattern data is tracked per asset in a CMMS
23%
average improvement in equipment availability within 12 months of MTBF-driven PM schedule optimisation in commercial facilities
40%
of maintenance labour hours in facilities without reliability tracking consumed by recurring failures on the same assets
The Three Core Reliability Metrics: Definitions and How to Calculate Them
MTBF, MTTR, and equipment availability are calculated from work order data. A CMMS that attributes every failure event and repair to specific assets generates these metrics automatically. Without per-asset work order attribution, calculation requires manual data extraction and is always retrospective.
MTBF: Mean Time Between Failures
How often does this asset fail?
Formula
Total uptime hoursDivided by failure count
Longer = Better
A rising MTBF indicates PM effectiveness. A declining MTBF indicates asset deterioration or PM gap requiring investigation.
MTTR: Mean Time To Repair
How long does it take to restore the asset?
Formula
Total repair hoursDivided by repair count
Shorter = Better
High MTTR signals parts availability issues, diagnostic delays, or technician skill gaps that structured work order data reveals.
Equipment Availability
What percentage of scheduled time is the asset operational?
Formula
MTBF divided byMTBF plus MTTR
Higher = Better
World-class facilities target 95 to 99% availability on critical building systems. Below 90% on a critical asset signals PM programme failure.
Failure Rate
How many failures per unit of operating time?
Formula
1 divided by MTBFFailures per 1000 hrs
Lower = Better
Declining failure rate confirms PM programme effectiveness. Rising failure rate on an asset class signals a systemic PM or design issue.
MTBF, MTTR, and Equipment Availability Calculated Automatically from Your Work Order Data
Failure Analysis by Building System: What the Data Shows
HVAC Systems
Primary failure mode
Filter blockage and coil fouling account for 62% of HVAC failures in commercial buildings. Both are detectable weeks before failure through PM inspection. MTBF on HVAC without structured filter PM averages 2,200 hours. With structured PM, 6,800 hours. The 3x MTBF difference represents the value of one PM task scheduled correctly.
Target availability: 97% or above on primary HVAC serving occupied zones
Plumbing and Pump Systems
Primary failure mode
Seal and bearing failures on circulation pumps are the leading cause of pump downtime in commercial facilities. Vibration trending on pump bearing housings provides 3 to 6 weeks of advance warning. Seal replacement scheduled from condition data costs 80% less than emergency replacement after seal failure and water damage.
Target availability: 99% on primary circulation and booster pumps
Electrical Distribution
Primary failure mode
Thermal imaging on MCC panels and switchgear detects connection degradation and overloading 4 to 8 weeks before failure. Electrical failures in commercial buildings carry the highest consequence per event due to downstream system impact. Thermographic survey schedules tracked in Oxmaint as PM tasks with pass/fail results per panel.
Target availability: 99.5% or above on primary electrical distribution
Lifts and Escalators
Primary failure mode
Drive motor wear, rope tension drift, and door mechanism faults account for 74% of lift failures in commercial buildings. All three are identifiable through structured monthly inspection under ASME A17.1 or EN 81. Lift downtime in a multi-floor building carries immediate occupant impact and statutory notification obligations in most jurisdictions.
Target availability: 98.5% on passenger lifts in occupied buildings
From Work Order Data to Reliability Dashboard: The Flow
Reliability metrics are a product of work order data quality. Every failure event must be attributed to a specific asset, with fault category, repair duration, and root cause captured. Without per-asset attribution, MTBF and MTTR cannot be calculated at asset level. With it, they calculate automatically.
1
Failure Event Recorded
Work order created with asset attribution, failure category, and time of failure reported. Oxmaint mobile app allows creation from QR scan at the asset location.
→
2
Repair Duration Captured
Technician logs start and finish time on the work order. Labour hours, parts consumed, and root cause recorded at closure. All data attributed to the specific asset record.
→
3
MTBF and MTTR Calculated
Oxmaint calculates MTBF and MTTR per asset from accumulated work order data. Metrics update automatically on each work order closure. No manual calculation required.
→
4
PM Schedule Optimised
Declining MTBF on a specific asset class triggers a PM review. Oxmaint identifies which PM tasks correlate with failure prevention and which intervals require adjustment.
Reliability Management: Without vs With Oxmaint CMMS
Reliability Function
With Oxmaint Analytics
Without CMMS Reliability Tracking
MTBF per asset
Calculated automatically from work order data per asset. Dashboard shows MTBF trend per asset class with period comparison. Declining MTBF flagged for investigation.
Calculated manually from spreadsheet exports if at all. Always retrospective. No per-asset MTBF available at asset level. Trend data absent.
MTTR analysis
MTTR per asset and per technician visible on the dashboard. High-MTTR assets flagged for parts pre-staging or skills review. Repair time trends visible over any selected period.
Repair duration tracked on paper job cards or informal timekeeping. No aggregation per asset. High-MTTR assets invisible until post-event review.
Root cause capture
Root cause category captured on every work order closure from a standardised list. Failure patterns visible by cause category per asset class. Recurring causes trigger PM review alerts.
Root cause captured informally or not at all. Recurring failure causes not identifiable as patterns. Same failures repeat without systemic investigation.
PM optimisation from data
Oxmaint identifies assets where failure rate has declined since PM schedule change, confirming optimisation. Assets with rising failure rate despite PM compliance flagged for condition assessment.
PM schedules based on OEM recommendation and institutional knowledge. No data to confirm which PM tasks prevent failures on which assets. Schedule adjustments made on anecdote.
Reliability Performance Benchmarks: Building Systems
Of facility equipment failures preventable through structured PM when failure pattern data is tracked per asset68%
Average improvement in equipment availability within 12 months of MTBF-driven PM schedule optimisation23%
Reduction in time from failure event to work order creation when technicians use mobile CMMS vs paper reporting74%
Of recurring failure events on the same assets are preventable once root cause data is captured and acted upon82%
Implementing Reliability Tracking: Four Steps to MTBF Visibility
1
Register Every Asset with a Unique Record
MTBF is calculated per asset, not per asset class. Each HVAC unit, pump, lift, and electrical panel needs its own asset record in Oxmaint. Without per-asset registration, failure events cannot be attributed at the level required to produce meaningful MTBF data. Book a demo to see asset registration configuration for your building.
2
Attribute Every Failure Work Order to the Specific Asset
Every corrective work order must link to a specific asset record, not a building area or system category. Oxmaint's QR code scanning ensures technicians attribute work orders to the exact asset from the field. Fault category and root cause captured at closure build the failure history from which MTBF is calculated.
3
Review MTBF and MTTR on the Oxmaint Dashboard Monthly
Monthly dashboard review identifies assets with declining MTBF (increasing failure frequency) and assets with high MTTR (slow repair). Each signals a specific intervention: PM schedule review for declining MTBF, parts pre-staging or skills review for high MTTR. Book a demo to see the reliability dashboard configured for your asset classes.
4
Adjust PM Schedules Based on Failure Rate Data
Assets with declining MTBF despite PM compliance require interval compression or additional inspection tasks. Assets with stable MTBF above benchmark may tolerate interval extension, reducing PM labour cost without reliability impact. Oxmaint stores the schedule change date so MTBF trend after adjustment confirms or refutes the decision.
QHow does Oxmaint calculate MTBF and MTTR automatically from work order data?
Oxmaint tracks failure event time, repair start time, and repair completion time on every corrective work order attributed to a specific asset. MTBF is calculated as total uptime divided by failure count per asset. MTTR is calculated as total repair duration divided by repair count. Both metrics update automatically on each work order closure with no manual input. Book a demo to see the reliability dashboard for your asset classes.
QWhat is the minimum data collection period before MTBF calculations become reliable?
A minimum of 5 to 10 failure events per asset produces a statistically reliable MTBF estimate. For assets with long natural MTBF, 12 to 18 months of work order data builds the history required for confident interval estimation. Oxmaint displays confidence level alongside MTBF values to indicate data maturity per asset. Start free trial to begin building reliability data from day one.
QHow does Oxmaint use MTBF data to optimise PM schedule intervals?
Oxmaint compares PM completion dates against failure event dates to identify assets that fail before their next scheduled PM. Where failure consistently precedes the PM due date, the interval is too long. Oxmaint flags the pattern and suggests interval compression. Schedule changes are logged with effective dates so MTBF trend after adjustment confirms the optimisation. Book a demo to see PM optimisation from reliability data.
QCan Oxmaint perform root cause analysis on recurring failures across multiple assets of the same type?
Yes. Oxmaint groups failure events by asset class, fault category, and root cause across all locations. Recurring root causes on the same asset class across multiple buildings are visible as a pattern on the failure analysis dashboard. This identifies systemic PM gaps or design issues that require a programme-level response rather than a per-asset repair. Sign up free or book a demo to see root cause analysis for your asset portfolio.
MTBF, MTTR, and Equipment Availability Tracked Automatically. PM Schedules Optimised from Data.
Oxmaint connects work order management, per-asset failure attribution, root cause capture, and reliability analytics into one platform. MTBF and MTTR dashboards update in real time. Go live in under 14 days with no implementation project required.