Most facility predictive maintenance programs do not fail because of bad sensors. They fail because alert thresholds were copied from a datasheet, set once, and never tuned. Too tight, and technicians learn to ignore the alarms. Too loose, and the first alert arrives after the bearing is already damaged. Setting limits from real baselines, recognised standards, and statistical control is what separates a useful program from noise, and a maintenance management platform gives those limits a place to live and act.
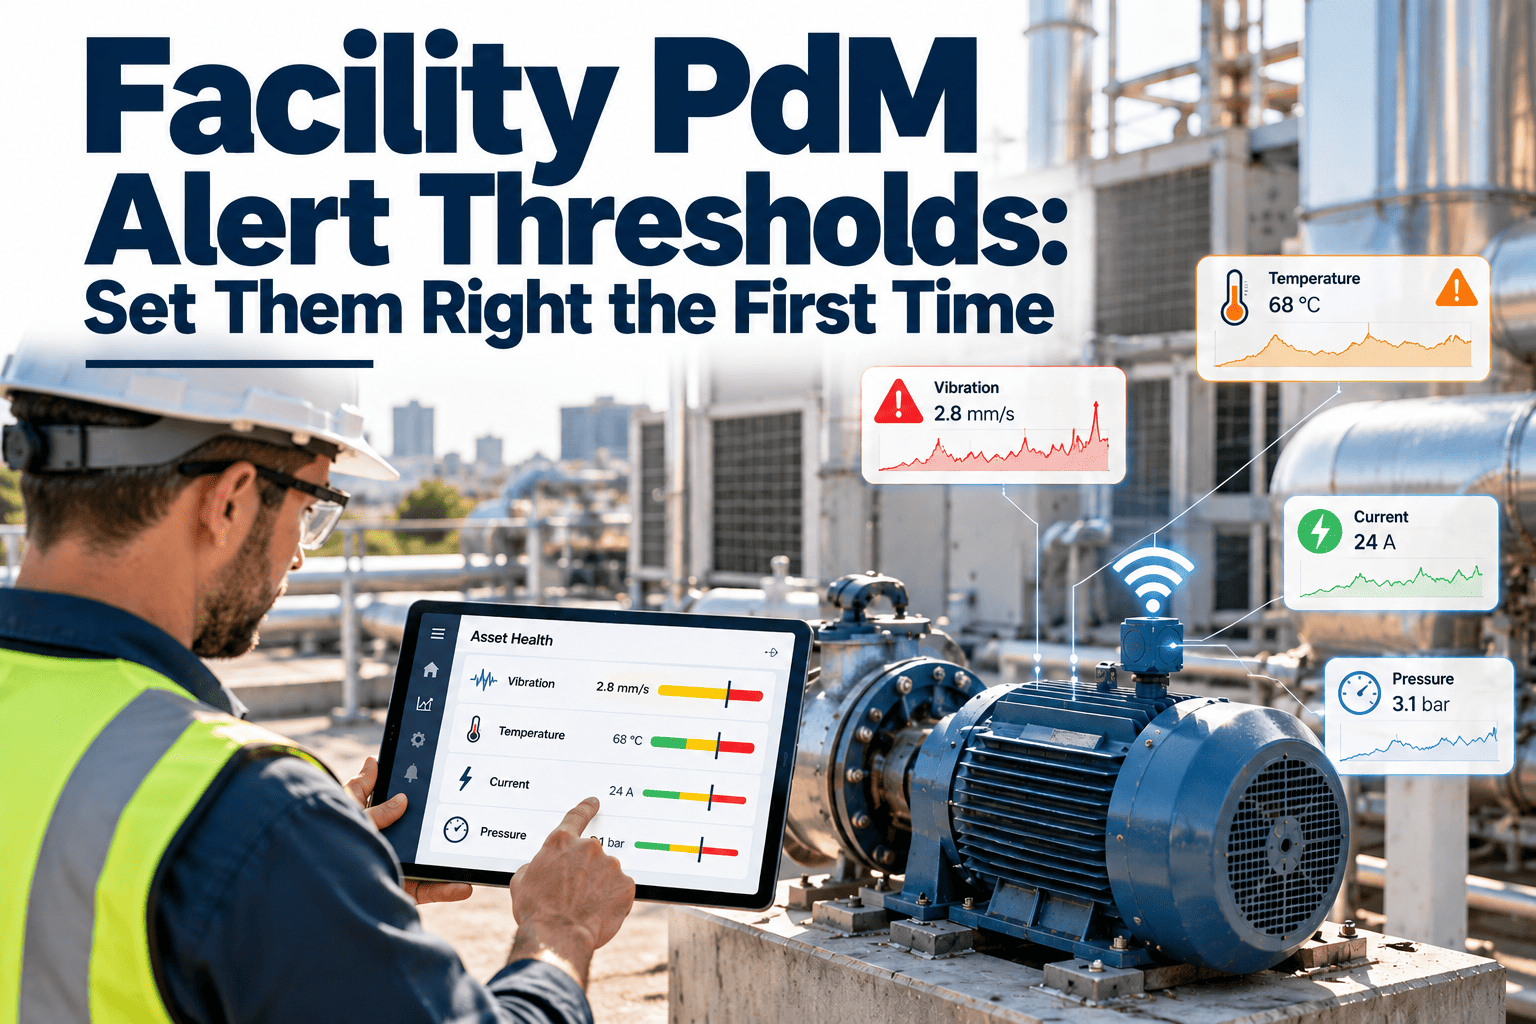
Facility PdM Alert Thresholds: Set Them Right the First Time
Build alert and alarm limits for fans, pumps, chillers, and motors using ISO guidance, a clean baseline, and statistical process control, so alerts mean something.
Why thresholds decide whether PdM pays off
Three ways a threshold can be wrong
Set too tight
Healthy equipment triggers alerts during normal load changes. Technicians chase false positives, trust drops, and real alarms get dismissed.
Set too loose
Faults develop quietly. By the time a limit is crossed, the remaining lead time is too short to plan parts, labour, and a shutdown window.
Set from evidence
Limits come from the asset's own baseline, adjusted for load and season, and checked against recognised standards. Alerts arrive with usable lead time.
What this means in a building
- Facility equipment runs under variable load. An air handler at 30 percent fan speed does not vibrate like the same unit at full speed.
- Seasonal swings change chiller, cooling tower, and boiler behaviour, so one fixed number rarely fits all year.
- Maintenance teams are small. Every false alert consumes time that planned work needed.
- Tenants and occupants notice failures. A missed warning on a chilled water pump becomes a comfort complaint.
The standards behind sound threshold setting
Where ISO 13381 and ISO 17359 fit
| Standard | What it contributes | How facility teams use it |
|---|---|---|
| ISO 17359 | General guidelines for condition monitoring and diagnostics of machines, including how to select parameters and methods | Decide which assets deserve monitoring and which measurements detect their likely failure modes |
| ISO 13381-1 | General guidance on prognostics, including estimating remaining useful life | Link a trend to a planned intervention date instead of reacting to a single reading |
| ISO 20816 series | Measurement and evaluation of machine vibration, which supersedes the earlier ISO 10816 parts | Use evaluation zones as a sanity check on vibration limits |
| ISO 13373 series | Condition monitoring and diagnostics through vibration measurement | Standardise sensor placement, units, and measurement procedures |
A note on generic limits
Standards give a defensible starting frame, not a final answer. The measurement points, machine class, mounting, and speed all affect which zone limits apply, so confirm them against the current edition before adopting a number.
ISO vibration zones as a starting reference
Four evaluation zones
How to use the zones
- Treat the zone A/B boundary as a reference for what good looks like on a new or rebuilt machine.
- Treat the B/C boundary as a ceiling for your alert limit, not as the target.
- Treat the C/D boundary as the outer limit for an alarm, and set yours lower where lead time matters.
- Document which machine group and support type you assumed, so the next engineer can reproduce the choice.
A six-step method for setting thresholds
Rank assets by criticality
Start with assets whose failure affects occupants, safety, or revenue: chillers, primary pumps, large air handlers, and critical electrical gear.
Pick the right parameters
Match measurements to failure modes. Vibration suits rotating machines, temperature suits electrical connections, and motor current suits load problems.
Capture a clean baseline
Collect readings while the machine is known to be healthy, after any recent repair, and across the normal range of speed and load.
Segment by operating state
Separate readings by speed band, mode, and season so a legitimate load change is not read as a developing fault.
Calculate statistical limits
Use the baseline mean and spread to set watch, alert, and alarm levels, then cross-check them against standard zones.
Tie each level to an action
Every level needs an owner, a response time, and a defined work order type. A limit without an action is only decoration.
Statistical process control for condition monitoring
Why SPC suits facility assets
SPC asks a simple question: is this reading unusual for this machine? That makes it far more adaptive than one fixed number applied to every pump in the building.
A practical limit structure
| Level | Typical statistical rule | Response |
|---|---|---|
| Watch | Baseline mean plus two standard deviations, sustained over several readings | Shorten the reading interval and review the trend |
| Alert | Baseline mean plus three standard deviations, or a consistent upward drift | Raise a planned corrective work order |
| Alarm | A rapid step change, or a value approaching the standard C/D boundary | Inspect immediately and decide on shutdown |
Guardrails that prevent false alarms
- Require two or three consecutive exceedances before escalating, unless the change is abrupt.
- Calculate separate limits for each speed band on variable frequency drive equipment.
- Exclude start-up, shutdown, and known maintenance activity from the baseline data.
- Review rate of change as well as absolute level, because slope often reveals a fault earlier.
Turn your baselines into alerts that technicians trust
Keep readings, limits, and the work they trigger in one place, so every alert has an owner and a next step.
Starting points by equipment type
| Asset | Primary parameters | Threshold watch-outs |
|---|---|---|
| Air handler fans | Vibration velocity, bearing temperature | Segment by fan speed; belt wear shifts the pattern |
| Chilled water pumps | Vibration, motor current, seal condition | Cavitation and low flow can mimic bearing faults |
| Cooling tower fans | Vibration, gearbox oil condition | Seasonal load and wind change the baseline |
| Chillers | Motor current, approach temperatures, oil data | Judge against load and condenser water temperature |
| Electrical panels | Infrared temperature rise | Compare against load and similar phases, not only a fixed value |
Before and after tuning
Untuned thresholds
- One vendor default applied to every similar asset
- Alerts fire during every load change
- Technicians acknowledge and ignore
- No record of why a limit exists
- Faults found by inspection or breakdown
Tuned thresholds
- Limits built from each asset's own baseline
- Separate limits by speed band and season
- Every level linked to a work order type
- Rationale and standard reference recorded
- Faults found with planned lead time
Tuning thresholds with real feedback
Close the loop on every alert
Threshold setting is not finished at commissioning. Each alert should be closed with a finding, so the limit can be judged against what the technician actually discovered.
Outcome categories to record
Confirmed fault
The limit worked. Note the lead time between alert and failure.
Operating change
The reading was real but explained by load or mode. Adjust segmentation.
Sensor or data issue
Check mounting, cabling, and calibration before touching the limit.
No fault found
Review the limit. Repeated cases suggest it is too tight.
Trends shaping facility condition monitoring
Wireless sensors lower the cost of coverage
Battery-powered vibration and temperature sensors make it practical to monitor assets that never justified wired systems. More data raises the value of sound limits, because noisy thresholds multiply across hundreds of points.
Trend-based logic beats single readings
- Slope and rate of change often reveal degradation earlier than absolute level.
- Comparing similar machines, such as parallel pumps, exposes outliers without any fixed number.
- Combining parameters, for example vibration with motor current, reduces false positives from a single noisy signal.
- Prognostic thinking from ISO 13381 encourages estimating time to intervention, not only flagging an exceedance.
Human judgment still matters
Automated alerts narrow attention, but an experienced technician confirms the fault, decides urgency, and records what was found. That judgment is what improves the next limit.
KPIs that show whether thresholds are working
A worked example with illustrative numbers
Setting limits for a chilled water pump
The figures below are an illustration of the method only. Your own baseline, machine class, and standard edition determine the real values.
| Step | Action | Illustrative result |
|---|---|---|
| Baseline | Collect weekly drive-end velocity readings at normal operating speed after a bearing replacement | Mean 1.8 mm/s, standard deviation 0.2 mm/s |
| Watch | Mean plus two standard deviations | 2.2 mm/s |
| Alert | Mean plus three standard deviations | 2.4 mm/s |
| Standard check | Compare against the applicable zone boundary for the machine group | Alert sits below the B/C boundary, so it leaves planning time |
| Alarm | Step change or approach to the C/D boundary | Set below the standard limit and reviewed after the first season |
What to notice
- The alert is derived from the pump's own behaviour, so a quiet machine gets a tighter limit than a naturally noisy one.
- The standard acts as a ceiling check rather than the source of the number.
- The alarm is deliberately conservative until real failure history accumulates.
Root causes of alert fatigue
Fixed limits on variable loads
Variable speed drives change vibration and current constantly, so a single limit cannot be right across the range.
Poor sensor consistency
Handheld readings taken at slightly different points or angles create scatter that looks like a fault.
No ownership
When nobody owns an alert, it ages in a queue and the next one is ignored too.
No feedback loop
Without recorded findings, limits never improve and the same false alerts repeat every month.
Data quality comes before limit quality
Mark measurement points on the asset, record the same units every time, and log the operating condition with every reading. Clean data makes statistics meaningful.
Governance: who owns the thresholds
Roles that keep limits healthy
Change control for limits
- Record who changed a limit, when, and why, so audits and handovers stay simple.
- Re-baseline after any rebuild, motor swap, drive reprogramming, or relocation.
- Review seasonal assets before each cooling and heating season.
- Retire limits on decommissioned assets so they stop polluting reports.
Keeping this history against the asset record means a new engineer can understand a limit in minutes rather than rediscovering it.
Common threshold mistakes in facilities
- Setting limits before a trustworthy baseline exists, then treating the first week of data as normal.
- Mixing readings from different speeds, modes, and seasons into one average.
- Ignoring sensor placement consistency, which can shift values more than a real fault would.
- Using the standard alarm boundary as the alert, leaving no planning time.
- Failing to review limits after a repair, rebuild, or control change.
- Letting alerts accumulate without assigning an owner.
Pre-launch checklist
How Oxmaint supports threshold-driven maintenance
From reading to repair
Relevant capabilities
- Asset management keeps baselines, repair history, and criticality together so limits are reviewed with context.
- Inspection and condition checklists capture readings in the field on mobile devices.
- Work orders and scheduling turn an exceedance into assigned, tracked work.
- Preventive maintenance routines can sit alongside condition-based triggers for the same asset.
- Inventory visibility helps confirm that spares for a developing fault are on hand.
- Reporting and dashboards show alert volume, response time, and repeat failures.
Teams can sign up to structure this workflow, or book a walkthrough to map it to their own assets.
Frequently asked questions
How long should the baseline period be?
Long enough to cover normal speed, load, and seasonal ranges for that asset. Seasonal equipment may need a full cycle before limits are final.
Can I use the ISO zone limits directly?
Use them as a reference, not a substitute for a baseline. Confirm machine group and support type, then discuss your setup if unsure.
How often should thresholds be reviewed?
Review after repairs, control changes, and at least once per season in the first year. Then move to an annual review.
What reduces false positives fastest?
Segment limits by operating state and require consecutive exceedances. Recording no-fault-found outcomes shows where limits need loosening.
Where should alert actions be tracked?
In the same system as work orders, so each alert has an owner and outcome. You can get started at no cost to trial this.
Set alert limits once, then keep improving them
Give your condition monitoring program the structure to turn baselines into planned work and fewer surprises.