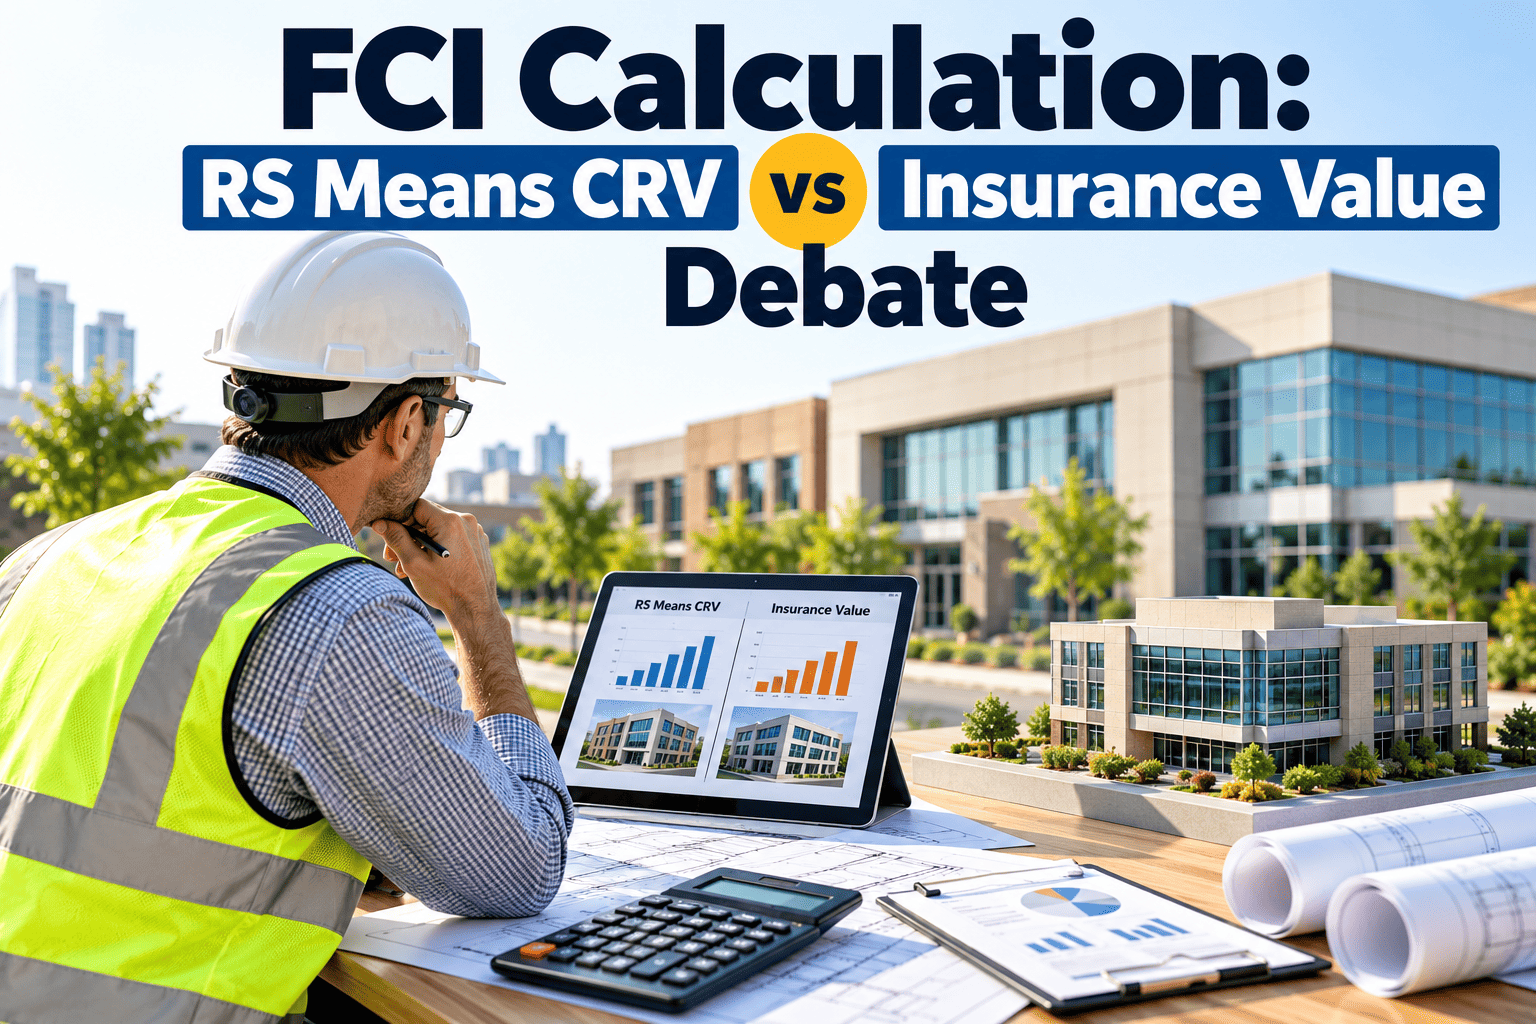
The Facility Condition Index looks like a simple ratio, yet two teams measuring the same building can report very different scores. The reason is rarely the repair estimate. It is the denominator: the current replacement value, or CRV. Choosing between a cost-database figure such as RS Means and an insurance value changes the result, sometimes by a wide margin. Whichever you choose, the underlying deferred maintenance and asset data must be reliable, which is where maintenance management software supports the numerator.
FCI calculation: RS Means CRV versus insurance value
Same building, same repair list, two different denominators. See why the CRV source matters and how to choose one you can defend.
How FCI is calculated
FCI compares what it would cost to fix known deficiencies with what it would cost to replace the facility.
The numerator: deferred maintenance
- Repairs and renewals that are overdue or required to restore acceptable condition.
- Usually drawn from condition assessments, inspections, and the maintenance backlog.
- Should state clearly whether it includes deficiencies only or also upcoming renewals.
The denominator: CRV
CRV is the estimated cost to replace the facility with an equivalent modern one today. There is no single universal way to produce it, and that is where the debate begins.
Two common CRV sources compared
Neither source is wrong. They answer slightly different questions, so they produce different denominators.
- Built from construction cost data by building type, size, and location
- Models the cost of a full replacement building
- Applies consistently across a portfolio
- Reproducible, so an auditor can follow the method
- May not reflect special finishes or unusual construction
- Set for underwriting and coverage purposes
- May be replacement cost or a depreciated actual cash value
- Often excludes items such as foundations, site work, or code upgrades
- Reflects what the insurer will pay, not full project cost
- May be updated infrequently or follow policy limits
Details vary by policy and appraisal method. Confirm what your own insurance value includes before using it in an FCI.
How the same repairs produce two scores
The figures below are illustrative, chosen to show the effect rather than to represent any real building.
| Item | Using cost database CRV | Using insurance value |
|---|---|---|
| Deferred maintenance | $4,200,000 | $4,200,000 |
| CRV | $60,000,000 | $42,000,000 |
| FCI | 7.0% | 10.0% |
| Typical rating band | Fair | Poor boundary |
What the example shows
- The relative difference in score is large even though the building did not change.
- A band change can alter funding priority, ranking, and board discussions.
- Reports that omit the CRV source are hard to compare and easy to challenge.
Get the numerator right before debating the denominator
Keep assets, inspections, and backlog in one system so your deferred maintenance figure is current and traceable.
Rating bands and what they usually trigger
Many organizations use bands similar to these. Confirm the thresholds your own standard or funder expects.
Why bands make the CRV choice matter
A building sitting near a boundary can move into a different band solely because of the denominator. That is a methodology result, not a change in condition.
Choosing a CRV source you can defend
Work through three questions in order. The answers usually point to one source.
Is the FCI used to compare buildings or to rank capital need?
If yes, favor a consistent, reproducible cost database method across the portfolio.Does a funder, lender, or standard specify a method?
If yes, use it, even if another method seems more precise.Is the insurance value a full, current replacement cost?
Only if it is documented, regularly reappraised, and scope matches the repair list should it be used as CRV.Consistency rules that matter more than the choice
- Use one CRV method across the whole portfolio.
- State the CRV source and date on every FCI report.
- Do not mix sources between years without restating history.
- Review CRV annually for cost escalation.
What makes the numerator trustworthy
A precise denominator cannot rescue a weak repair list. Four practices keep the numerator credible.
How Oxmaint supports FCI reporting
Oxmaint does not decide your CRV method, but it keeps the records an FCI depends on organized and current.
- Asset register: hold building and system records with age, location, and condition notes.
- Inspections: capture deficiencies on mobile and link them to assets.
- Backlog tracking: keep deferred items with priority, status, and age for the numerator.
- Work orders: close the loop so completed repairs reduce the backlog with evidence.
- Reports: export asset and backlog data to combine with your chosen CRV.
What belongs in deferred maintenance
Two FCIs built with the same CRV can still differ if they define the numerator differently. Write the scope down before calculating.
| Usually included | Usually excluded or tracked separately |
|---|---|
| Overdue repairs to restore acceptable condition | Routine preventive maintenance within schedule |
| Components past their useful life and still in service | New construction or planned expansion |
| Code and safety deficiencies requiring correction | Optional upgrades and aesthetic improvements |
| Backlog items confirmed by inspection | Items already funded and in progress, depending on policy |
| Failed building systems awaiting replacement | Operating costs such as utilities and cleaning |
Decide how to treat future renewals
Some organizations count only current deficiencies. Others add renewals expected within a planning window. Both can be valid, but they produce different scores, so state which one you use.
Why insurance value can move the score either way
Insurance figures are built for a different purpose, so several factors can pull them away from a full replacement cost.
- Excluded elements. Foundations, excavation, and site utilities are often outside coverage, which lowers the figure and raises FCI.
- Depreciation. Actual cash value policies subtract age-related depreciation, which can shrink the denominator further.
- Code upgrade coverage. If policy terms include the extra cost of meeting current codes, the figure may rise.
- Contents and equipment. Some values include movable contents that a building CRV should not.
- Appraisal date. An old valuation may not reflect today's construction costs.
Ask your broker or risk manager how the figure was derived before using it as a CRV.
Adjusting a cost database CRV responsibly
Cost database figures are a model, not a quote. A few adjustments keep the model close to reality.
Document special cases
Historic buildings, specialized plant, and unusual structures may not fit a standard model. Record any manual adjustment and the reasoning behind it.
Rolling FCI up across several buildings
A portfolio score should weight each building by its size of value. A simple average of percentages can mislead.
| Building (illustrative) | Deferred maintenance | CRV | FCI |
|---|---|---|---|
| Building A | $300,000 | $10,000,000 | 3.0% |
| Building B | $1,500,000 | $20,000,000 | 7.5% |
| Building C | $4,500,000 | $30,000,000 | 15.0% |
| Simple average of FCIs | 8.5% | ||
| Weighted portfolio FCI | $6,300,000 | $60,000,000 | 10.5% |
What the example shows
- The weighted result is higher because the building in the worst condition is also the largest.
- Reporting a simple average would understate the portfolio need.
- Always sum the numerators and denominators first, then divide.
Methodology mistakes that weaken an FCI
| Mistake | Effect | Prevention |
|---|---|---|
| Mixing CRV sources across buildings | Scores are not comparable | Choose one method for the whole portfolio |
| Outdated condition data | Numerator is wrong in either direction | Refresh assessments on a regular cycle |
| Repair cost and CRV on different price dates | Ratio distorted by inflation | Bring both to the same cost year |
| Counting planned preventive work as deferred | FCI overstated | Define deferred maintenance in writing |
| Not recording the CRV source | Results cannot be audited | State source and date on every report |
| Treating FCI as a precise number | False confidence | Report a range and note assumptions |
Presenting FCI with a sensitivity range
Since the CRV source changes the result, showing both gives decision makers a more honest picture than a single figure.
- Report the primary FCI using your chosen method, with the source and date.
- Show the alternative result as a comparison, clearly labeled.
- Highlight buildings that change band under the alternative, since those need extra attention.
- Pair the score with the dollar value of deferred maintenance, which does not depend on the denominator.
Do not let the ratio hide the dollars
A low FCI on a very large building can still represent a large repair bill. Funding decisions should look at both the ratio and the absolute amount.
What a band change means for decisions
FCI bands often feed funding rules, so a shift from one band to another is more than a label change.
- A building rated fair under one method and poor under another may or may not qualify for a repair program.
- Rankings across a portfolio can reorder, which affects which buildings receive capital first.
- Lenders, boards, and regulators may expect a specific method, so check before presenting results.
Test borderline buildings both ways
For any building within a few points of a band boundary, calculate the FCI with each CRV and note the difference. If the decision would not change, the debate is academic. If it would, document why you chose your method.
Who should own the CRV and the FCI
FCI problems often come from unclear ownership. Assign each input to a role.
| Input | Suggested owner | Review cycle |
|---|---|---|
| CRV method and parameters | Facilities leadership with finance | Annual |
| Gross floor area and building data | Asset or property records team | On change and annually |
| Condition assessments | Engineering or assessment contractor | Every few years, or by risk |
| Backlog and deferred items | Maintenance management | Continuous, reviewed monthly |
| Published FCI report | Facility manager, approved by leadership | Annual or quarterly |
Data you need on every building record
An FCI is only as reliable as the records beneath it. Capture these fields consistently.
- Building identity: name, address, use type, and year built.
- Area and size: verified gross floor area and number of floors.
- Systems and components: major systems with installation year and expected life.
- Condition ratings: a consistent score per system from the latest assessment.
- Deficiency register: each item with description, cost estimate, priority, and date identified.
- Completion evidence: work order and verification for every closed deficiency.
Moving FCI in the right direction
Once the method is settled, the score changes only when conditions change. Four levers matter most.
- Fix the highest-risk deficiencies first. Prioritize safety, compliance, and items that could damage other assets.
- Prevent new deferral. Keep preventive maintenance on schedule so the numerator stops growing.
- Retire failing assets. Replacing a poor building or system outright can be cheaper than repairing it repeatedly.
- Track progress yearly. Report the dollar value of deferred maintenance removed, not only the ratio.
Beware of gaming the ratio
Raising CRV through a more generous method lowers FCI without fixing anything. Keep the method fixed from year to year so improvement reflects real work.
FCI and CRV, answered
Is RS Means better than insurance value?
Not universally. RS Means is more reproducible, while insurance value must match your repair scope.
Can we use both?
Yes, but report one as primary and label the other clearly as a comparison.
How often should CRV be updated?
Annually is common, since construction costs shift. Record the update date with each report.
Where does the repair data come from?
From inspections and backlog records, which you can manage in Oxmaint.
Can we review our data with someone?
Yes. Book a demo to walk through asset and backlog setup.
Build an FCI your board can trust
Organize assets, inspections, and backlog so every FCI you report is traceable to current records.