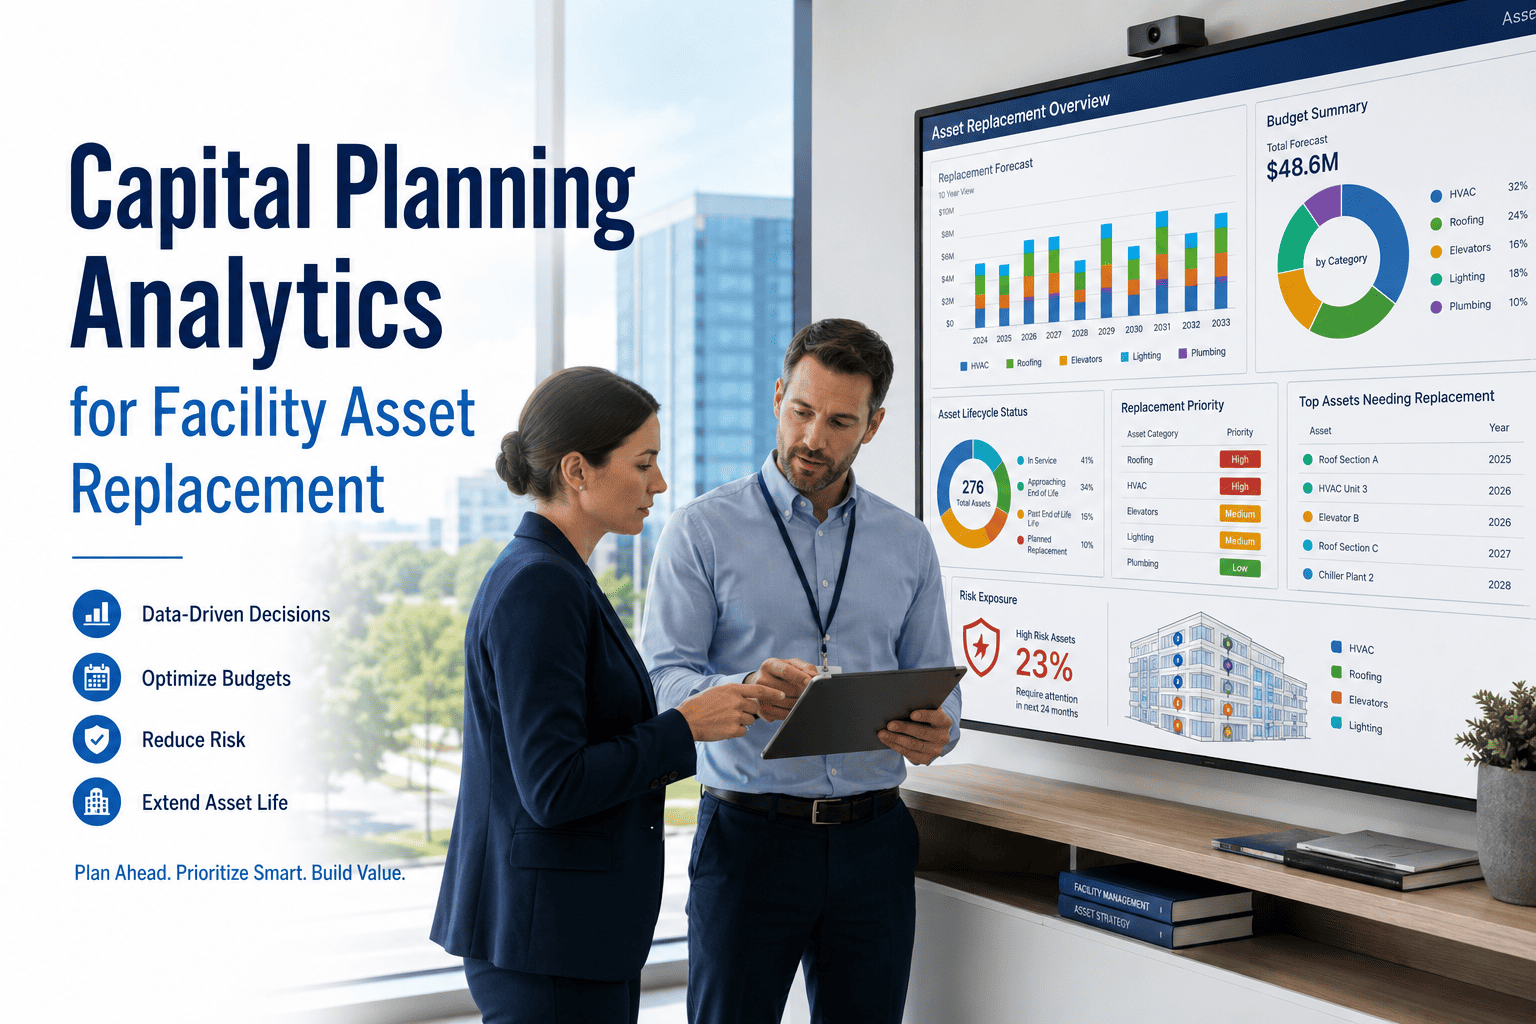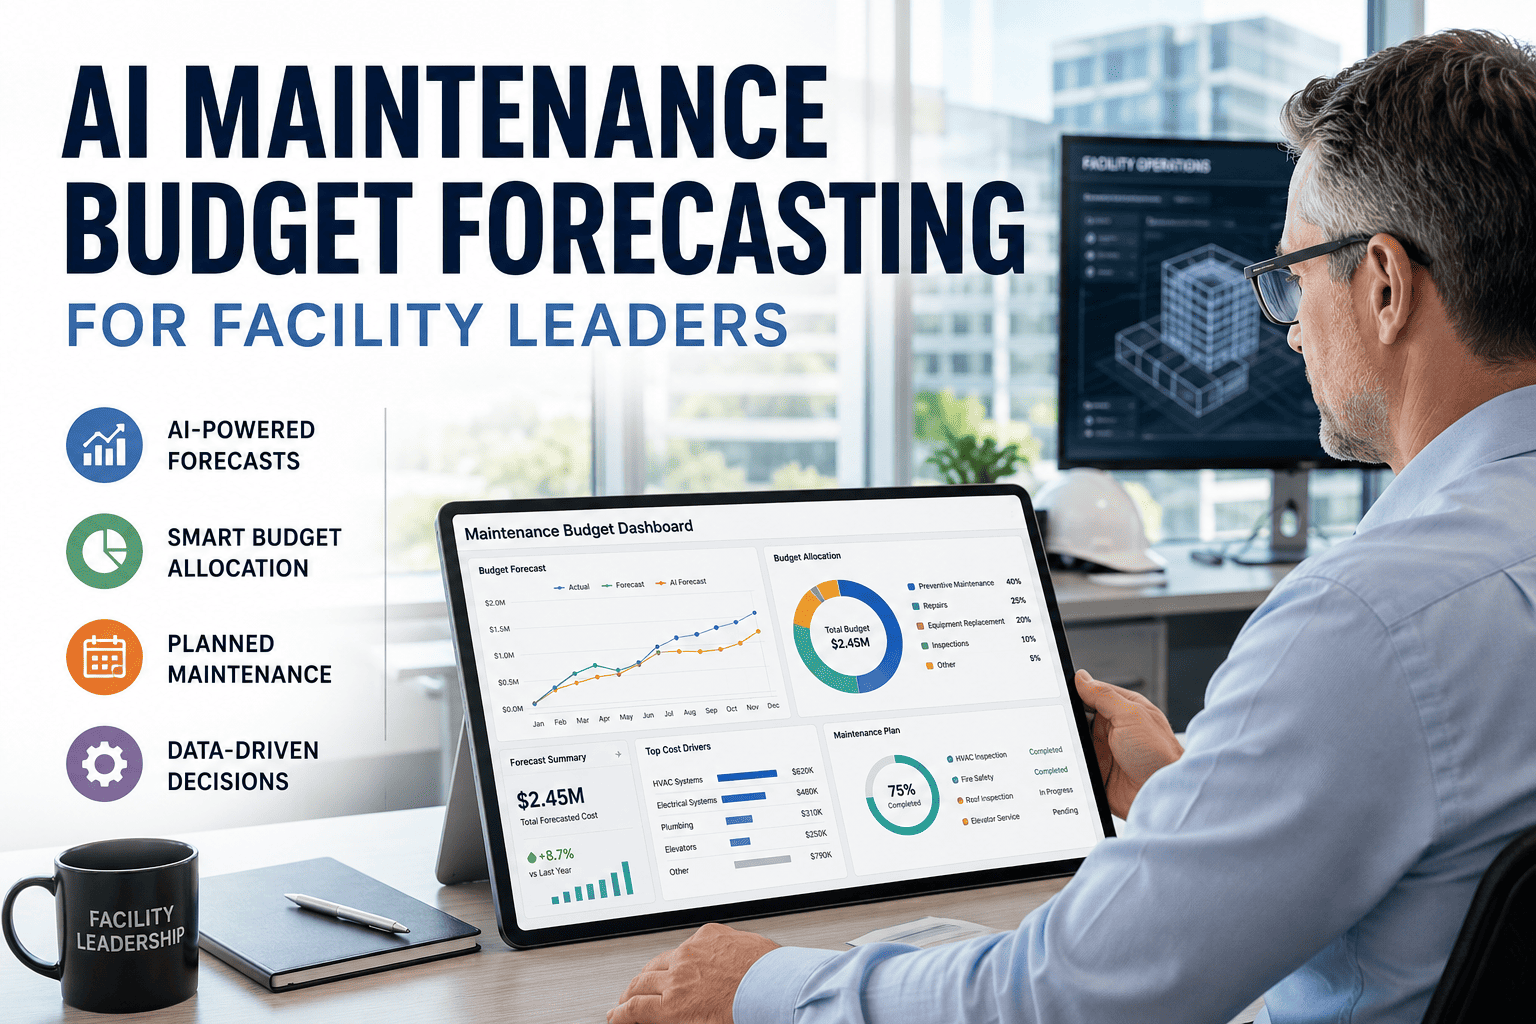
FM predictive analytics for CapEx forecasting replaces gut-feel capital plans with defensible, condition-based financial models drawn from real asset data. Facilities teams managing 500+ assets routinely see 15–25% of annual capital budgets misallocated when they forecast by install date alone, because age says little about remaining useful life. By layering condition assessments, work-order history, and cost data into a predictive model, facility capital planning analytics can project replacement windows within a two-to-three-year accuracy band and flag end-of-life equipment years before failure. OxMaint brings every one of those data streams into one AI-powered CMMS so reliability leaders can defend every line in the capital request. Start a Start Free Trial or keep reading to see how the model is built.
What if every dollar in your capital plan was backed by asset-condition data—not a guess?
Facilities teams using FM predictive analytics for CapEx forecasting cut premature replacements by 18–30% and defend multi-year requests with hard cost-and-condition evidence. OxMaint turns your work orders, inspections and meter readings into a live capital forecast your CFO can trust.
Why traditional facility CapEx forecasting wastes capital
Most facility capital plans still start—and end—with an Excel column labeled "Install Date" plus a manufacturer life-expectancy table. The result is a forecast that over-funds assets in good condition and under-funds the ones actually about to fail.
- Replacement triggered at year 15 regardless of actual condition
- No live link to work-order history or inspection findings
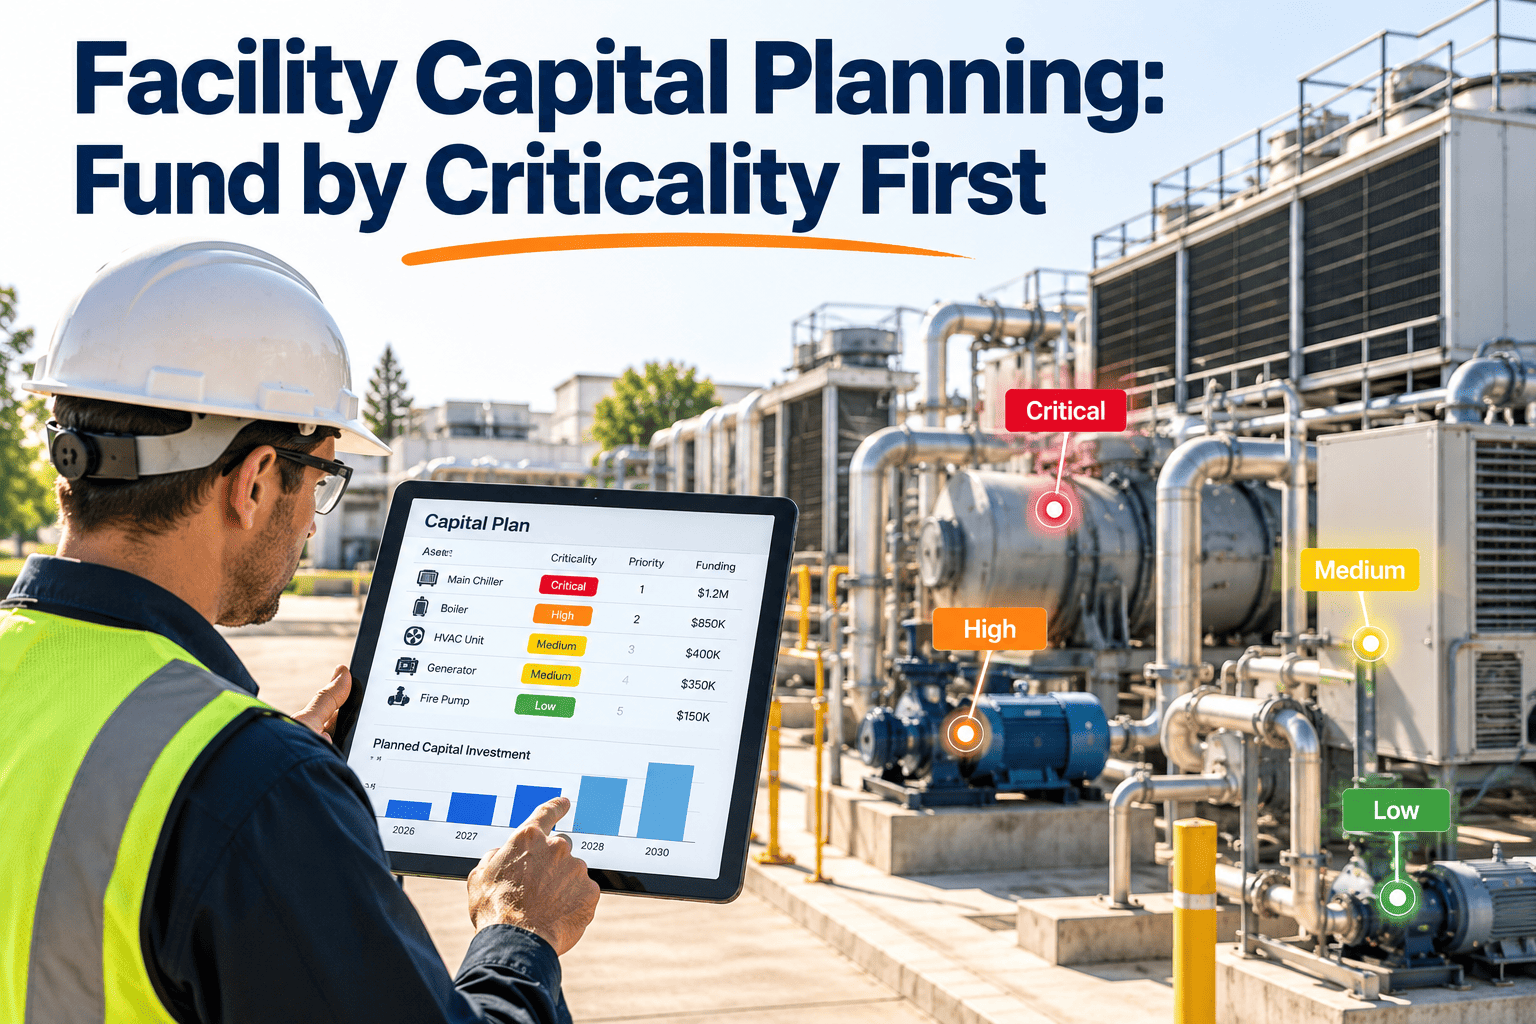
- Asset criticality treated as a footnote, not a driver
- CapEx request defended with "it's old"—CFO pushes back
- Surprise failures still occur in year 11 or 12
- Replacement triggered by condition score crossing a risk threshold
- Work orders, meter readings and IoT data feed the model weekly
- Criticality and failure cost weight every forecast line
- CapEx request defended with PdM data and cost-at-risk curves
- Failures predicted 6–24 months out, planned into the budget
How FM predictive analytics forecasts capital expenditure
A defensible facility capex model blends three data streams, weighs them by asset criticality, and converts the output into a year-by-year dollar projection. Here is the four-step methodology OxMaint uses to turn maintenance data into capital intelligence.
Aggregate condition, cost and criticality data
Pull together asset hierarchy, condition-assessment scores (1–5 scale), 24+ months of work-order history, meter-based usage readings, and replacement cost estimates. ISO 55000-aligned asset registers give the model a clean spine; gaps in hierarchy are the #1 reason forecasts miss.
Score each asset for probability and consequence of failure
Calculate a condition-based Probability of Failure (PoF) from degradation trends and a Consequence of Failure (CoF) from criticality, downtime cost and safety/recompliance impact. The product—Risk Priority Number—ranks every asset from "run to failure" to "replace this fiscal year."
Project replacement windows year by year
The predictive model fits a degradation curve to each asset class, then slides the curve forward to estimate when condition will cross the action threshold. Outputs are phased across a 3–5 year horizon so finance can see the spend curve and smooth peaks that exceed the capital cap.
Back-test against actual failures and refine
Run the model against the prior 12 months of actual failures and emergency replacements. A well-tuned facility capex prediction model should flag 80%+ of actual failures within its 24-month window. Re-calibrate weighting factors quarterly as new condition data arrives.
Key formulas in facility capex modeling
You do not need a data-science degree to read the outputs, but understanding the three core calculations helps you defend the numbers in a budget review.
Probability of Failure (0–1) scaled from condition trend × Consequence of Failure (1–100) from criticality and downtime cost. Assets above RPN 60 enter the replacement candidate pool.
Estimated years until the asset's condition score drops below the action threshold. Degradation rate is derived from 24+ months of inspection and work-order trend data.
The total dollar value weighted by failure probability across the portfolio. A 500-asset plant typically carries $2–4M in annual capital at-risk; the forecast model prioritises the top quartile.
A 180-asset plant spending $42K/yr on premature replacements
A mid-sized manufacturing facility tracked 180 critical assets on a spreadsheet, replacing each at 15 years. After implementing FM capex planning analytics, the team discovered 38% of scheduled replacements had condition scores above 4 out of 5 and RUL beyond 3 years. Deferring those 68 replacements freed $126K in the current fiscal year while the model simultaneously flagged 11 assets with accelerating degradation that would have failed before the next budget cycle. Net effect: $84K redirected from premature replacement to high-risk intervention, with a fully defensible audit trail.
What data does FM capex prediction need to be accurate?
Predictive analytics is only as good as the data feeding it. The table below shows the minimum data sets, why each matters, and the quality bar required for a forecast accurate enough to present to a board.
| Data Stream | Why It Drives the Forecast | Minimum Quality Bar |
|---|---|---|
| Asset hierarchy & register | Provides the parent-child structure for cost and criticality roll-ups | 95%+ assets mapped, ISO 55000-aligned naming |
| Condition assessments | Primary input for Probability of Failure scoring | Scored 1–5, updated annually, 90%+ coverage |
| Work-order history | Reveals degradation trends and recurring failure patterns | 24+ months of closed WOs with failure codes |
| Meter / usage readings | Normalises wear across assets with different duty cycles | Monthly readings, <5% gap rate |
| Replacement cost estimates | Converts risk scores into dollar-denominated forecasts | Refreshed every 24 months, vendor-validated |
| Asset criticality rating | Weights consequence of failure for risk prioritisation | Assigned per asset, reviewed annually |
See your capital forecast built from real asset data
Book a 30-minute demo and we will walk through how OxMaint turns your work orders and condition scores into a defensible multi-year CapEx plan.
How OxMaint powers your facility capital forecast
OxMaint is an AI-powered CMMS and EAM platform that unifies the exact data streams predictive CapEx forecasting depends on—so your capital plan updates itself as maintenance happens, not once a year in a spreadsheet.
Live condition scoring
Every inspection, work order and meter reading automatically updates the asset's condition score and RUL estimate—no manual data exports, no stale spreadsheets. Forecast accuracy improves weekly.
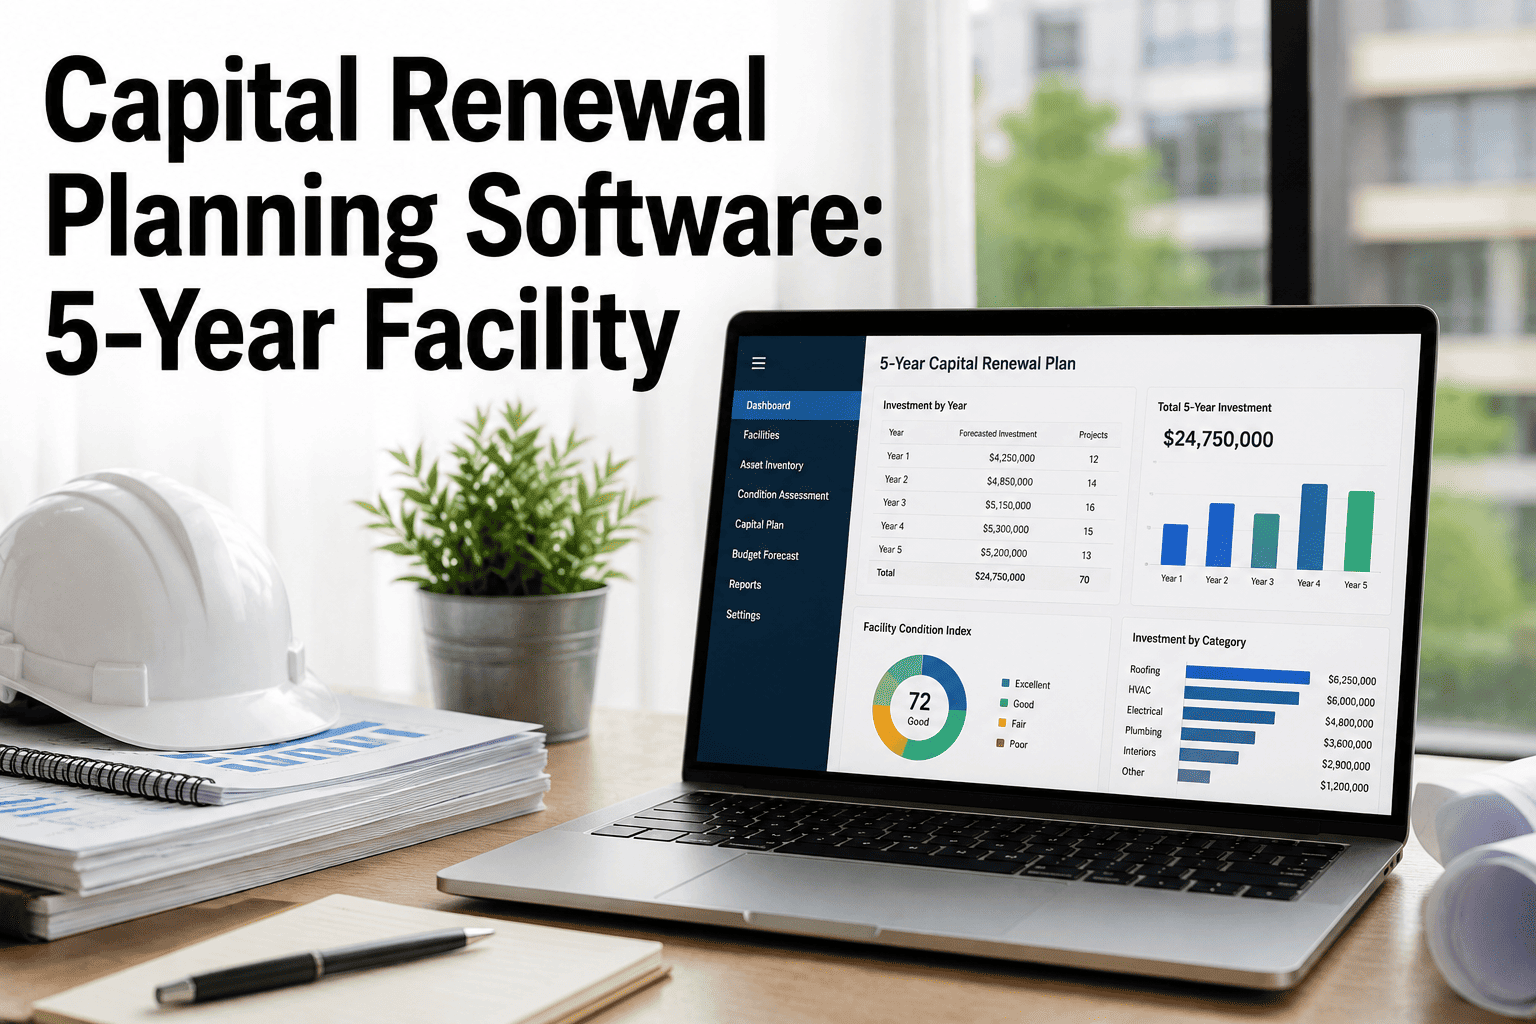
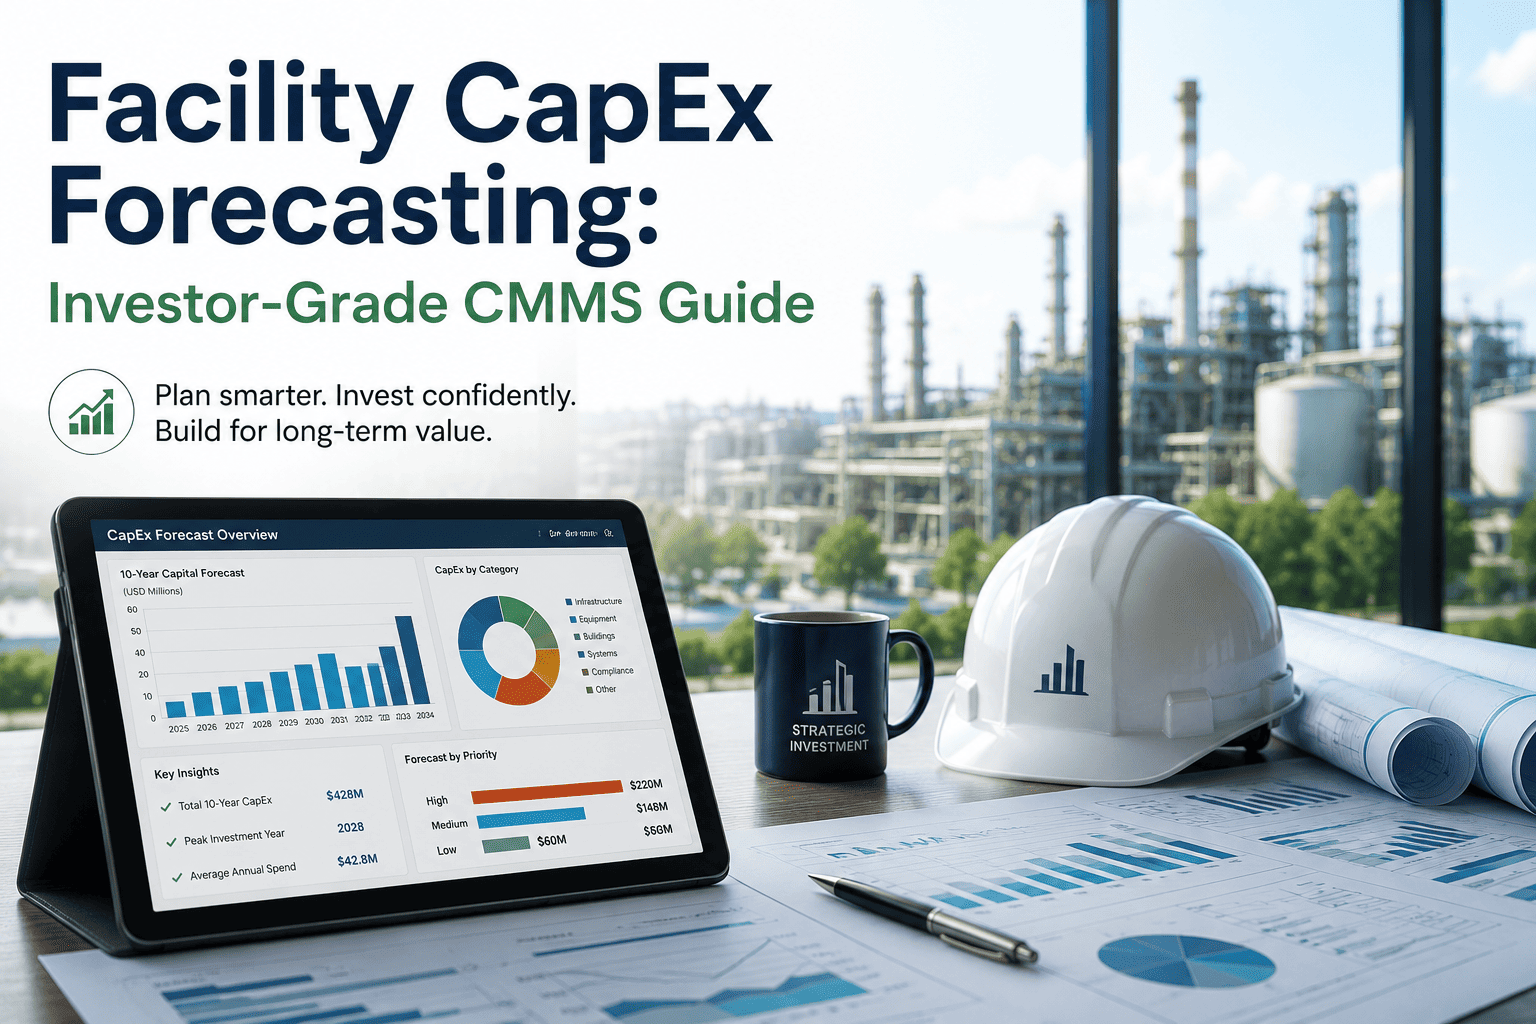
Multi-year capital forecast dashboard
Visualise replacement candidates phased across 3–5 years, filter by site, asset class or risk tier, and export a board-ready report with cost-at-risk curves and defensible RPN backing for every line item.
Asset hierarchy & criticality engine
Build an ISO 55000-aligned asset register with parent-child relationships and automated criticality ratings. The hierarchy feeds directly into the risk model so roll-ups from component to system to site are instant.
Predictive failure alerts
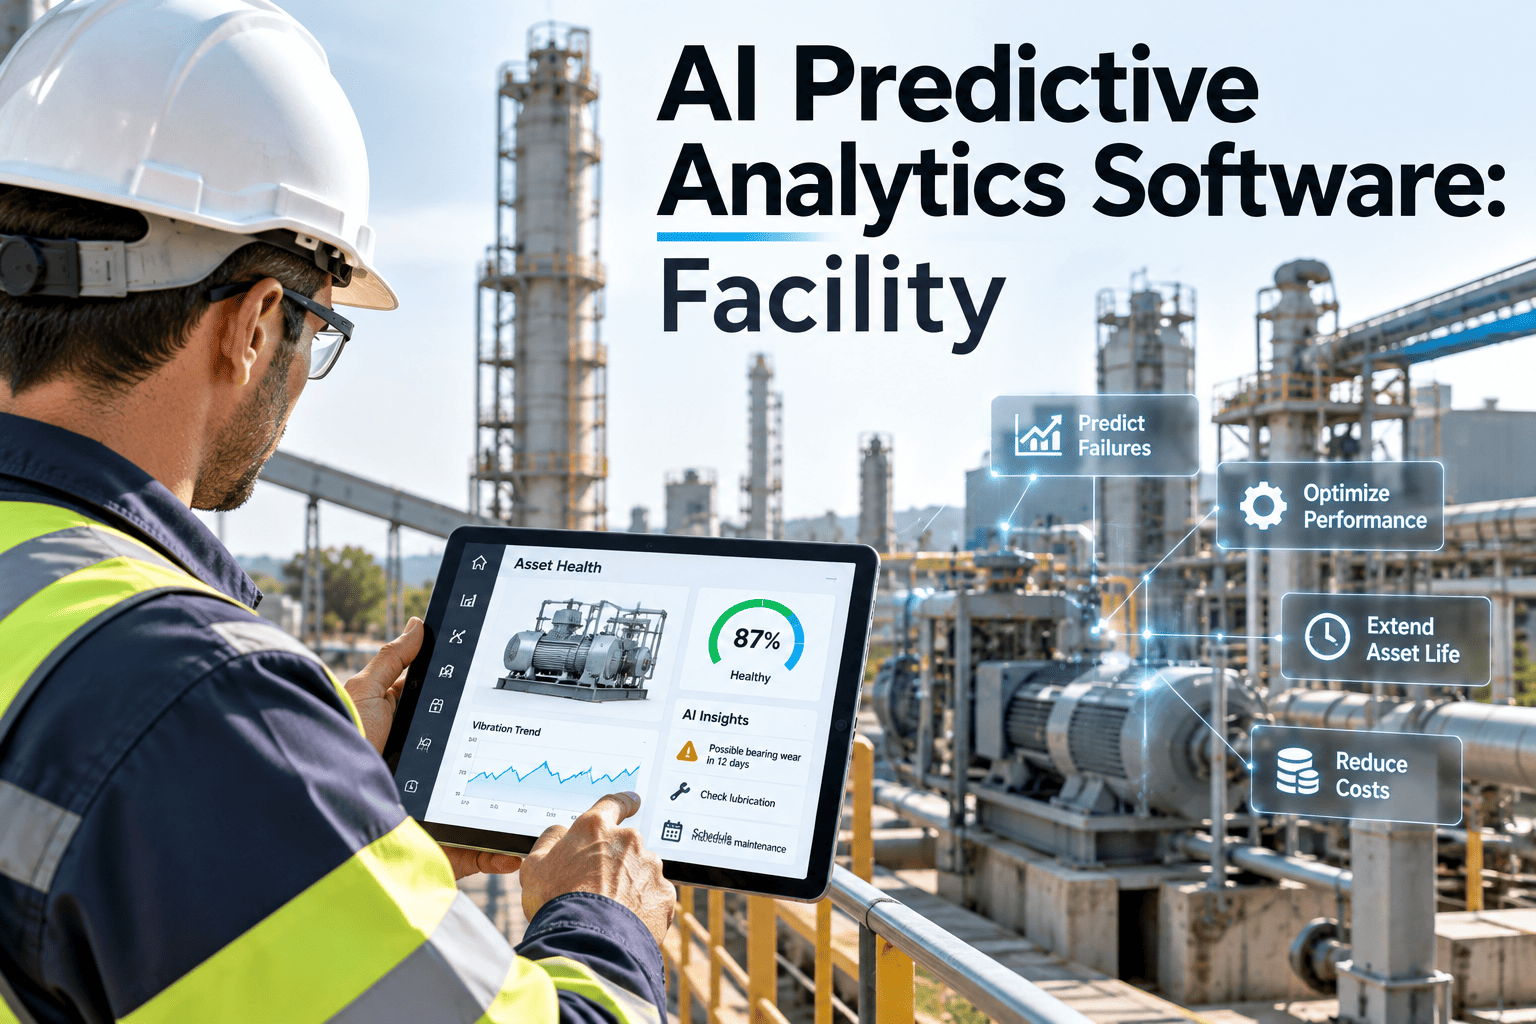
AI pattern detection on work-order and sensor data flags assets with accelerating degradation before they cross the action threshold, giving finance 6–18 months to pre-budget instead of emergency-funding.
What changes when capital plans meet condition data
The shift from reactive, age-based capital planning to predictive, condition-based forecasting produces measurable outcomes within the first budget cycle.
"We moved 180 assets from a spreadsheet into OxMaint and within one quarter identified $126K in deferred replacements plus 11 assets we would have missed entirely. The capital request went to the board with condition scores and risk curves—approved without a single challenge."
FM predictive analytics for CapEx forecasting: FAQs
What is FM predictive analytics for CapEx forecasting?
It is the use of condition, work-order and cost data to predict when assets will need replacement, then converting those predictions into a multi-year capital expenditure plan. Unlike age-based forecasting, it accounts for actual asset health, criticality and degradation trends, producing defensible budgets that survive finance review. You can see it in action—book a demo and we will build a sample forecast from your asset list.
How accurate is facility capex prediction using analytics?
A well-tuned model with 24+ months of clean work-order history and annual condition assessments typically flags 80% or more of actual failures within a 24-month prediction window. Accuracy improves as more data accumulates—most facilities reach the 80% threshold within 6–9 months of implementation on OxMaint.
What data do we need to start with FM capital forecasting analytics?
You need four core data streams: an asset register with hierarchy, condition scores (1–5 scale), at least 12–24 months of work-order history with failure codes, and replacement cost estimates. Asset criticality ratings and meter readings improve accuracy further. OxMaint imports existing spreadsheets and CMMS exports, so you can begin modelling in weeks, not months.
How is predictive CapEx forecasting different from preventive maintenance?
Preventive maintenance schedules routine servicing at fixed intervals to keep assets running; predictive CapEx forecasting projects when assets will reach end-of-life and need full replacement or major overhaul. They share the same data source—work orders and condition scores—but the output of CapEx forecasting is a financial plan, not a maintenance schedule.
How long does it take to implement facility capital planning analytics in OxMaint?
Most facilities are live with a working capital forecast within 4–8 weeks. The timeline depends on asset-register cleanliness and how much historical work-order data exists. OxMaint's onboarding team handles data import, hierarchy mapping and initial model calibration—you can start a free 14-day trial to explore the platform immediately while planning the full rollout.
Stop guessing. Start forecasting with data.
Join the facilities teams using OxMaint to build defensible, condition-based capital plans that save 18–30% on annual CapEx. Book a demo and see your first forecast in under 30 minutes.
Free 14-day trial · No credit card