Modern facility managers are drowning in disconnected data — alarms firing across systems, work orders piling up, and technicians scattered across floors with no unified view of what's happening. A real-time facility operations war room dashboard changes everything by bringing every critical signal into one command center. Sign Up Free and give your operations team the visibility they've been missing.
Your Building Has 1,000 Moving Parts. See All of Them — Right Now.
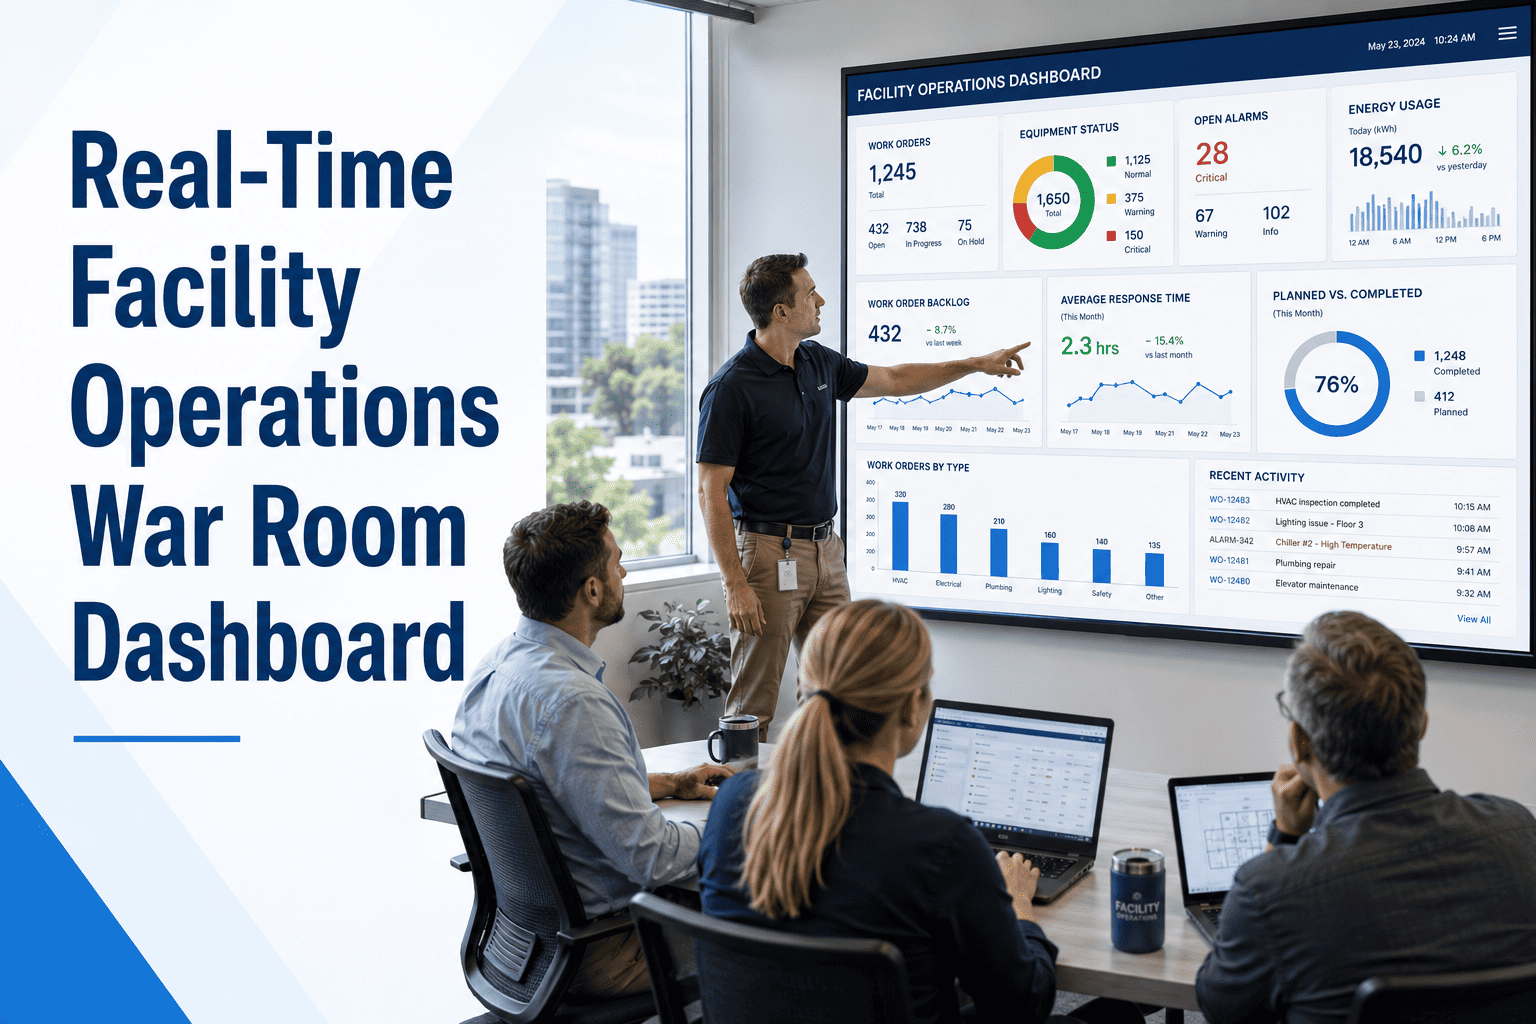
Oxmaint's War Room Dashboard unifies alarms, work orders, asset health, safety risks, and technician activity into a single real-time command center built for enterprise facility teams.
What a War Room Dashboard Actually Monitors
Active alarms ranked by severity, zone, and system type — HVAC, electrical, fire, plumbing — with auto-escalation rules and acknowledgment tracking in real time.
Open, in-progress, and overdue work orders visible to all managers simultaneously. Priority flags, assigned technician, and SLA countdown visible at a glance.
Every critical asset — chillers, AHUs, pumps, elevators — scored on a health index derived from sensor readings, maintenance history, and failure pattern data.
Floor-by-floor safety risk visualization showing open hazards, overdue safety inspections, chemical storage alerts, and permit-to-work status across the building.
Real-time technician activity map showing who is working on what, where they are, and how long tasks are taking — enabling instant redeployment during emergencies.
Live energy draw per zone compared against baseline benchmarks, with spike alerts that flag anomalies before they become costly utility overruns or equipment failures.
Dashboard Performance Benchmarks — Enterprise Facilities
| Metric | Without Dashboard | With War Room Dashboard | Improvement |
|---|---|---|---|
| Mean Time to Acknowledge Alarm | 18 minutes | 4 minutes | 78% faster |
| Work Order Completion Rate | 61% | 89% | +28 pts |
| Unplanned Downtime Events/Month | 14 | 5 | 64% fewer |
| Technician Idle Time | 22% | 9% | 59% reduction |
| Safety Incidents per Quarter | 7 | 2 | 71% reduction |
The single biggest operational gap I see in large facilities is reaction lag — managers don't know something has gone wrong until it's already escalated. A real-time war room dashboard doesn't just speed up response, it fundamentally changes the decision-making culture. When your team can see the entire building's health on one screen, they stop firefighting and start predicting. In my experience, facilities that implement unified command dashboards cut their critical incident rate by more than half within the first six months of deployment.
Stop Reacting. Start Commanding Your Facility.
Oxmaint's War Room Dashboard is live in minutes — no hardware required. Connect your existing systems and get complete operational visibility from day one.