The CMMS business case fails most often not because the numbers are wrong, but because they are never calculated. Facility managers absorbing reactive maintenance costs every quarter in emergency repair premiums, unplanned downtime, compliance penalties, and technician overtime rarely see those costs attributed to the absence of a structured maintenance platform. A mid-size FM operation spending $420,000 annually on maintenance can reduce that figure by $94,000 to $168,000 within 18 months of CMMS deployment, representing a 2.2x to 4.8x return on typical platform investment. This article provides the calculation framework, the input data you need to gather, and the presentation structure that secures budget approval. Start a free trial or book a demo to see how Oxmaint's analytics dashboard tracks every metric that drives your ongoing CMMS ROI case.
FM Data, Analytics and ROI
CMMS ROI for Facility Management: Calculate, Justify and Measure Your Investment
Pillar · P1 · 10 min read
4.8x
Maximum documented ROI on CMMS investment within 18 months for FM operations with high reactive maintenance ratios
9 months
Typical CMMS payback period when emergency repair ratio drops from 38% to below 16% within 12 months of deployment
$94K+
Minimum annual maintenance cost reduction for a mid-size FM operation on a structured CMMS PM programme
68%
Average reduction in unplanned maintenance events within 12 months of structured PM programme via CMMS
The Five CMMS ROI Drivers: Where the Value Is Generated
CMMS ROI is not a single number. It is the aggregate of five distinct value streams, each measurable independently. Understanding which drivers are largest in your operation determines where to focus your calculation effort.
Emergency Repair Premium Elimination
Value mechanism
Reactive to planned shift
4.8x cost premium removed
Parts pre-staging enabled
Data inputs needed
Emergency work order count per year · Average cost per emergency event · Current PM compliance rate · Target PM compliance after CMMS deployment
Largest value driver
for operations with emergency WO ratio above 25% of total work orders
Labour Productivity Recovery
Value mechanism
Admin time eliminated
Reactive disruption removed
Travel time reduced
Data inputs needed
Technician count and fully loaded hourly rate · Hours per week on paper-based admin and manual scheduling · Hours lost to reactive callout disruption of PM calendar
15-22% gain
typical productivity increase for technicians moving from paper to mobile CMMS workflows
Value mechanism
PM compliance increase
Condition-based intervention
CapEx deferral
Data inputs needed
Asset replacement values by class · Current average PM compliance rate · Expected PM compliance post-deployment · Industry MTBF benchmarks by equipment type
2-4 year extension
on HVAC, pumps, and electrical assets with PM compliance above 85%
Compliance Cost Avoidance
Value mechanism
Audit prep eliminated
Penalty risk removed
Documentation automated
Data inputs needed
Number of regulatory audits per year · Staff hours per audit for preparation · Any historical penalty costs · Compliance documentation labour rate
84% prep reduction
audit preparation time saved when records are captured automatically in CMMS vs paper filing
Step-by-Step CMMS ROI Calculation Framework
The five steps below use a mid-size commercial FM operation as the worked example. Replace the figures with your own data to generate a tailored ROI case for budget approval.
1
Calculate Current Emergency Repair Annual Cost
↓
2
Project Emergency Repair Reduction After CMMS Deployment
FM operations achieving 80% PM compliance or above reduce emergency work orders by 47% to 68%. Apply the conservative 47% reduction to your current emergency spend. Example: $281,600 x 47% = $132,352 annual emergency cost reduction. This single driver typically covers CMMS platform cost within 12 months for most mid-size FM operations.
↓
3
Calculate Labour Productivity Recovery Value
Estimate technician hours per week on paper-based admin, manual scheduling, and reactive callout coordination. Multiply by the fully loaded hourly rate. Example: 4 technicians x 6 hours/week admin x $68/hr x 48 weeks = $78,336 annual recoverable labour cost. CMMS mobile deployment recovers 15 to 22% of this total from day one.
Start free trial to measure labour productivity in Oxmaint.
↓
4
Add Compliance Documentation Cost Avoidance
Count annual regulatory audits and multiply pre-audit preparation hours by the loaded rate of staff involved. Example: 3 audits x 18 hours preparation x $80/hr = $4,320 recoverable annually. Add any historical penalty costs. This driver is smaller in absolute terms but high-confidence and easy to document for a finance audience.
↓
5
Calculate Total Annual Benefit and Payback Period
Sum all value streams. Divide platform annual cost into total annual benefit to get ROI multiple. Divide annual benefit into platform cost to get payback period in months. Example: $132,352 + $17,100 labour + $4,320 compliance = $153,772 total annual benefit. Platform at $18,000/yr = 8.5x ROI. Payback = $18,000 divided by $153,772 x 12 = 1.4 months.
Book a demo to model your specific ROI with Oxmaint data.
CMMS ROI by FM Operation Type
| FM Operation Type |
Typical Pre-CMMS Cost Profile |
Expected ROI After Deployment |
| Commercial office portfolio (5 to 20 buildings) | 38% emergency WO ratio. Compliance documentation manual. PM schedules in spreadsheets. Contractor management ad hoc with no SLA tracking or scorecard evidence. | 2.2x to 3.8x ROI within 18 months. Primary driver: emergency repair reduction. Secondary: contractor SLA accountability reducing callback costs and repeat visits. |
| Healthcare facility management | High regulatory documentation burden. Zero tolerance for critical system failure. Compliance audit preparation consuming 40 to 60 staff hours per cycle with manual record search. | 3.1x to 5.2x ROI within 24 months. Primary driver: compliance cost avoidance and risk reduction. Secondary: PM compliance protecting life-safety critical systems. |
| Industrial plant or manufacturing site | Production downtime cost makes every unplanned stop expensive at $10,000 to $80,000 per hour depending on sector. Emergency repair premium on high-criticality rotating equipment. | 4.2x to 6.8x ROI within 12 months. Primary driver: downtime prevention on production-critical assets. Secondary: spare parts inventory optimisation reducing emergency procurement. |
| Multi-site retail or hospitality portfolio | Contractor management fragmented across multiple vendors with no unified performance tracking. Reactive callout premiums absorbed across all sites without visibility. | 2.8x to 4.1x ROI within 18 months. Primary driver: contractor SLA compliance and reduced reactive callout rate. Secondary: portfolio-level PM visibility from one dashboard. |
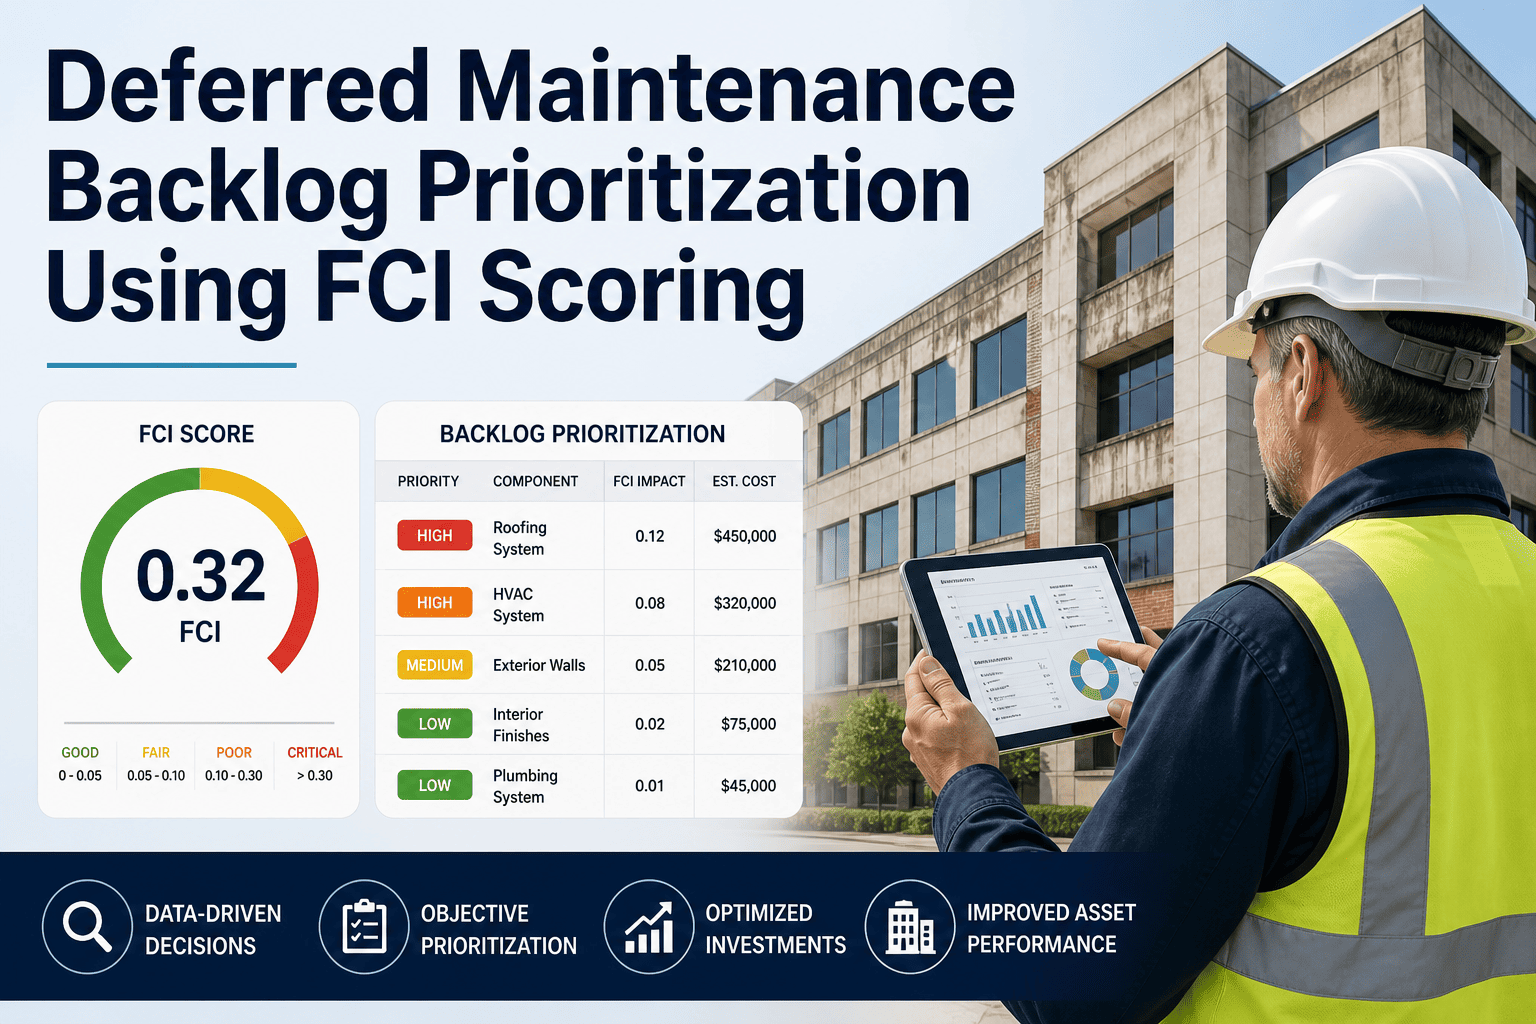
| Government or public sector estate | Large deferred maintenance backlog compounding at 3 to 5% annually. Compliance documentation for multiple regulatory frameworks. Capital planning evidence required for budget approval. | 3.4x to 5.6x ROI within 24 months. Primary driver: backlog prioritisation reducing high-cost emergency interventions. Secondary: CapEx evidence quality improving approval rates. |
Building the Budget Approval Business Case
The ROI calculation is necessary but not sufficient for budget approval. The four-step presentation structure below has the highest approval rate in FM capital budget submissions based on decision-making patterns of senior leadership and finance teams.
01
Lead With the Current Cost of Inaction, Not the Platform Cost
Budget approvers reject CMMS proposals that open with platform pricing. They approve proposals that open with the quantified annual cost of operating without one. Frame current reactive maintenance spend, compliance documentation labour, and emergency repair premiums as the baseline cost the investment eliminates. The platform cost is then presented as a fraction of the problem it solves.
02
Use Conservative Estimates and Cite Industry Benchmarks
Apply the lowest defensible reduction percentages from IFMA, BOMA, or similar recognised FM benchmarks rather than optimistic internal projections. A 47% emergency repair reduction is conservative versus the 68% benchmark maximum but significantly more credible to a finance audience. Citing recognised FM benchmarks as the basis for your reduction estimates increases approval probability measurably.
Book a demo to access Oxmaint benchmark data for your ROI submission.
03
Present a Phased Implementation Timeline With Milestone ROI
Show the approver exactly when each value stream begins generating return. Emergency repair reduction starts within 3 to 6 months as PM compliance rises. Labour productivity recovery starts immediately on deployment. Compliance cost avoidance is realised at the next audit cycle. A month-by-month payback chart is more persuasive than a single 18-month aggregate ROI figure.
04
Include a Risk Quantification Section
Quantify the probability-weighted cost of a single significant failure event that structured PM would have prevented. Major HVAC failure in a commercial building: $45,000 to $120,000. Compliance Notice of Violation: $15,000 to $180,000 in penalties plus remediation. Risk quantification converts the proposal from a cost-saving exercise to a risk management decision, which carries a higher approval threshold.
Start free trial to access Oxmaint risk-weighted asset reporting for your business case.
CMMS ROI Performance Benchmarks
Reduction in unplanned maintenance events within 12 months of CMMS-supported PM programme deployment68%
Reduction in compliance audit preparation time when maintenance records are captured automatically in CMMS84%
Reduction in emergency callouts for FM operations achieving 80% or above PM compliance via CMMS scheduling47%
Average productivity gain for technicians moving from paper-based to mobile CMMS work order management22%
Continue Reading: FM Data, Analytics and ROI
Maintenance Data Analytics: Turning Work Order History into Strategic InsightsFailure trends, cost patterns, technician performance, and predictive analytics from your CMMS work order data.
Read More
Facility Management Dashboard Design: KPIs, Widgets and Executive Reporting 2026KPI visualisation, real-time alerts, portfolio views, and executive-ready reporting for facility leadership teams.
Read More
AI-Powered Facility Performance Reports: Automated Executive Briefings for FM LeadersNatural language summaries, automated trend analysis, and board-ready facility performance reports.
Read More
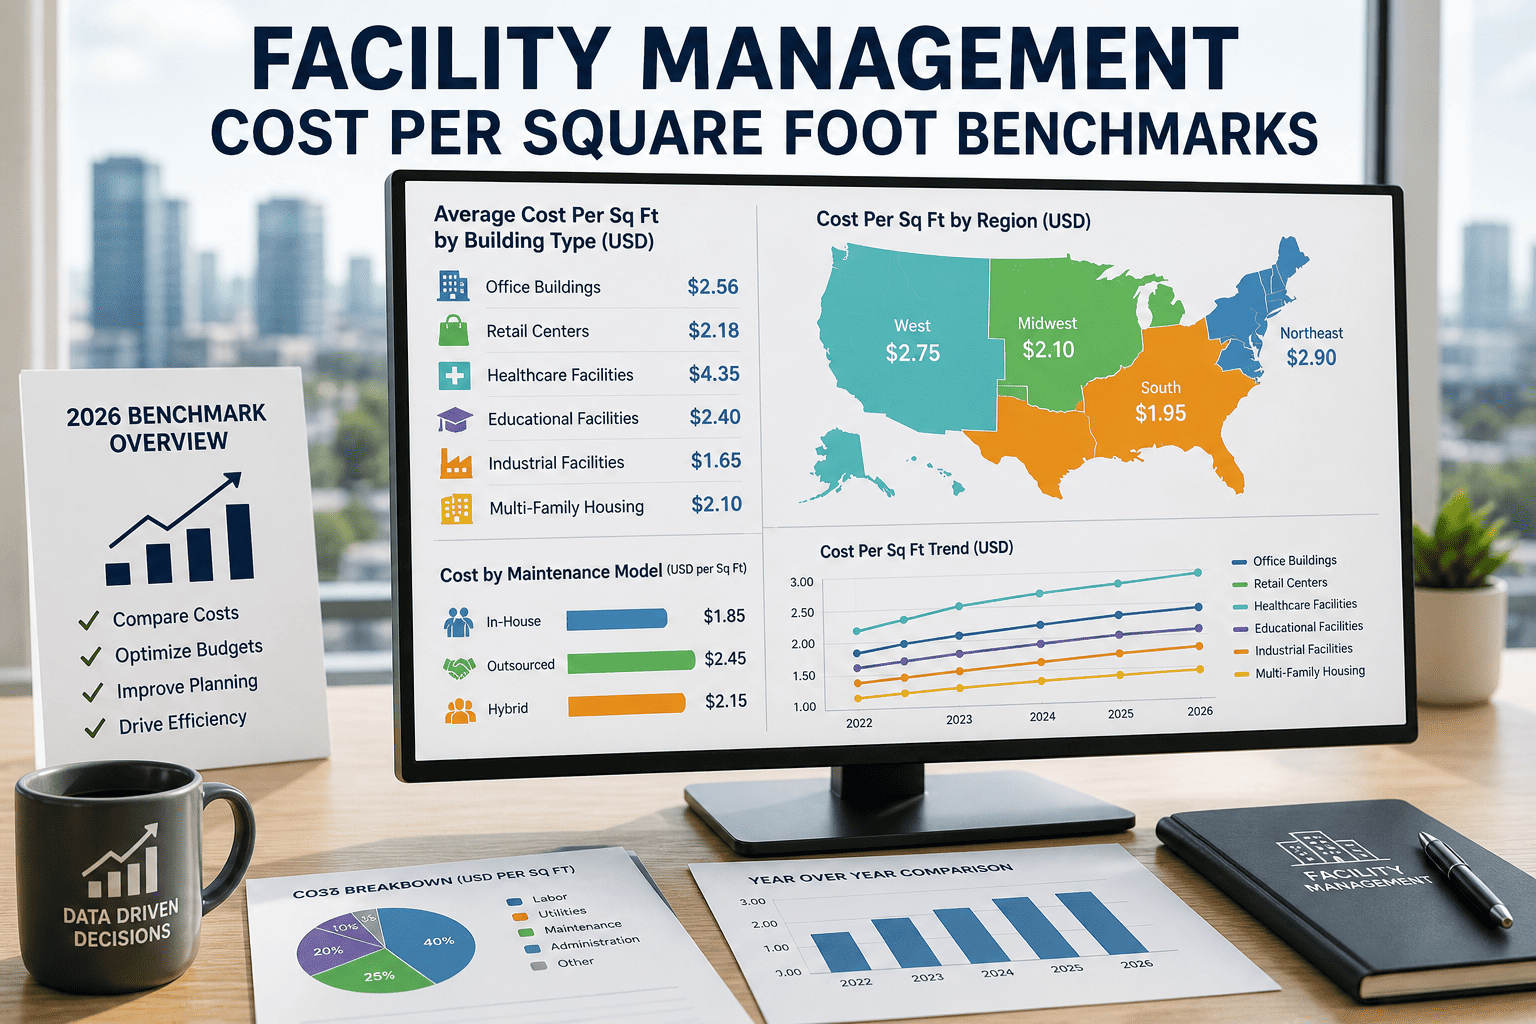
Benchmarking Facility Performance: IFMA Standards, BOMA Data and Industry Comparisons 2026Cost per sqft, maintenance ratios, and energy intensity against IFMA and BOMA benchmarks for evidence-based FM decisions.
Read More
Frequently Asked Questions
QWhat is the typical CMMS payback period for a mid-size commercial FM operation?
9 to 18 months when emergency repair reduction is the primary value driver. Industrial operations with high production downtime costs can see payback within 3 to 6 months.
Start free trial or
book a demo to model your specific payback period.
QWhich CMMS ROI driver is largest for a commercial property FM operation?
Emergency repair premium elimination is the largest single driver for most commercial FM operations, representing 60 to 75% of total CMMS ROI. An emergency work order costs 4.8x more than a planned event at the same asset.
Book a demo to see how Oxmaint tracks your emergency vs planned ratio in real time.
QHow does Oxmaint's analytics dashboard support ongoing CMMS ROI measurement?
Oxmaint tracks PM compliance, emergency WO ratio, cost per work order, MTBF by asset class, and labour productivity on a live dashboard. Monthly ROI progress reports are exportable without manual data compilation.
Sign up free to access the Oxmaint analytics dashboard today.
QWhat data do I need before calculating CMMS ROI for a budget submission?
Emergency work order count and average cost per event. Technician count, hourly rate, and admin hours per week. Number of annual audits and preparation hours. Any historical penalty costs. Asset replacement values for the life extension calculation.
Book a demo for a guided ROI data-gathering session with the Oxmaint team.
The ROI Case Writes Itself When the Data Is in One Place. Start Measuring This Quarter.
Oxmaint's analytics dashboard tracks every metric that drives CMMS ROI: PM compliance, emergency WO ratio, MTBF, cost-per-event, and labour productivity. Your next budget submission is built from live data, not estimates. Go live in 14 days.