The stadium maintenance director manages 2,400 assets across 1.2 million square feet—chillers, air handlers, pumps, lighting arrays, elevators, kitchen equipment, irrigation systems—each with different service intervals, failure modes and criticality levels. When the main chiller failed during a sold-out playoff game, the team discovered warning signs had been visible in maintenance logs for months—buried in filing cabinets nobody reviewed.
This playbook provides the step-by-step implementation roadmap for stadium maintenance automation. Stadiums completing this journey achieve 40-60% reduction in unplanned downtime while cutting maintenance labor costs 25-35%. Teams ready to begin can sign up free to start with digital asset tracking.
What if your maintenance team knew which equipment would fail next week—and had parts, technicians, and schedule already in place?
Playbook Overview
Objective
Transform reactive maintenance into predictive operations through smart building automation
Timeline
9-12 months for full implementation
Expected ROI
$300,000 - $600,000 annual savings
Key Outcome
40-60% reduction in unplanned downtime
Where Are You Today?
1
Reactive
Paper logs, tribal knowledge
→
2
Digital
CMMS, barcode/QR tagging
→
3
Condition-Based
IoT sensors, risk scoring
→
4
Predictive
AI analytics, ML optimization
→
5
Autonomous
Self-optimizing systems
PLAY 1
Objective
Establish complete digital visibility into every maintainable asset with barcode/QR identification and linked documentation via Oxmaint CMMS.
Actions
1.1
Walk all stadium zones and photograph every maintainable asset
1.2
Record nameplate data: manufacturer, model, serial, install date, specifications
1.3
Apply barcode/QR tags linked to digital records in CMMS
1.4
Upload OEM manuals, warranty certificates, and maintenance histories
1.5
Build asset hierarchy: System → Subsystem → Component
1.6
Assign criticality ratings based on event impact and safety
Completion Checklist
☐ 100% of assets documented in digital registry
☐ QR codes applied to all critical equipment
☐ OEM manuals linked to each asset record
☐ Asset hierarchy structure defined and implemented
☐ Criticality matrix completed and reviewed
Success Criteria
Any technician can scan any asset QR code and instantly access complete equipment history, documentation, and maintenance requirements.
PLAY 2
Objective
Shift from calendar-based to condition-based maintenance using IoT sensors that trigger interventions based on actual equipment health.
Actions
2.1
Identify top 20% of assets representing 80% of risk and cost
2.2
Select and install appropriate IoT sensors per equipment type
2.3
Configure data collection intervals based on equipment criticality
2.4
Establish baseline performance signatures for each monitored asset
2.5
Set threshold alerts for deviation from normal operation
Quick Reference: Sensor Selection
| Equipment |
Sensors |
Alert Thresholds |
| Chillers |
Temp, pressure, current, vibration |
Efficiency >10% drop, vibration +25% |
| Air Handlers |
Pressure differential, temp, vibration |
Pressure +20%, temp ±5°F |
| Pumps |
Vibration, current, flow, temp |
Vibration +30%, current +15% |
| Electrical |
Current, thermal, power quality |
Imbalance >10%, hotspots +40°F |
| Elevators |
Vibration, current, cycle time |
Cycle +20%, current spikes |
Completion Checklist
☐ Critical assets identified and prioritized
☐ Sensors installed on 80%+ of critical equipment
☐ Baseline signatures documented for all monitored assets
☐ Alert thresholds configured and tested
☐ Real-time monitoring dashboard operational
Success Criteria
Equipment anomalies are detected within minutes of occurrence, not discovered during failures or scheduled inspections.
PLAY 3
Objective
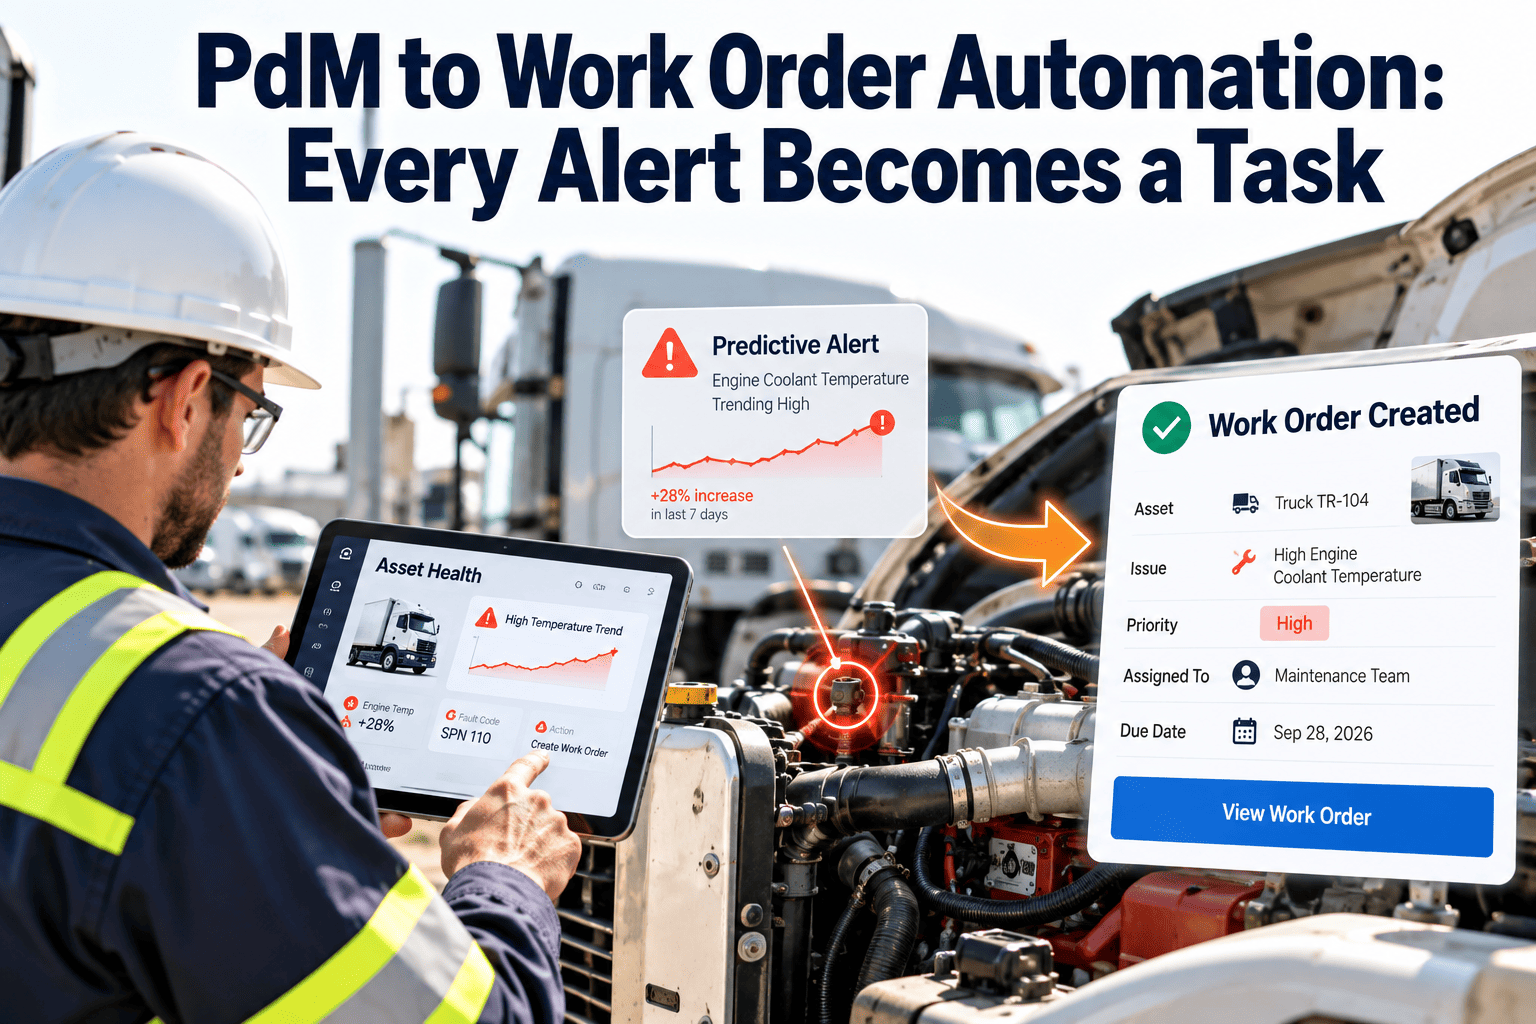
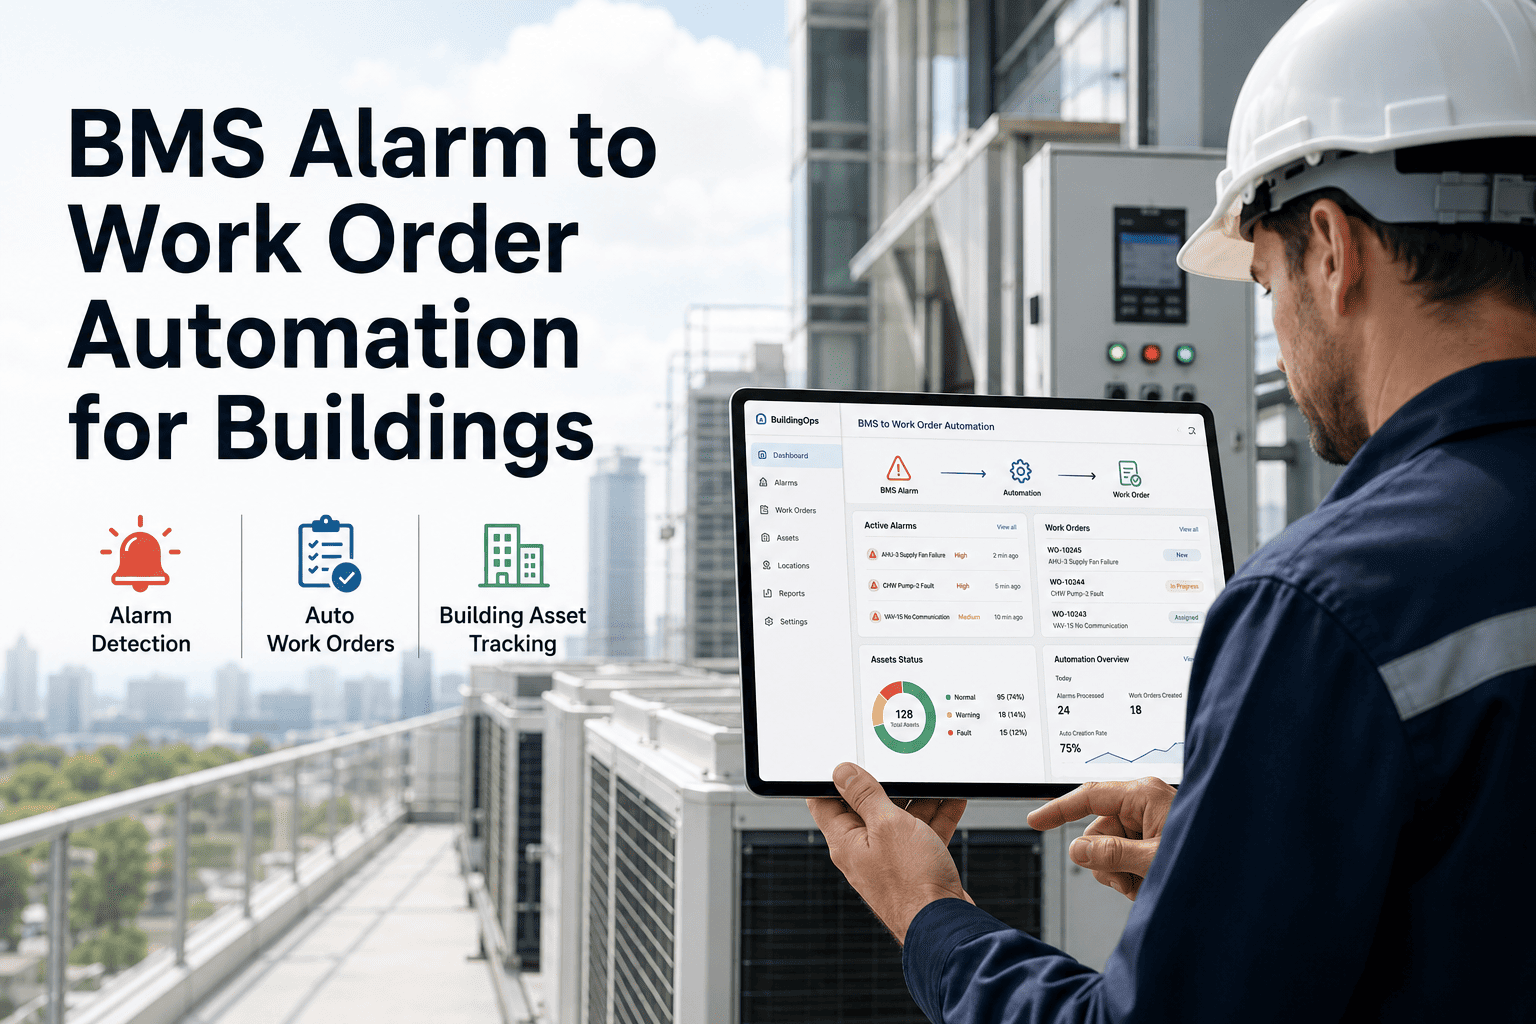
Eliminate manual work order creation delays through automated ticket generation, risk scoring, and intelligent technician assignment.
Actions
3.1
Map condition triggers to work order types and priority levels
3.2
Configure risk scoring rules based on safety, event timing, criticality
3.3
Set up technician assignment based on skills and location
3.4
Define escalation paths for unacknowledged tickets
3.5
Create work order templates with troubleshooting steps and parts lists
Quick Reference: Automation Flow
Trigger
Sensor detects threshold breach
→
Score
Risk scoring assigns priority
→
Generate
Work order created with context
→
Assign
Routes to right technician
→
Escalate
Auto-escalate if unacknowledged
Completion Checklist
☐ All condition triggers mapped to work order types
☐ Risk scoring matrix implemented and tested
☐ Technician skill profiles configured
☐ Escalation workflows active
☐ Work order templates created for all equipment types
Success Criteria
95%+ of condition-triggered tickets are assigned to the correct technician on first attempt with response time under 30 minutes.
PLAY 4
Objective
Move from reactive condition alerts to predictive failure forecasting using AI analytics that identify problems weeks before they occur.
Actions
4.1
Accumulate 60-90 days of condition data for AI model training
4.2
Enable machine learning models for failure prediction
4.3
Configure predictive alerts with confidence scoring
4.4
Integrate predictions into maintenance scheduling system
4.5
Establish feedback loops for continuous model improvement
Quick Reference: Prediction Capabilities
| System |
Prediction Window |
Accuracy |
Value |
| HVAC Compressors |
4-8 weeks |
75-85% |
Prevents $50-150K emergency costs |
| Electrical Distribution |
2-4 weeks |
80-90% |
Avoids event cancellations |
| Pumps & Motors |
6-12 weeks |
70-80% |
Schedules non-event repairs |
| Kitchen Equipment |
1-3 weeks |
65-75% |
Ensures concession availability |
Completion Checklist
☐ Minimum 60 days of condition data collected
☐ AI models trained and validated
☐ Predictive alerts configured with confidence thresholds
☐ Predictions integrated into scheduling workflows
☐ Feedback mechanism established for model refinement
Success Criteria
75%+ of AI predictions result in confirmed maintenance needs, with failures predicted 2+ weeks before occurrence.
PLAY 5
Objective
Digitize visual inspections and regulatory compliance with mobile inspections facility management that creates audit-ready compliance logs automatically.
Actions
5.1
Convert paper checklists to mobile-friendly digital forms
5.2
Configure inspection routes optimized by zone and priority
5.3
Enable photo capture and annotation for defect documentation
5.4
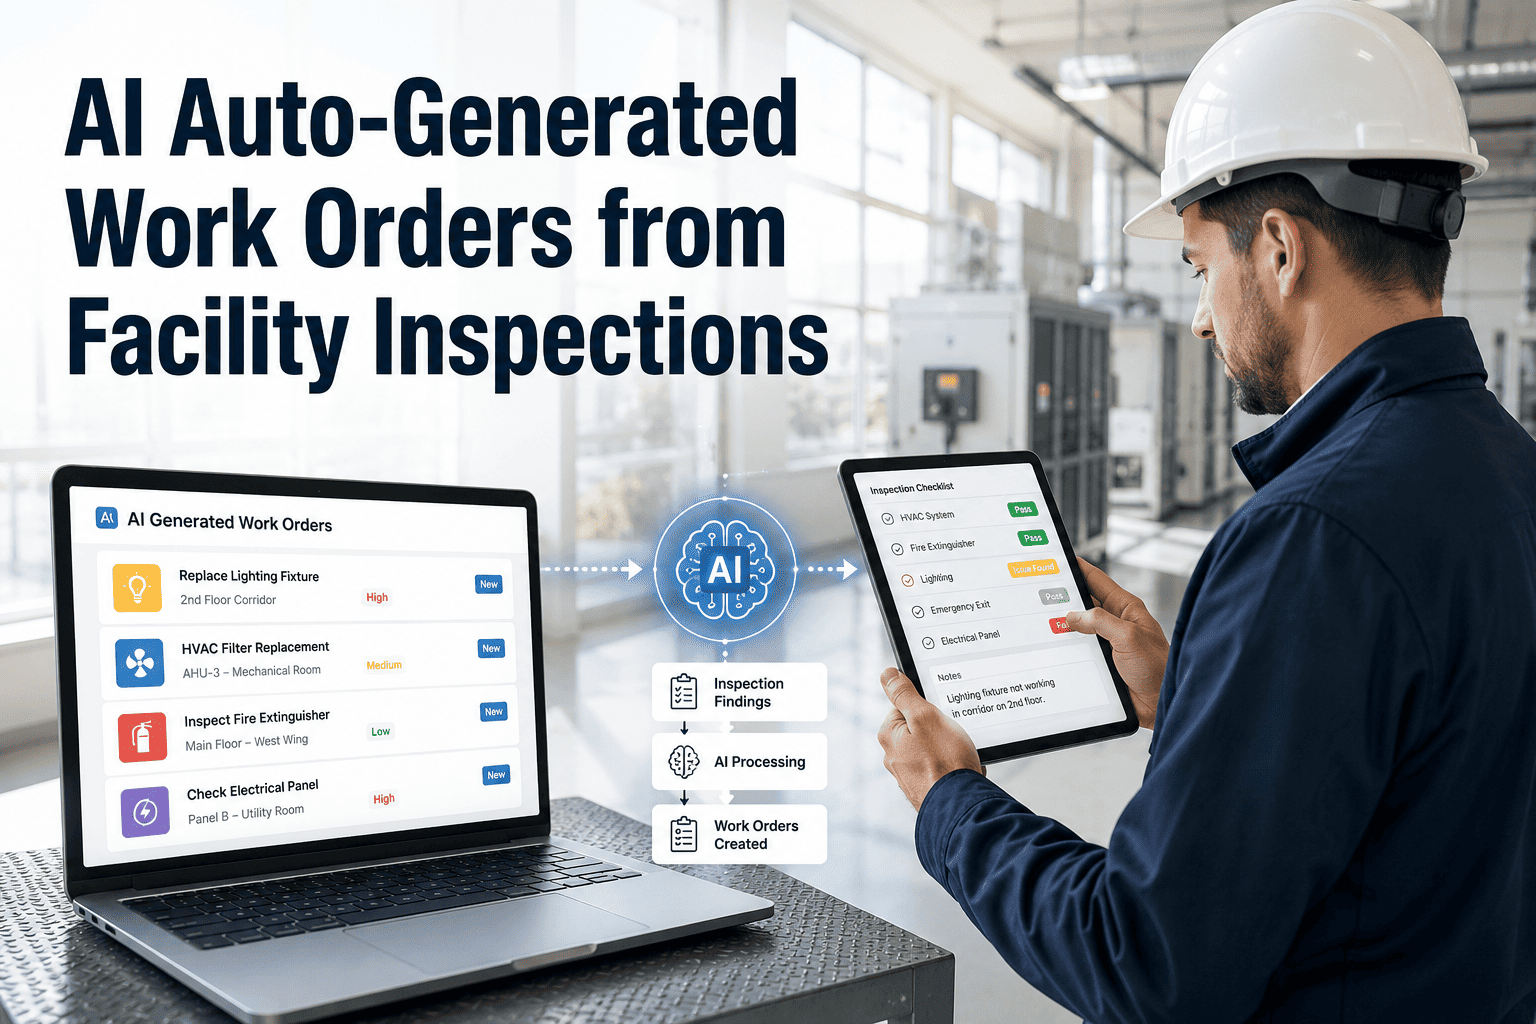
Set up automatic work order creation from failed inspections
5.5
Build compliance reporting dashboards per facility management compliance requirements
Completion Checklist
☐ All inspection checklists digitized
☐ Inspection routes configured and tested
☐ Photo documentation enabled
☐ Failed inspection → work order automation active
☐ Compliance dashboards operational
Success Criteria
98%+ inspection compliance rate with complete audit trail documentation available within seconds for any regulatory inquiry.
PLAY 6
Objective
Establish governance processes that continuously improve automation performance per facility management CMMS best practices.
Actions
6.1
Conduct monthly automation performance reviews
6.2
Analyze and adjust false positive thresholds quarterly
6.3
Expand sensor coverage to additional equipment semi-annually
6.4
Benchmark against industry standards annually
6.5
Retrain AI models with new failure data annually
Completion Checklist
☐ Monthly review calendar established
☐ KPI dashboards configured
☐ Threshold adjustment process documented
☐ Expansion roadmap created
☐ Benchmarking data sources identified
Success Criteria
Year-over-year improvement in all KPIs with false positive rate below 10% and automation coverage expanding each quarter.
Operationalizing AI Insights — A Facility Management Playbook with KPIs
| KPI |
Target |
Play |
How to Measure |
| Asset Visibility Score |
100% |
Play 1-2 |
Assets in registry with complete data ÷ total assets |
| Sensor Coverage Rate |
80%+ critical |
Play 2 |
Monitored critical assets ÷ total critical assets |
| Work Order Automation Rate |
60%+ |
Play 3 |
Auto-generated work orders ÷ total work orders |
| Prediction Accuracy |
75%+ |
Play 4 |
Confirmed predictions ÷ total predictions |
| Inspection Compliance |
98%+ |
Play 5 |
Completed on-time inspections ÷ scheduled inspections |
| Unplanned Downtime Reduction |
40-60% |
Overall |
Current incidents ÷ baseline incidents |
Implementation Timeline
1
Foundation Phase
Months 1-3
Plays 1-2
Digital asset registry complete; condition monitoring active on critical equipment
2
Automation Phase
Months 3-5
Play 3
60%+ of condition alerts auto-generating correctly assigned work orders
3
Intelligence Phase
Months 5-8
Plays 4-5
Predictive maintenance active; paperless inspections; audit-ready documentation
4
Optimization Phase
Months 8+
Play 6
Continuous improvement; expanding coverage; industry-leading metrics
ROI Summary — 60,000-Seat Stadium
15-25 unplanned incidents/season
$200-400K emergency repairs/year
55-65% labor efficiency
4+ hour response time
Manual, incomplete documentation
4-8 unplanned incidents/season
$50-100K emergency repairs/year
80-90% labor efficiency
Under 30 minute response time
Automated, audit-ready documentation
9-12 months
Time to Full ROI
40-60%
Downtime Reduction
Ready to run this playbook? Start with Play 1 and build toward predictive intelligence—one play at a time.
Frequently Asked Questions
Q: How long does the full playbook take to implement?
Most stadiums complete all six plays in 9-12 months. Plays 1-2 complete in 3 months with immediate visibility gains. Play 3 adds 4-6 weeks. Play 4 requires 60-90 days of data before AI models work. The phased approach delivers ROI at each stage while building toward full predictive capability.
Q: Which equipment should we prioritize for IoT sensors in Play 2?
Focus on the 20% of assets creating 80% of risk: main chillers, primary air handlers, electrical panels, elevators, and refrigeration. Start with 50-100 sensors on critical equipment, expand in Play 6.
Try free to identify your critical assets.
Q: How does Play 3 automation handle false positives?
Multiple strategies: threshold tuning based on actual equipment behavior, multi-parameter correlation requiring multiple indicators, time-based filtering for brief spikes, and confidence scoring that routes low-confidence alerts to review queues. Play 6 addresses false positive rates through regular threshold adjustment.
Q: Can we run this playbook without replacing our existing BAS?
Yes—CMMS automation complements existing building automation. Your BAS controls equipment while the maintenance layer adds work order management, asset tracking, predictive analytics, and compliance documentation. Standard protocols (BACnet, Modbus, APIs) enable integration with existing systems.
Q: What training do technicians need?
Modest requirements: mobile app for work orders (2-4 hours), QR scanning (1 hour), mobile inspections (2-3 hours), understanding alerts (1-2 hours). Most become proficient within 1-2 weeks. The system provides context directly in work orders, reducing expertise required for routine tasks.