A regional aggregate hauler operating 35 dump trucks out of three quarry sites was hit with $47,000 in overweight fines across a single quarter — every one of them at the same Florida weight enforcement station, every one of them under 2,000 pounds over limit. The drivers had been doing the same load estimation they had done for fifteen years: a glance at the load, an instinct, a guess. After a rainstorm, a "scoop of gravel" weighed measurably more than it had the day before, and instinct is no match for moisture content. The fleet director couldn't justify on-board scales for every truck. He couldn't accept the fines either. AI computer vision load estimation now reads cargo volume, density, and distribution from camera input alone — turning a guess into a measurable estimate accurate enough to keep trucks legal at $0.10 per camera shot rather than $650 per overweight ticket. If your fleet hauls variable-density loads or operates in high-enforcement states, sign up to try Oxmaint free for 30 days or book a demo.
Fleet Overweight Risk — 2026
A Single Mistake Can Erase the Profit From Weeks of Hauling — and Driver Visual Estimation Is the Most Common Mistake
$5K–$16K
Per-violation total cost
Federal penalties + unloading fees + missed delivery + detention losses
$650
NYC BQE WIM fine
Per overweight violation — automated weigh-in-motion enforcement now active in both directions
15%
Of FMCSA inspection violations
Overweight trailers and trucks account for nearly one in seven roadside inspection findings
15–25%
Insurance premium increase
After one overweight violation — two violations trigger 25–40% increases or cancellation
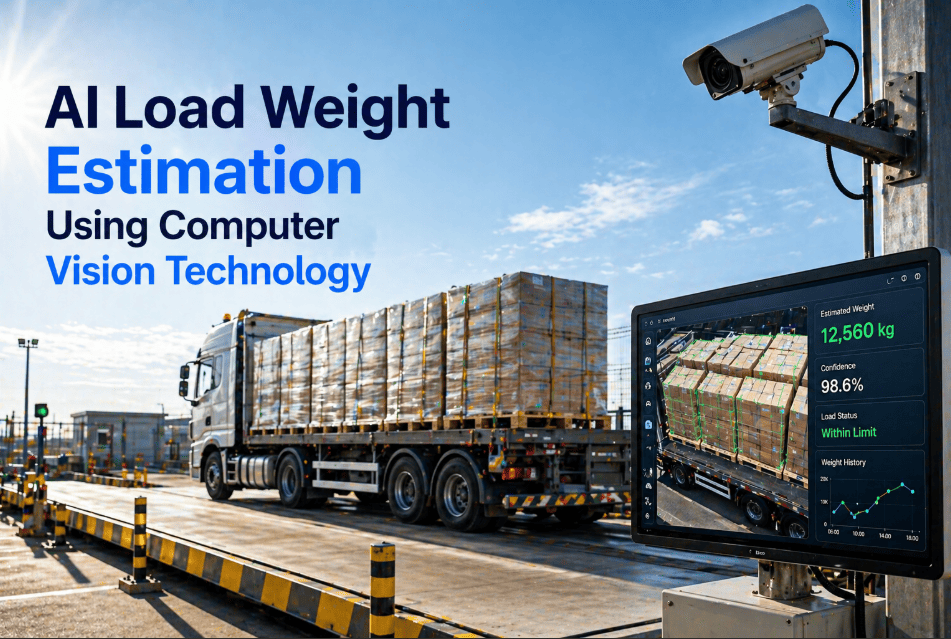
How AI Computer Vision Estimates Load Weight
AI load weight estimation does not measure mass directly. It measures the three observable inputs that, combined with material density data, allow weight to be calculated within meaningful accuracy bands — turning a driver's visual guess into a cross-checked estimate. Book a demo to see the model output on actual fleet loads.
The Six Variable-Density Load Types Where AI Vision Pays for Itself
Visual estimation works adequately for fixed-density loads — packaged goods, palletized freight where the SKU and unit count tell the operator the weight. It fails systematically on variable-density bulk materials, which are exactly where most overweight violations occur.
01
Aggregates & Construction Bulk
Sand, gravel, crushed stone, and base course can vary 15–25% in density between dry and wet conditions. The same scoop of crushed rock weighs measurably more after a rainstorm than the day before. Drivers who estimate by visual volume alone are systematically wrong on wet days.
02
Soil, Mulch & Landscape Materials
Topsoil and screened soil density varies dramatically with moisture content and organic composition. Bulk mulch is light dry and twice as heavy after rain. Landscape supply fleets hauling from yard to job site rarely have certified scale access between the two.
03
Asphalt & Road Surface Materials
Hot-mix asphalt density varies by formulation, temperature, and aggregate type. Loads picked up at the plant arrive at the job site with measurable mass changes from compaction and cooling. AI tracking captures plant pickup weight estimate against destination inspection — variance flagged for review.
04
Scrap Metal & Recyclables
Mixed scrap loads carry wildly different density depending on metal types — aluminum scrap weighs nothing compared to steel — and visual estimation by experienced drivers still produces 20–30% variance. AI vision combined with material classification narrows that to single-digit percentages.
05
Refuse & Waste Hauling
Roll-off containers, refuse trucks, and waste haulers often run loads with no real-time weight feedback. Compaction varies. Material composition varies. Overweight risk is highest at landfill arrival when the scale finally tells the truth — and the fine clock has been running the whole drive.
06
Agricultural & Bulk Commodity
Grain, livestock feed, fertilizer, and bulk agricultural materials carry seasonal moisture variations. The same volume of corn at harvest carries different weight than the same volume after drying. Farm-to-market hauling routes rarely include scale stops between origin and destination.
Visual Estimation Is a Gamble. AI Vision Isn't.
Stop Guessing. Stop Paying Fines. Start Measuring Loads at the Loading Site.
Oxmaint integrates AI computer vision load estimation into the fleet workflow — drivers capture cargo images at the load site, the system returns volumetric and weight estimates with axle distribution, and overweight risk is flagged before the truck rolls.
How Oxmaint Manages AI Vision Load Weight Estimation
01
Vehicle Profile & Bed Calibration
Each truck in the fleet calibrated with its specific bed dimensions, tare weight, axle configuration, and per-axle legal limits per applicable jurisdictions. The vehicle profile is the foundation against which load measurements are scored.
Vehicle-specific compliance baselines per jurisdiction
02
Smartphone Capture at Loading Site
Driver opens the Oxmaint app at the loading site and captures a guided photo sequence — top-down view of the loaded bed, side profile, and material identification. Total time: 60–90 seconds. AI volumetric and density analysis returns weight estimate before the truck leaves the lot.
Pre-departure overweight alerts, not post-fine surprises
03
Per-Axle Distribution Analysis
Total gross weight is one metric. Per-axle weight relative to legal axle limits is the other. The platform calculates load distribution across steering, drive, and trailer axles — flagging cases where total GVW is legal but a single axle exceeds its allowable maximum.
Axle-level compliance, not just gross-weight check
04
Federal Bridge Formula Compliance
Beyond per-axle limits, the platform evaluates load against the Federal Bridge Formula — accounting for axle spacing, number of axles, and the effective weight distribution rules that determine legal interstate transport. State-specific overrides applied per route.
Bridge formula compliance verified pre-departure
05
DOT & CSA Score Documentation
Every load capture logged with timestamp, location, material classification, weight estimate, axle distribution, and driver acknowledgment. The audit trail proves proactive compliance — strengthening CSA score outcomes and supporting insurance underwriter reviews.
Compliance evidence trail for DOT and insurer audits
06
On-Board Scale Integration
For fleets running on-board suspension scales (Air-Weigh, Vulcan, etc.), Oxmaint integrates the scale reading with the AI vision estimate — cross-validation that catches both systems' blind spots. Fleets transitioning from scales to AI vision can run both in parallel during validation.
Cross-validated weight estimates for highest accuracy
State Overweight Penalty Reference — Why AI Vision Matters
| Jurisdiction | Per-violation cost | Maximum fine range | Enforcement mechanism |
|---|
| Federal interstate | $12+ per pound minimum | $5,000–$16,000+ total cost | State enforcement on federal limits |
| California | $100–$500 per 1,000 lbs over | Up to $4,000 per violation | CHP weight stations + WIM sensors |
| Texas (TDLR) | $100–$150 first offense | Up to $10,000 (40,000+ lbs over) | 24/7 weigh stations + WIM |
| Florida | $0.05–$0.10/lb over | Stacks per violation type | WIM-flagged for static scale |
| NYC BQE (city) | $650 per violation | Per-truck per-day potential | Automated WIM + license plate cameras |
| Connecticut | $3/lb over (under 5%) | Escalates significantly above 5% | Weight stations + roadside |
Frequently Asked Questions
How accurate is AI vision load estimation compared to certified scales?+
For volumetric measurement of bulk loads, modern AI vision systems achieve ±3–5% accuracy on total weight estimates — well within the margin needed to keep loads safely under legal limits. Certified scales remain the legal standard for transactional weight (billing customers), but AI vision provides the operational safeguard at the loading site, before the truck reaches a scale, where it matters most.
Book a demo to see accuracy on your specific load types.
Does this require special cameras or just smartphones?+
Modern smartphones with high-resolution cameras and depth sensors are sufficient for the majority of load weight estimation use cases. For drive-through capture infrastructure at loading sites with high throughput, fixed stereo camera systems with structured-light projection deliver higher precision. Most fleets start with smartphone-based capture and graduate to fixed camera infrastructure for high-volume loading sites where the per-truck capture time matters.
What about packaged or palletized freight?+
Packaged freight is generally a different problem — the SKU/case count provides reliable weight data without needing visual estimation. Oxmaint integrates with WMS and TMS systems to consume packing list data directly. AI vision is most valuable for bulk, variable-density, and unmarked loads where SKU lookup is not available.
How does the system handle WIM (Weigh-in-Motion) enforcement?+
Major enforcement zones using automated WIM sensors — NYC BQE, California highways, Texas weigh stations — are mapped in the platform. Routes flagged through these zones generate pre-departure overweight risk alerts based on the load estimate. The driver knows before they roll whether the load will trigger automated enforcement on their route.
What's the typical ROI on fleet AI vision load estimation?+
Three documented return streams: (1) direct fine avoidance — for fleets with multiple overweight violations per quarter, the platform pays for itself in months, (2) insurance premium impact — single overweight violations trigger 15–25% increases that compound across the fleet, (3) operational efficiency — drivers know to stop loading rather than detour to certified scales for verification. Most aggregate, refuse, and bulk-commodity fleets see ROI within 60–90 days.
Fleet AI Vision Load Estimation — Oxmaint
Know the Weight Before You Roll. Pay the Camera Cost. Skip the Fine.
AI computer vision load estimation integrated into the fleet inspection workflow. Volumetric measurement, material density classification, per-axle distribution mapping, and Federal Bridge Formula compliance — all from a 60-second smartphone capture at the loading site. Stop trusting visual estimation. Start measuring.
±3–5%
Accuracy on total weight estimates
3 inputs
Volume + density + distribution
60–90 sec
Capture time per truck pre-departure
60–90 days
Typical ROI achievement timeline