A fleet never contains one kind of asset. A tractor that hauls freight every day, a spare pickup and a service van that keeps a whole crew working all fail differently, yet many maintenance plans treat them the same. A fleet asset criticality matrix scores each vehicle and piece of equipment by safety, operational and financial consequence, so limited technician hours go where downtime hurts most. This checklist-guide shows how to build the matrix, convert scores into maintenance tiers and keep it current inside a fleet maintenance software workflow.
Fleet Asset Criticality Matrix for Maintenance Prioritization
Score every vehicle on safety, uptime and cost impact, sort the fleet into maintenance tiers, and let the ranking decide which work order, inspection and spare part comes first.
Why Fleets Struggle Without a Criticality Ranking
- Every overdue item looks equally urgent, so the loudest driver or dispatcher wins the shop bay.
- Preventive maintenance intervals are copied across the fleet instead of matched to duty cycle and consequence of failure.
- Spare parts are stocked by habit, not by which assets can least afford to wait.
Without a Matrix
- Shop priorities set by whoever calls first
- Same PM interval for every unit in a class
- Safety defects mixed with cosmetic repairs
- Critical units waiting on parts for days
- Budget requests hard to justify
With a Matrix
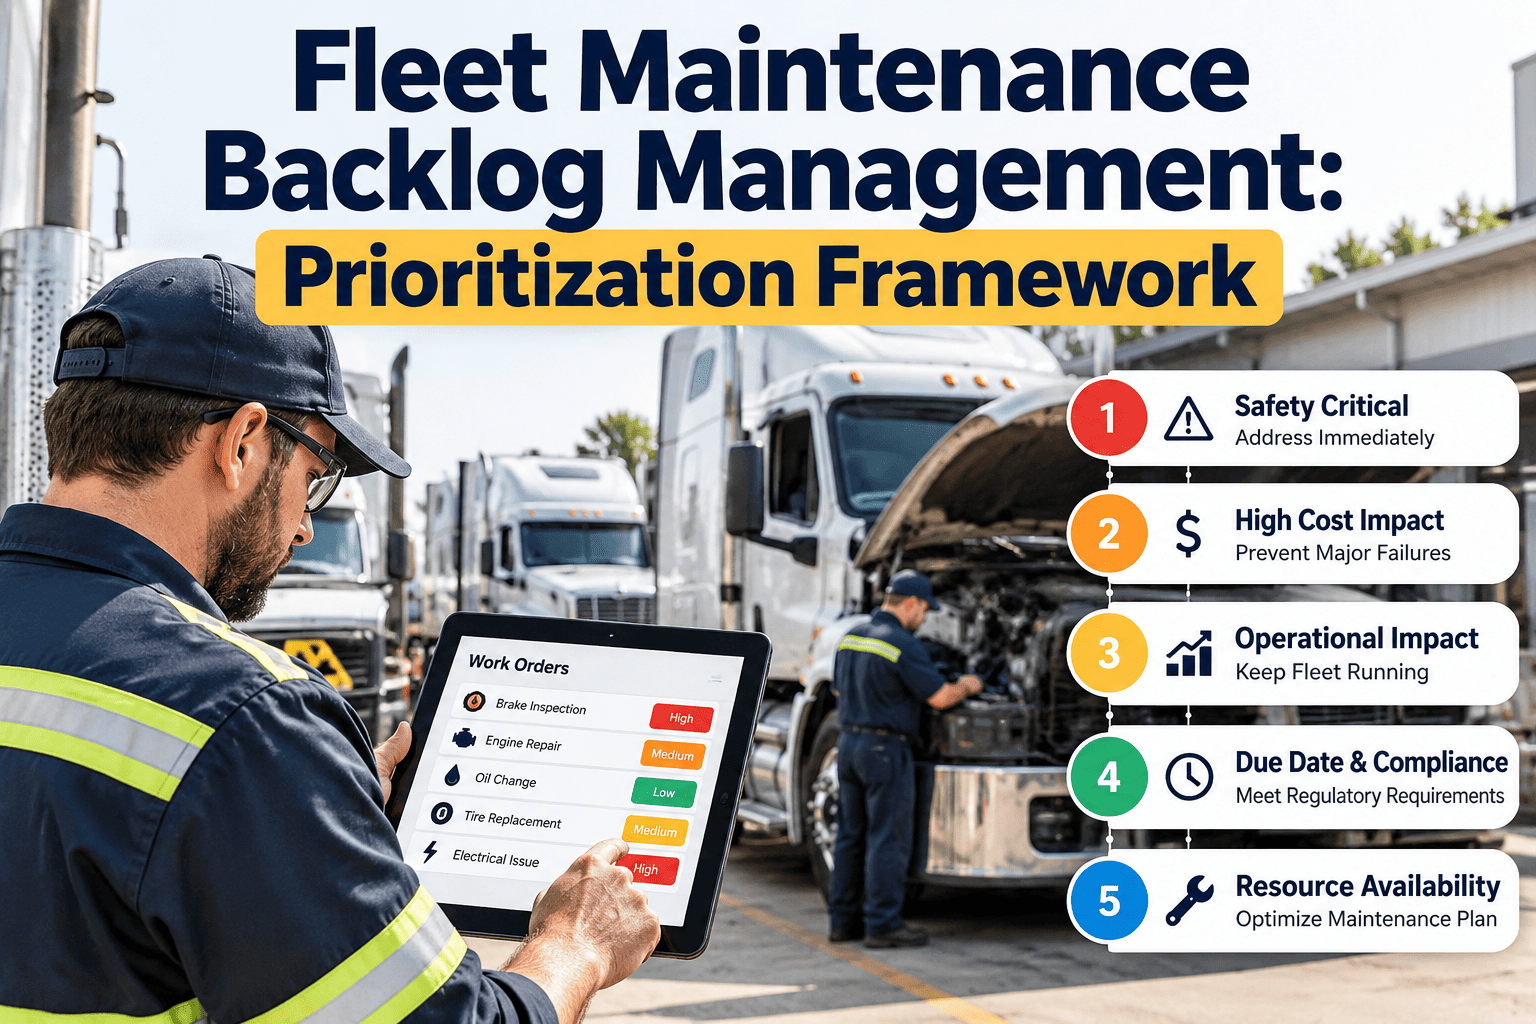
- Work orders ranked by asset tier and defect severity
- PM intervals tuned to duty, age and consequence
- Safety-critical defects escalated automatically
- Spares held first for Tier A units
- Spend backed by scored, documented reasoning
Scoring Factors: What Makes a Fleet Asset Critical
Criticality analysis in asset management weighs the consequence of failure against how likely and how visible that failure is. For fleets, six factors cover most decisions. Score each from 1 (low) to 5 (high) and weight them to fit your operation.
| Factor | Question to Ask | Score 1 Looks Like | Score 5 Looks Like |
|---|---|---|---|
| Safety consequence | Could a failure injure a driver or the public? | Non-road support unit | Loaded heavy vehicle or passenger carrier |
| Operational dependency | What stops if this unit stops? | Idle spare | Single unit serving a fixed contract route |
| Redundancy | Is a ready substitute available? | Several equivalent units on hand | No substitute within a workable time |
| Compliance exposure | Does a missed inspection trigger regulatory action? | Not regulated | Regulated unit under periodic inspection rules |
| Repair complexity | How long and how specialized is a typical repair? | Simple, in-house fix | Specialist work, long parts lead time |
| Financial exposure | What are replacement cost and lost revenue? | Low value, low revenue | High value, revenue-generating daily |
How to Turn Scores Into a Single Number
- Assign weights. Safety usually carries the highest weight; total weights should equal 100 percent.
- Multiply and add. Each factor score times its weight gives a weighted total between 1 and 5.
- Apply a safety override. Any asset scoring 5 on safety is placed in Tier A regardless of total.
- Record the reasoning. Store the scores against the asset so the tier can be defended in an audit or budget review.
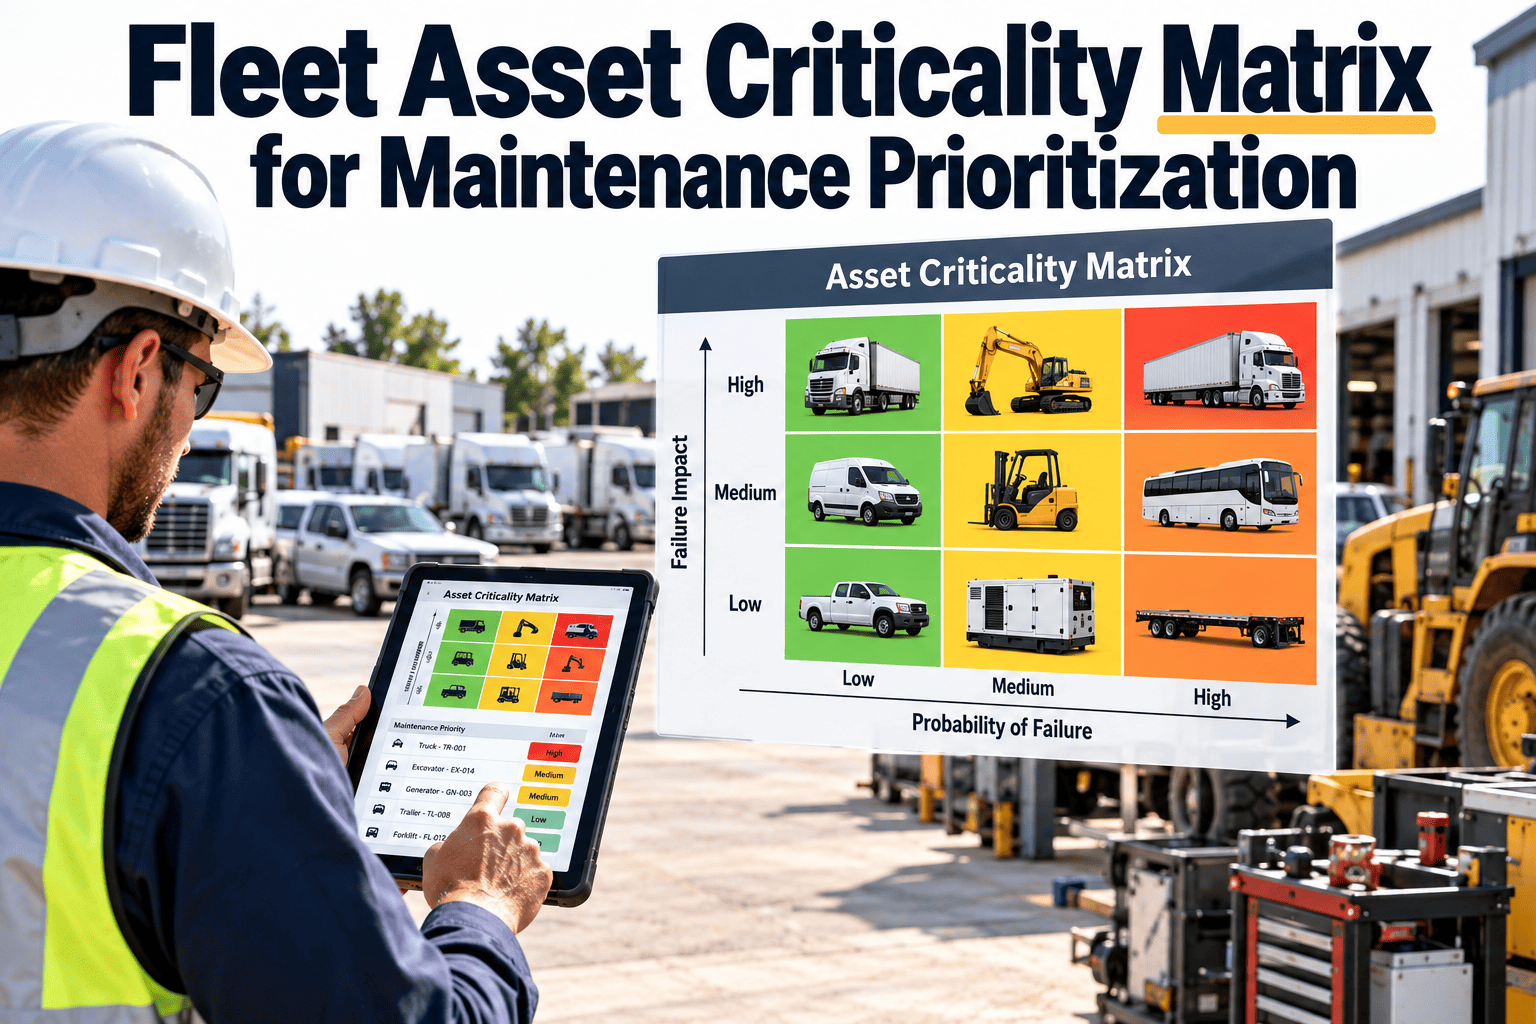
Risk Matrix: Consequence Against Likelihood of Failure
Use consequence from your factor score and likelihood from asset history such as age, mileage, repeat repairs and defect trends. The intersection sets the tier.
Checklist 1: Build the Criticality Matrix
Work through these items once for the whole fleet, then repeat for every new asset added. Tick each box before publishing the tiers.
Data and Scope
- Every vehicle, trailer and powered attachment exists as a record with a unique asset ID
- Asset class, make, model, year, VIN or serial number and current meter reading are complete
- Duty type is recorded: long haul, regional, urban delivery, on-site, standby
- Assigned route, contract or customer dependency is noted where one exists
- Past repair, breakdown and inspection history is attached to each record
Scoring Rules
- Factors and weights agreed by maintenance, operations and safety together
- Scale definitions for 1 to 5 written down so two people score the same unit alike
- Safety override rule documented
- Regulatory obligations for each asset class confirmed against current rules in your jurisdiction
- Tier cut-off scores approved and dated
Publishing the Tiers
- Tier stored as a field on each asset record, not in a separate spreadsheet
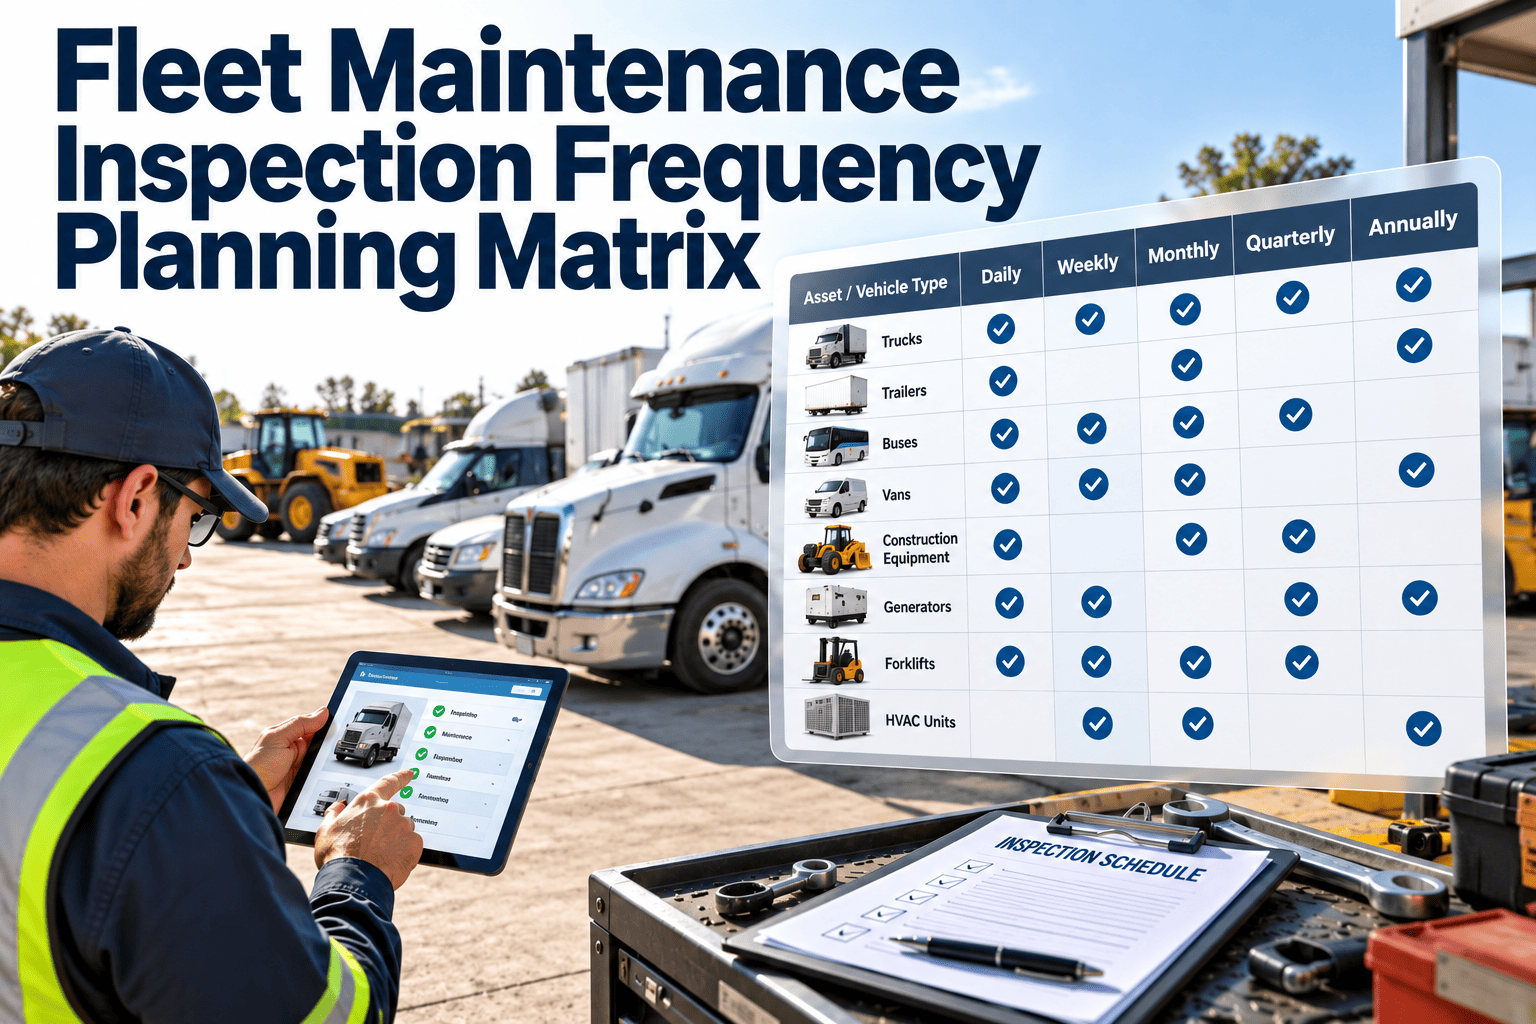
- PM schedules linked to tier and duty, not only to calendar date
- Technicians and dispatchers briefed on what each tier means in practice
- Owner named for the next scheduled review
Put Your Ranking Where Work Orders Are Created
A matrix kept in a spreadsheet gets ignored within a month. Store the tier on the asset record in Oxmaint so every inspection, PM and work order inherits it.
What Each Tier Should Trigger
The figures below are starting points. Always follow OEM schedules, regulatory minimums and your own failure history, then tighten or relax from there.
Tier A: Safety-Critical or Single Point of Failure
- Pre-trip and post-trip inspection defects reviewed the same shift
- PM at the shorter end of OEM guidance, with condition checks between services
- Critical wear parts such as brake components, tires, filters and belts held in stock
- Priority bay access and a named technician for repairs
- Full repair history reviewed at every service
Tier B: Important but Substitutable
- Standard OEM-based PM interval adjusted for duty
- Defects triaged within one working day
- Common consumables shared across the class
- Repeat-repair alerts after a set number of similar work orders
Tier C: Low Consequence or Idle
- Time or meter-based PM at OEM minimum
- Repairs scheduled around Tier A and B demand
- Run-to-failure allowed only where no safety or compliance risk exists
- Candidates for disposal review when repair cost keeps rising
Checklist 2: Triage Incoming Defects and Work Orders
Use this sequence whenever a driver report, inspection failure or breakdown call arrives. It keeps severity and tier working together.
- Confirm the asset ID and read the current tier from the record
- Classify the defect: safety, compliance, reliability or cosmetic
- Check whether the defect places the unit out of service under your inspection rules
- Combine tier and severity to set priority: Tier A safety defects first, cosmetic Tier C items last
- Check parts availability before promising a completion time
- Assign a technician with the right skill and log the expected downtime
- Notify dispatch whether a substitute unit is needed
- Close the order with cause, labor, parts and meter reading
- Flag repeat failures for a root cause review
Checklist 3: Review Cycle for a Living Matrix
- Overdue PMs and open inspection defects listed by tier
- Tier A units with open work orders escalated
- Repeat failures and top cost assets reviewed
- Stock levels checked against Tier A parts lists
- Scores reviewed for route, contract or duty changes
- Tier moves approved and recorded
- Weights and scale definitions re-tested against actual failures
- Replacement and disposal plans updated
KPIs That Show Whether Prioritization Is Working
Track each measure by tier, not only fleet-wide. An average can hide the fact that Tier A is failing.
Checklist 4: Common Mistakes to Avoid
- Scoring once and never revisiting after routes or contracts change
- Letting one department score alone, which skews safety or cost weighting
- Ranking by purchase price instead of consequence of downtime
- Treating Tier C as unmaintained and creating hidden safety exposure
- Skipping the link between tier and PM interval, so the matrix changes nothing
- Overriding tiers verbally without recording why
How Oxmaint Supports Criticality-Based Fleet Maintenance
Oxmaint is a CMMS, so the matrix lives alongside the records it is meant to guide. These are the capabilities most relevant to this workflow.
| Matrix Step | Oxmaint Capability | Practical Result |
|---|---|---|
| Register assets and duty data | Asset management with history | One record per vehicle with meter, repairs and documents |
| Set tier-based service rules | Preventive maintenance scheduling | Intervals by date, meter or both, per asset class |
| Capture defects at the vehicle | Mobile inspections | Driver and technician findings logged with the asset |
| Prioritize repairs | Work orders and corrective maintenance | Priority, assignment and status visible to the shop |
| Keep the right parts on hand | Inventory control | Stock checked against planned and open work |
| Prove compliance | Compliance records | Inspection and service evidence stored per asset |
| Judge the results | Dashboards and reporting | KPIs viewed by tier, class and period |
Frequently Asked Questions
How many tiers should a fleet use?
Three is enough for most fleets. More tiers add scoring effort without changing what technicians actually do.
Does a low tier mean less inspection?
No. Legal inspection duties apply to every regulated unit. Tier changes priority and depth of extra checks, not compliance.
How often should scores be reviewed?
Quarterly, plus whenever a route, contract or vehicle duty changes. You can book a demo to see scheduled reviews in practice.
Can small fleets use a criticality matrix?
Yes. Even ten vehicles benefit from knowing which three cannot be down. A simple 1 to 5 scoring sheet is enough to start.
Where should the tier be stored?
On the asset record inside your CMMS, so work orders and reports use it. You can start with Oxmaint free of spreadsheets.
Rank the Fleet, Then Let the Ranking Drive the Work
Build the matrix once, attach tiers to every asset and see priorities, PMs and parts follow automatically in Oxmaint.