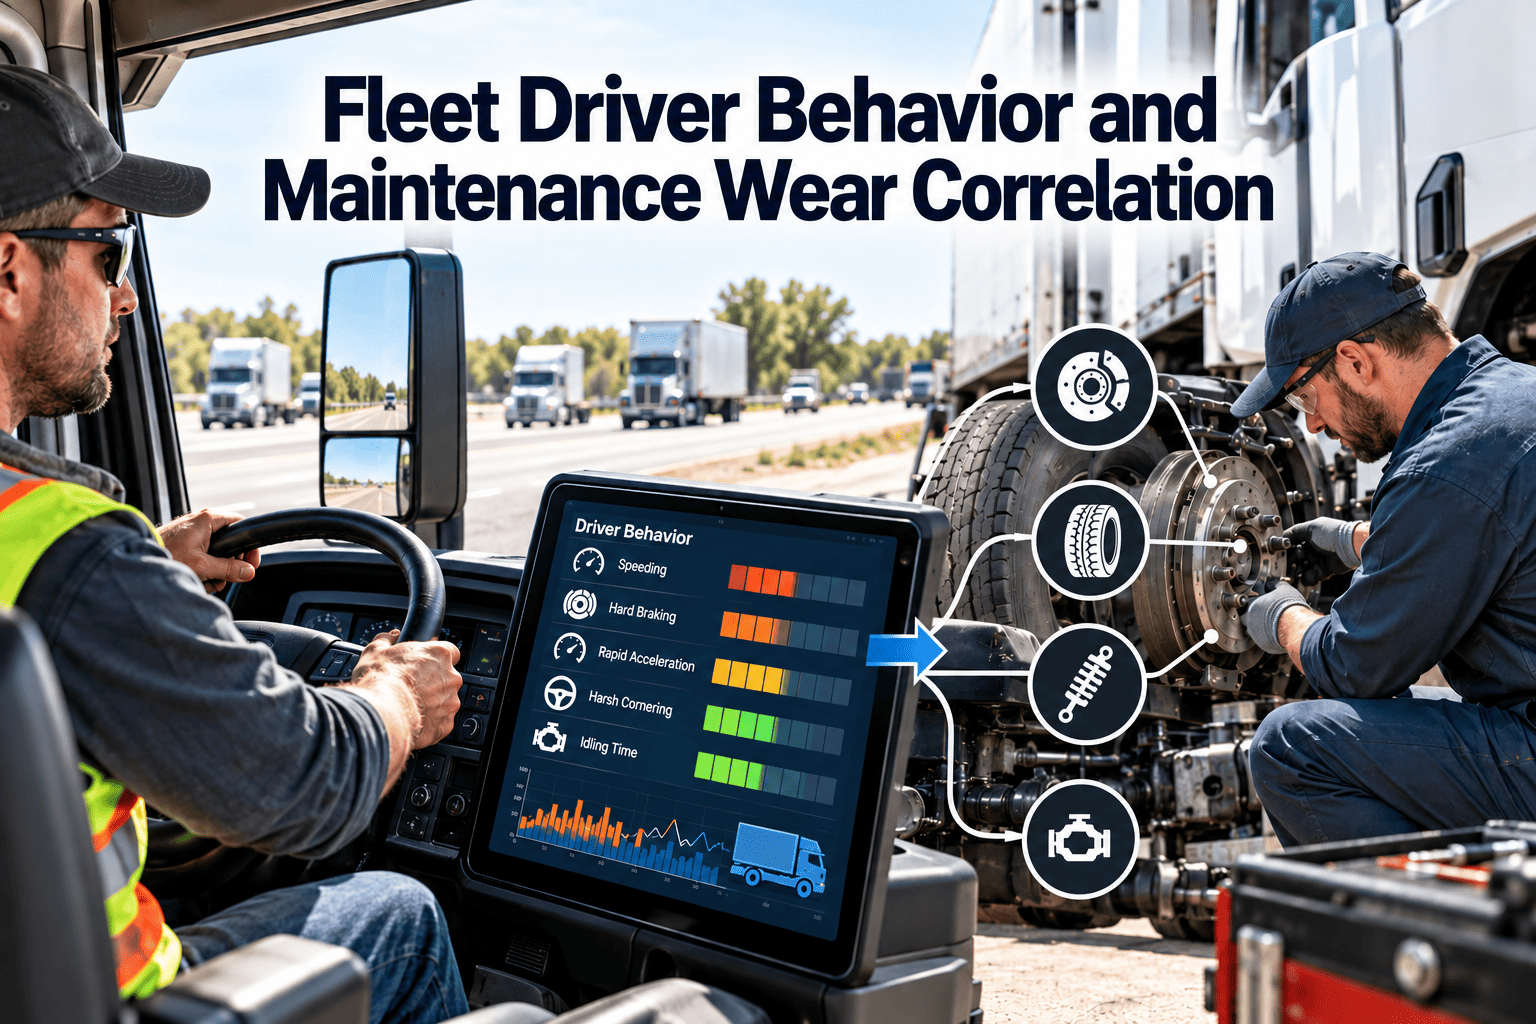
Two identical vehicles on the same route can wear out at very different rates, and the difference often sits behind the steering wheel. Hard braking consumes pads and rotors, aggressive launches stress clutches and drivetrains, and long idling adds engine hours without adding distance. Most fleets see these effects only as unexplained maintenance cost on a few vehicles. Linking driver behavior to component wear turns that cost into something coaching and scheduling can address. Fleets can connect driver reports to maintenance history and begin spotting patterns without a separate analytics project.
Fleet Driver Behavior and Maintenance Wear Correlation
Connect how vehicles are driven with how fast components wear, then use that evidence for coaching, inspection focus, and smarter intervals.
Which Driving Behaviors Leave Marks on Which Components
The links below are widely recognized in fleet maintenance. Your own records will show how strong each one is for your vehicles and duty cycles.
| Behavior | Components Most Affected | Maintenance Signal to Watch |
|---|---|---|
| Harsh braking | Pads, rotors, drums, brake chambers, tires | Short brake replacement intervals compared with similar units |
| Rapid acceleration | Clutch, driveline, transmission, tires, fuel system | Repeated driveline or clutch repairs, high fuel use |
| Excessive idling | Engine, aftertreatment, batteries, oil quality | Engine hours far above mileage-based service needs |
| Hard cornering | Tires, suspension, steering components | Uneven tire wear, bushing and shock failures |
| Speeding and overspeed | Tires, brakes, engine, cooling system | Heat-related failures, early tire replacement |
| Curb and pothole strikes | Wheels, alignment, suspension, body | Recurring alignment and wheel damage entries |
| Poor gear and engine-speed management | Engine, turbo, transmission | Overheating alerts, repeated transmission service |
Why Correlation Is Harder Than It Looks
Treat correlation as a reason to investigate, not as proof of fault.
Building the Evidence: Four Data Sources That Belong Together
See Which Wear Patterns Trace Back to Driving, Not Defects
Bring inspections, work orders, and component history together so coaching conversations start with facts.
How Driver Inspections Become an Early Wear Detector
Drivers notice changes before shop technicians do. A good inspection process captures that knowledge consistently.
Weak Inspection Practice
- Generic "no defects" entries submitted without checking
- Paper forms that reach the shop days later
- No feedback to drivers on what happened to their reports
Strong Inspection Practice
- Mobile checklists with required photos for defects
- Defects convert directly into work orders
- Drivers see resolution, which keeps reporting honest
- Brake feel, pulling, vibration, and unusual noise reported early
- Tire condition and pressure noted at each trip start
- Repeated reports on the same unit flagged for review
Turning Findings Into Action Without Blame
Coaching works best when drivers see the maintenance cost and safety reasoning, not only a score.
Metrics That Connect Driving to Maintenance Cost
Using Wear Data to Improve Preventive Maintenance
- Set brake and tire inspections by actual wear history, not a single fleet-wide interval.
- Move high-idle vehicles to engine-hour-based service triggers.
- Pair new or less experienced drivers with extra early inspections.
- Feed repeated findings back into purchasing and specification decisions.
Oxmaint supports this with preventive maintenance schedules, inspection checklists, work orders, asset history, and reports. To see them on your vehicles, book a working session.
Driver Behavior and Wear Questions
Reading Wear on the Component, Not Only in the Data
Technicians can see the physical evidence of how a vehicle was driven. Give them a way to record it so it can be compared later.
| Component | What Heavy Use Can Look Like | What the Inspection Should Record |
|---|---|---|
| Brake pads and rotors | Glazing, heat spotting, uneven or rapid wear | Remaining thickness, wear pattern, distance since last change |
| Tires | Edge wear, cupping, flat spots, sidewall scuffing | Tread depth by position, pattern type, pressure history |
| Clutch and driveline | Early friction wear, shuddering, universal joint failures | Failure mode, distance at failure, drive type |
| Suspension | Worn bushings, broken springs, shock leakage | Position, condition, route type |
| Engine and aftertreatment | High idle hours, soot loading, frequent regeneration | Idle share, fault codes, regeneration frequency |
| Battery and starting system | Short cycling and repeated starts on idle-heavy units | Test results, replacement date, duty pattern |
A wear note with a photo and a number is more useful in six months than a comment that says worn.
Getting Reliable Behavior Data Before Drawing Conclusions
Behavior events are only as good as their setup. Poor thresholds produce noise that damages trust in the whole program.
- Review data quality monthly, including missing records and device faults.
- Keep a log of changes to thresholds so trends stay comparable.
- Follow local rules on driver data, consent, and retention.
Coaching That Drivers Accept
Drivers resist programs that feel like surveillance. They support programs that show how driving affects safety, costs, and their own working conditions.
Approaches That Backfire
- Ranking drivers publicly with a single score
- Penalizing events without checking vehicle faults
- Sharing data only when something goes wrong
- Ignoring route and load differences
Approaches That Work
- Private conversations using specific events and examples
- Checking maintenance records before raising concerns
- Recognizing improvement as well as flagging problems
- Asking drivers what makes smooth driving difficult on a route
Onboarding and Vehicle Familiarization
- Teach the link between technique and cost, such as how gentle braking extends pad and tire life.
- Explain how to report symptoms early, and confirm that reports lead to action.
- Give drivers a simple way to flag a vehicle that feels different from the last shift.
Idling, Fuel, and Engine Hours
Idling is one of the clearest behaviors to track because it affects both fuel use and engine wear without adding distance.
- Track idle hours separately from drive hours, and set service intervals on engine hours where idling is common.
- Look for engine hour totals that grow faster than mileage on specific units or routes.
- Check whether idling is a work requirement, such as power take-off use, or a habit.
- Review aftertreatment faults on idle-heavy units, which can signal low exhaust temperatures.
- Compare fuel and maintenance cost per vehicle to see the combined effect.
Fuel cost often justifies a coaching program before maintenance cost does, but both belong in the same business case.
Turning Wear Patterns Into Maintenance Plan Changes
Once a pattern is confirmed, change how the vehicle is maintained, not only how it is driven.
| Confirmed Pattern | Maintenance Plan Change | Follow-Up Check |
|---|---|---|
| Short brake life on a unit or route | Shorten brake inspection interval and check wear at every PM | Compare brake life after coaching or route changes |
| High idle share of engine hours | Trigger oil and filter service by engine hours | Review oil analysis or fault frequency |
| Uneven tire wear on one vehicle | Add alignment and suspension checks to the next service | Measure tread depth at the next two inspections |
| Repeated driveline repairs | Inspect clutch, mounts, and joints earlier in the cycle | Track repeat repairs for the same component |
| Frequent curb and wheel damage | Add wheel and steering inspection to driver reports | Compare damage counts by site and shift |
- Record the reason for any interval change so it can be reviewed later.
- Return intervals to normal when the pattern clears, instead of leaving extra tasks in place forever.
- Share changes with the shop so planners can schedule the added work.
Reporting Cadence: Who Needs to See What
Weekly views suit supervisors, monthly views suit planners, and quarterly views suit managers deciding on policy.
A Starter Plan for Fleets With Limited Data
You do not need a full telematics program to begin. Existing work orders and inspection reports already contain useful signals.
- Group vehicles by class and compare brake and tire replacement intervals from work order history.
- Flag the units with the shortest intervals and review who has driven them.
- Add structured fields to driver inspections, such as brake feel and tire condition.
- Check whether the same units also show repeated defect reports.
- Hold one coaching conversation per flagged driver, and compare results after a few months.
- Add telematics later to confirm or refine what the maintenance data already suggests.
Building the Business Case for a Driver-Wear Program
Leadership will ask what the program saves. Frame the answer around cost categories you can already measure.
- Set a baseline for a full season before starting, so changes are not credited to normal variation.
- Track a comparison group of similar vehicles that are not yet in the program.
- Report results honestly, including where behavior changed but cost did not.
- Reinvest early savings into driver recognition or training so participation stays high.
Programs that share both successes and misses earn more trust from drivers and from finance.
Make Wear Patterns Visible, Then Act on Them
Link every driver report, repair, and replaced part to the vehicle so wear trends stop being a mystery.