A fleet FMEA is only useful if it ends in scheduled work instead of a spreadsheet nobody opens again. Failure mode and effects analysis asks three plain questions about every vehicle system: how can it fail, what happens when it does, and how likely are we to catch it first. This template gives fleet maintenance managers a ready structure, scoring scales, a worked example and a session checklist, so every finding becomes an inspection or a preventive task. Teams that already track work orders and asset history can link the results to fleet maintenance software rather than keeping them in a file.
Fleet Failure Mode and Effects Analysis Template
Find the failures that strand vehicles before they happen. Score each failure mode, rank the risks, and convert the top items into preventive maintenance and inspection tasks.
What a fleet FMEA answers that a PM schedule does not
Questions the analysis forces
- Which failure modes would put a driver or the public at risk?
- Which ones cause a roadside breakdown, a missed delivery or a failed inspection?
- Which ones give no warning because nobody checks for them?
- Which current preventive tasks protect against nothing that actually fails?
Good moments to run one
- A new vehicle model or engine platform enters the fleet.
- A repeat failure appears in work order history.
- Vehicles move to a harsher duty cycle, route or climate.
- Warranty ends and the fleet takes over the risk.
- A near miss or roadside inspection finding exposes a gap.
Before the session: preparation checklist
- Pick one vehicle class or system, such as air brakes on tractors, rather than the whole fleet.
- Export 12 to 24 months of work orders and road calls for that class.
- Collect manufacturer service schedules and technical bulletins.
- Pull current PM checklists and driver inspection report defects.
- List parts with long lead times or single suppliers.
- Invite a technician, a driver or dispatcher, a parts lead and a fleet manager.
- Agree the severity, occurrence and detection scales in advance.
- Decide the risk threshold that triggers a mandatory action.
- Book a facilitator who does not own the system being analysed.
- Prepare a blank template with asset class, function and scope filled in.
Scoring scales you can adopt
| Score | Severity of effect | Occurrence in your history | Detection before failure |
|---|---|---|---|
| 1 to 2 | Barely noticed by the driver; no repair needed | Not seen in your records for the class | Always caught by a routine check or sensor |
| 3 to 4 | Minor repair at the next scheduled stop | Seen once or twice in a year | Usually caught during pre-trip or PM |
| 5 to 6 | Unscheduled repair, route delay, reduced capacity | Seen several times a year across the class | Caught only if a technician looks specifically |
| 7 to 8 | Roadside failure, towing, out-of-service violation | Seen monthly or repeating on the same unit | Rarely caught; symptoms appear late |
| 9 to 10 | Safety risk to driver or public, or regulatory breach | Frequent or built into the design | No current control can detect it |
Ranking risk: matrix and the severity override
| Severity / Occurrence | Rare | Occasional | Frequent |
|---|---|---|---|
| High (7 to 10) | Plan control | Act now | Act now |
| Medium (4 to 6) | Monitor | Plan control | Act now |
| Low (1 to 3) | Monitor | Monitor | Plan control |
Why a raw RPN is not enough
- Very different combinations can produce the same product, such as 9 x 2 x 2 and 3 x 3 x 4.
- Set a rule that any severity of 9 or 10 is reviewed regardless of the total.
- Newer FMEA guidance from the automotive industry favours action priority over a single multiplied number.
- Detection should include driver checks, sensors and inspections, not only workshop PMs.
The worksheet: columns and a worked example
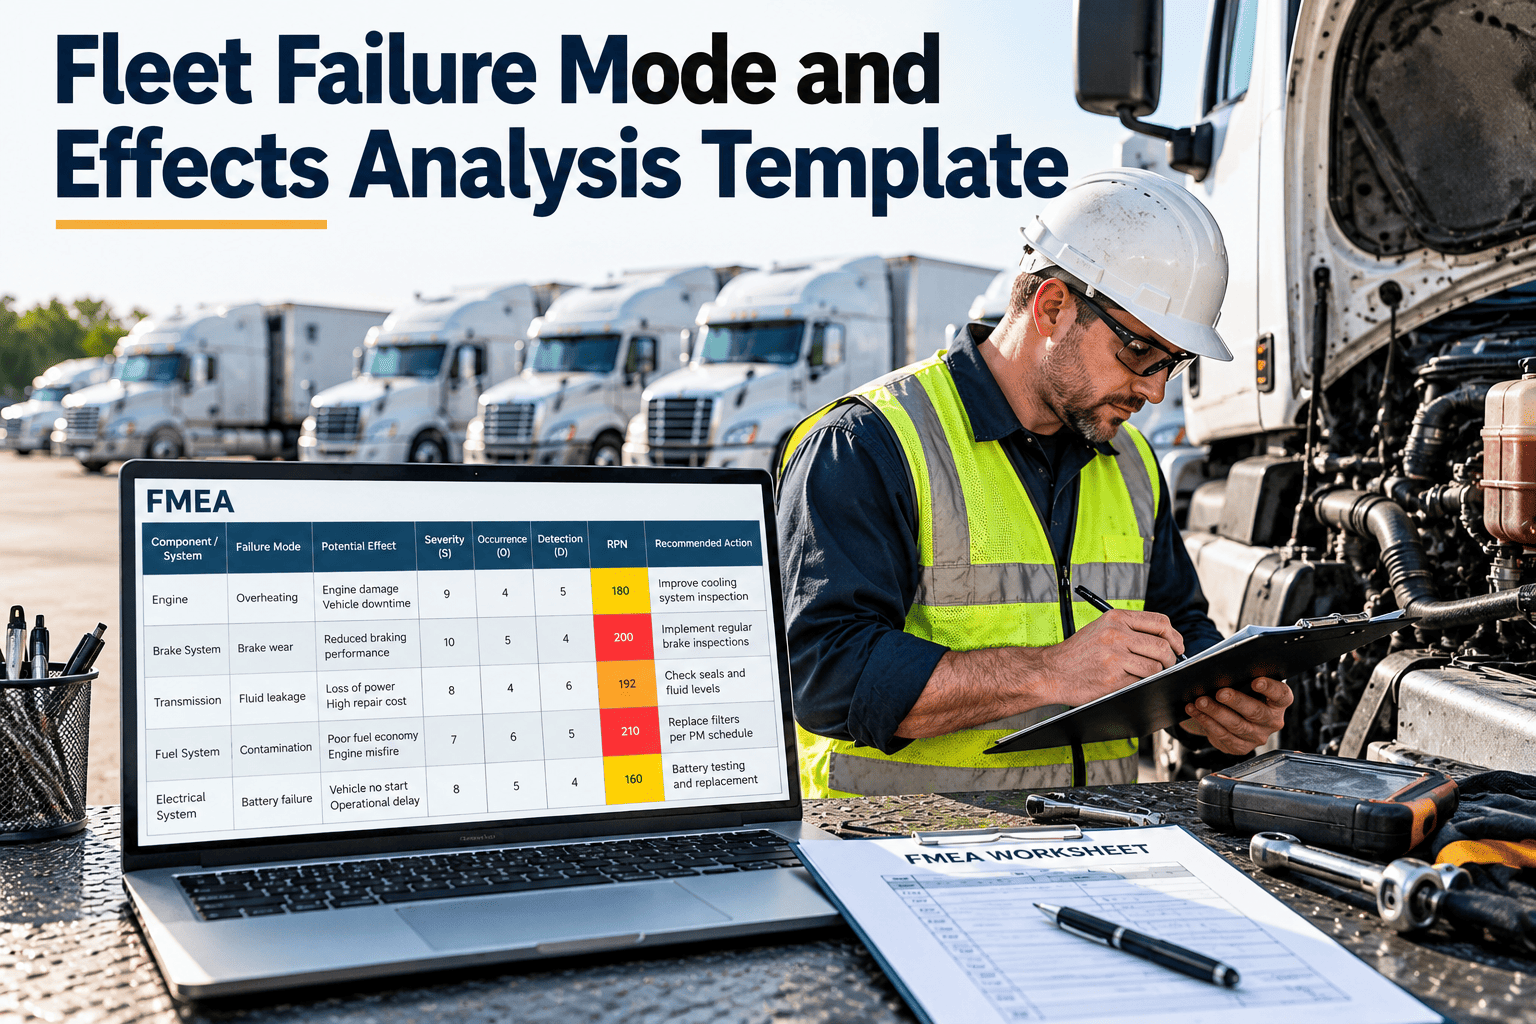
| Asset class | Function | Failure mode | Effect | Cause | Current control | S | O | D | RPN | Action, owner, date |
|---|---|---|---|---|---|---|---|---|---|---|
| Tractor | Hold air pressure | Slow air leak at brake chamber | Reduced braking, out-of-service risk | Worn diaphragm, loose fitting | Pre-trip walkaround only | 9 | 4 | 6 | 216 | Add leak-down test to PM; workshop lead; next PM cycle |
| Van | Start reliably | Battery fails to crank | Missed route, jump-start call | Age, short trips, corroded terminals | Visual check at PM | 5 | 6 | 5 | 150 | Load-test batteries at 3 years; parts lead; this quarter |
| Trailer | Carry load safely | Tire blowout from low pressure | Tow, cargo delay, collision risk | Slow leak unnoticed | Monthly pressure check | 8 | 5 | 4 | 160 | Weekly pressure check logged; yard supervisor; start now |
Starter failure modes by vehicle system
| System | Common failure modes to test | Early warning worth capturing |
|---|---|---|
| Brakes | Pad or lining wear-out, air leaks, contaminated fluid, out-of-adjustment chambers | Stroke measurements, wear readings, pressure drop test results |
| Tires and wheels | Slow leaks, uneven wear, bearing failure, loose wheel fasteners | Pressure logs, tread depth, wheel-end temperature or noise reports |
| Engine and cooling | Coolant loss, thermostat or water pump failure, belt wear, oil starvation | Oil analysis, coolant level trend, fault codes |
| Aftertreatment | Clogged particulate filter, failed sensors, contaminated DEF | Regeneration frequency, derate events, DEF quality checks |
| Electrical | Battery degradation, alternator failure, corroded connectors, lighting faults | Voltage test results, repeat lighting defects on the same unit |
| Suspension and steering | Worn bushings, broken springs, loose steering components | Driver pull or vibration reports, play measured at PM |
| Driveline | Universal joint wear, clutch slip, transmission fluid breakdown | Fluid condition, noise reports, shift complaints |
| Body and trailer | Door and lift gate failure, reefer unit faults, coupling wear | Cycle counts, temperature excursions, coupling inspection notes |
Running the session: step checklist
Define scope
State the vehicle class, the system and the operating conditions covered.
List functions
Describe what each subsystem must do, such as hold pressure or start in cold weather.
Name failure modes
Use work order and road call history first, then brainstorm gaps.
Trace effects and causes
Follow each mode to the driver, the schedule and the safety outcome.
Score and rank
Apply the agreed scales, then sort by risk and apply the severity override.
Assign actions
Give every high-risk item an owner, a date and a specific task.
Re-score after action
Check whether the new control lowered occurrence or improved detection.
Turn risk scores into scheduled work
Oxmaint helps fleet teams attach preventive maintenance tasks, inspections and work orders to each asset, so FMEA actions are tracked to completion.
From analysis to action: before and after
FMEA kept as a document
- Scores sit in a file that is reviewed once a year.
- Actions are written as general intentions without owners.
- PM checklists never change after the workshop.
- Repeat failures keep appearing in work order history.
FMEA connected to maintenance
- Each high-risk mode becomes a PM task or inspection item.
- Work orders carry the failure mode so occurrence stays current.
- Overdue actions appear in a weekly review.
- Re-scoring uses real failure counts, not memory.
Closing the loop in your maintenance system
- Create a PM template for each high-risk failure mode and assign it to the affected asset class.
- Add the new detection step to the driver or technician inspection form.
- Standardise failure codes so work orders can be counted by mode.
- Stock critical spares for failure modes with severity of 8 or higher.
- Record the FMEA action as a work order with an owner and due date.
- Review open actions in the weekly maintenance meeting.
- Track repeat failures on the same asset and escalate to a root cause review.
- Report mode counts and PM completion to management each month.
Is the FMEA finished? Review checklist
- Every failure mode has an effect written in operational terms.
- Occurrence scores cite work order or road call evidence.
- No severity 9 or 10 item is left without an action.
- Every action has a single named owner and a date.
- Detection controls are real checks, not assumptions.
- The next review date is set, and a trigger event list is agreed.
Worked walkthrough: slow air leak on a tractor
From symptom to effect
- Symptom: the driver notices the compressor cycling more often during pre-trip, but no warning light appears.
- Failure mode: gradual loss of air pressure through a worn brake chamber diaphragm or a loose fitting.
- Local effect: longer time to build pressure and a smaller reserve for repeated brake applications.
- System effect: braking performance can fall below safe limits, and an inspector may place the unit out of service.
- Operational effect: a missed delivery, a tow, an idle driver and an unhappy customer.
From control to action
- Current control: a walkaround that finds the leak only when it is audible.
- Better detection: a timed pressure build-up and leak-down test at every PM, with the result recorded.
- Prevention: replace diaphragms at an interval set from your own failure history.
- Ownership: the workshop lead, effective from the next PM cycle.
- Verification: re-score after two PM cycles using the recorded test values.
Describe effects at three levels
| Level | Question to ask | Example: tire failure on a loaded trailer |
|---|---|---|
| Vehicle | What happens to the unit and the parts around the failure? | Casing separation damages the fender, air lines and wiring near the wheel |
| Operation | What happens to the route, the driver and the schedule? | The trip stops, a tow and a mobile tire service are needed, the load is delayed |
| Business | What happens to safety, cost, contracts and compliance? | Collision risk, repair and tow cost, service credits, a possible inspection finding |
Detection controls ranked from weak to strong
| Control type | Typical detection score | Example | Weakness to watch |
|---|---|---|---|
| Automatic monitoring with alerts | Low (good) | Tire pressure monitoring, fault code alerts, telematics warnings | Alerts ignored, sensors out of service, no work order created |
| Scheduled measured test | Low to medium | Battery load test, brake stroke measurement, oil analysis | Results not recorded or not compared with limits |
| Checklist inspection | Medium | Technician visual check against a defined list | Boxes ticked without looking; defects closed without proof |
| Driver observation | Medium to high | Walkaround and reported symptoms | Depends on training and time pressure |
| No control | High (poor) | Failure found only when the vehicle stops | Highest chance of roadside failure |
Common FMEA mistakes in fleet teams
| Mistake | Consequence | Fix |
|---|---|---|
| Scope too broad | Hundreds of rows, no one finishes, nothing is scheduled | One vehicle class and one system per session |
| Opinion-based occurrence scores | Loudest voice wins and the ranking is not defensible | Count work orders and road calls for the class |
| Listing symptoms as failure modes | Actions treat noise rather than the failing function | Describe how the function fails, such as fails to hold pressure |
| Actions without owners | The worksheet looks finished but nothing changes | One owner and one date per high-risk row |
| Ignoring low-occurrence, high-severity items | Rare but dangerous failures are left unmanaged | Apply the severity override for scores of 9 or 10 |
| One-time exercise | Scores drift away from reality as the fleet ages | Set a review date and trigger events |
Turning high-risk rows into intervals and triggers
Time or usage-based tasks
- Use when failure risk rises with age, mileage or engine hours.
- Set the interval from your own failure history, then compare with the manufacturer's guidance.
- Attach the task to the asset class so every new unit inherits it.
- Review the interval when repeat failures appear between PMs.
Condition-based triggers
- Use when a measurable signal appears before failure, such as pressure drop or wear readings.
- Define the threshold that raises a corrective work order.
- Record measured values, not just pass or fail.
- Check trends across units to find the vehicles that need attention first.
Prove the action worked: re-scoring checklist
- Pull failure counts for the mode since the action started.
- Compare the new count with the baseline used for the occurrence score.
- Confirm the new detection step is being performed and recorded.
- Check that the controls are applied to every unit in the class, not only the first.
- Update the occurrence and detection scores and recompute risk.
- Escalate any row that did not improve and review the root cause.
- Retire controls that have no evidence of value.
- Record the review date and the next trigger event.
Frequently asked questions
How often should a fleet review its FMEA?
Review it at least yearly and after any repeat failure, new vehicle type or major duty change. Updating scores from fresh work order history keeps it honest.
Is FMEA the same as root cause analysis?
No. FMEA looks ahead at what could fail, while root cause analysis investigates a failure that already happened. They work best together.
Can small fleets use this template?
Yes. Start with one vehicle class and the five most costly failures. You can book a demo to see how the follow-up tasks are tracked.
Who should attend the FMEA session?
Include a technician, a driver or dispatcher, a parts lead and a fleet manager. Practical knowledge from the workshop floor matters more than rank.
How do FMEA results reach the workshop?
Convert each action into a PM task, inspection item or work order in a system such as Oxmaint, with an owner and a due date.
Put your failure analysis to work
Connect failure modes to preventive maintenance, inspections and work orders so the risks you ranked are the ones your team actually closes.