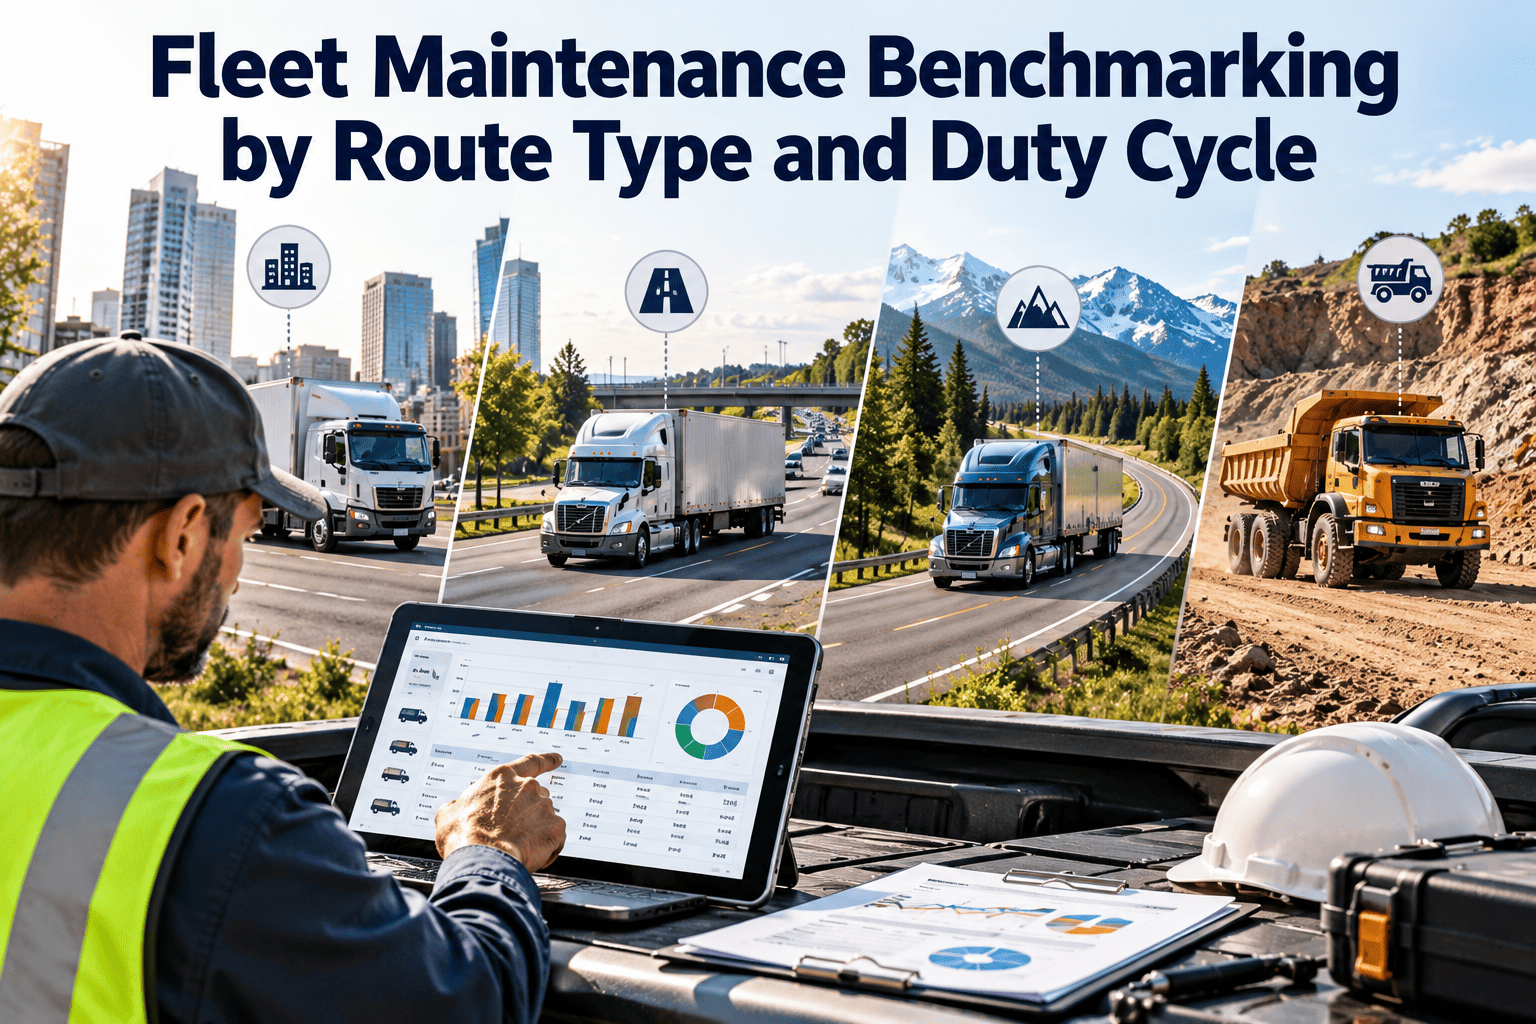
A fleet average for maintenance cost per mile hides more than it reveals. A truck idling through city traffic, a tractor on long-haul highway, and a refuse unit doing stop-and-go lifts all wear differently, yet they often land in one benchmark. Managers then chase the wrong vehicles and miss the real outliers. This article explains how to benchmark fleet maintenance by route type and duty cycle so comparisons are fair, and you can organize the underlying maintenance data in Oxmaint to build them.
Fleet Maintenance Benchmarking by Route Type and Duty Cycle
Compare like with like. Group vehicles by how they are used, then measure cost, downtime, and PM compliance inside each group.
Why One Fleet-Wide Number Misleads
Duty cycle changes which components fail and how fast. Comparing across cycles produces false alarms and false comfort.
Choose the Right Denominator for Each Group
Cost per mile fits some fleets and fails others. Match the unit to how the vehicle works.
| Duty Cycle | Better Usage Unit | Metrics Worth Tracking | Common Distortion |
|---|---|---|---|
| Long-haul | Miles | Cost per mile, tire cost, road calls | Few stops hide slow-growing wear |
| Regional | Miles and days in service | Cost per mile, PM compliance, downtime days | Mixed duty blends two profiles |
| Urban delivery | Days in service or stops | Brake cost, repeat repairs, downtime per vehicle | Low mileage makes cost per mile look inflated |
| Vocational with PTO | Engine hours | Cost per engine hour, fluid analysis, filter life | Odometer misses real work |
| Yard or off-road | Operating hours | Cost per hour, component life, availability | Mileage is near zero or unreliable |
Benchmark Inside Each Duty Cycle, Not Across Them
Oxmaint keeps vehicle history, meters, and work orders together so each group can be measured on its own terms.
Build the Benchmark in Six Moves
A Scorecard Layout You Can Reuse
Fill each row from your own data. Compare each vehicle to its own group baseline and trend, not to a different duty cycle.
| Group | Cost per Usage Unit | PM Compliance | Unplanned Downtime | Repeat Repairs |
|---|---|---|---|---|
| Urban delivery | Your value | Your value | Your value | Your value |
| Regional | Your value | Your value | Your value | Your value |
| Long-haul | Your value | Your value | Your value | Your value |
| Vocational | Your value | Your value | Your value | Your value |
Reading the Results: Outlier or Normal?
Benchmarking Mistakes That Skew Decisions
- Mixing warranty, accident, and routine repair cost in one total.
- Comparing a new vehicle with an aging one without an age band.
- Using odometer readings entered weeks late.
- Ignoring depot differences in labor rates and parts availability.
- Treating the group average as a target instead of a reference.
Turn Benchmarks Into Maintenance Action
How Oxmaint Supports Fleet Benchmarking
Oxmaint maintenance software supplies the consistent records that benchmarking depends on.
Frequently Asked Questions
Is cost per mile always the right metric?
No. Idle-heavy and yard vehicles are better judged by engine or operating hours.
How many groups should we create?
Start with three to five groups with enough vehicles to compare. Book a demo for setup ideas.
Should we use industry benchmarks?
Use them cautiously. Your own group baselines are usually more reliable.
What data do we need first?
Vehicle tags, meter readings, and consistent repair coding. Sign up to start recording them.
How often should we review?
Monthly for outliers and quarterly for baselines and intervals.
Measure Every Vehicle Against Its Real Peers
Group your fleet by duty cycle and track maintenance performance with Oxmaint.