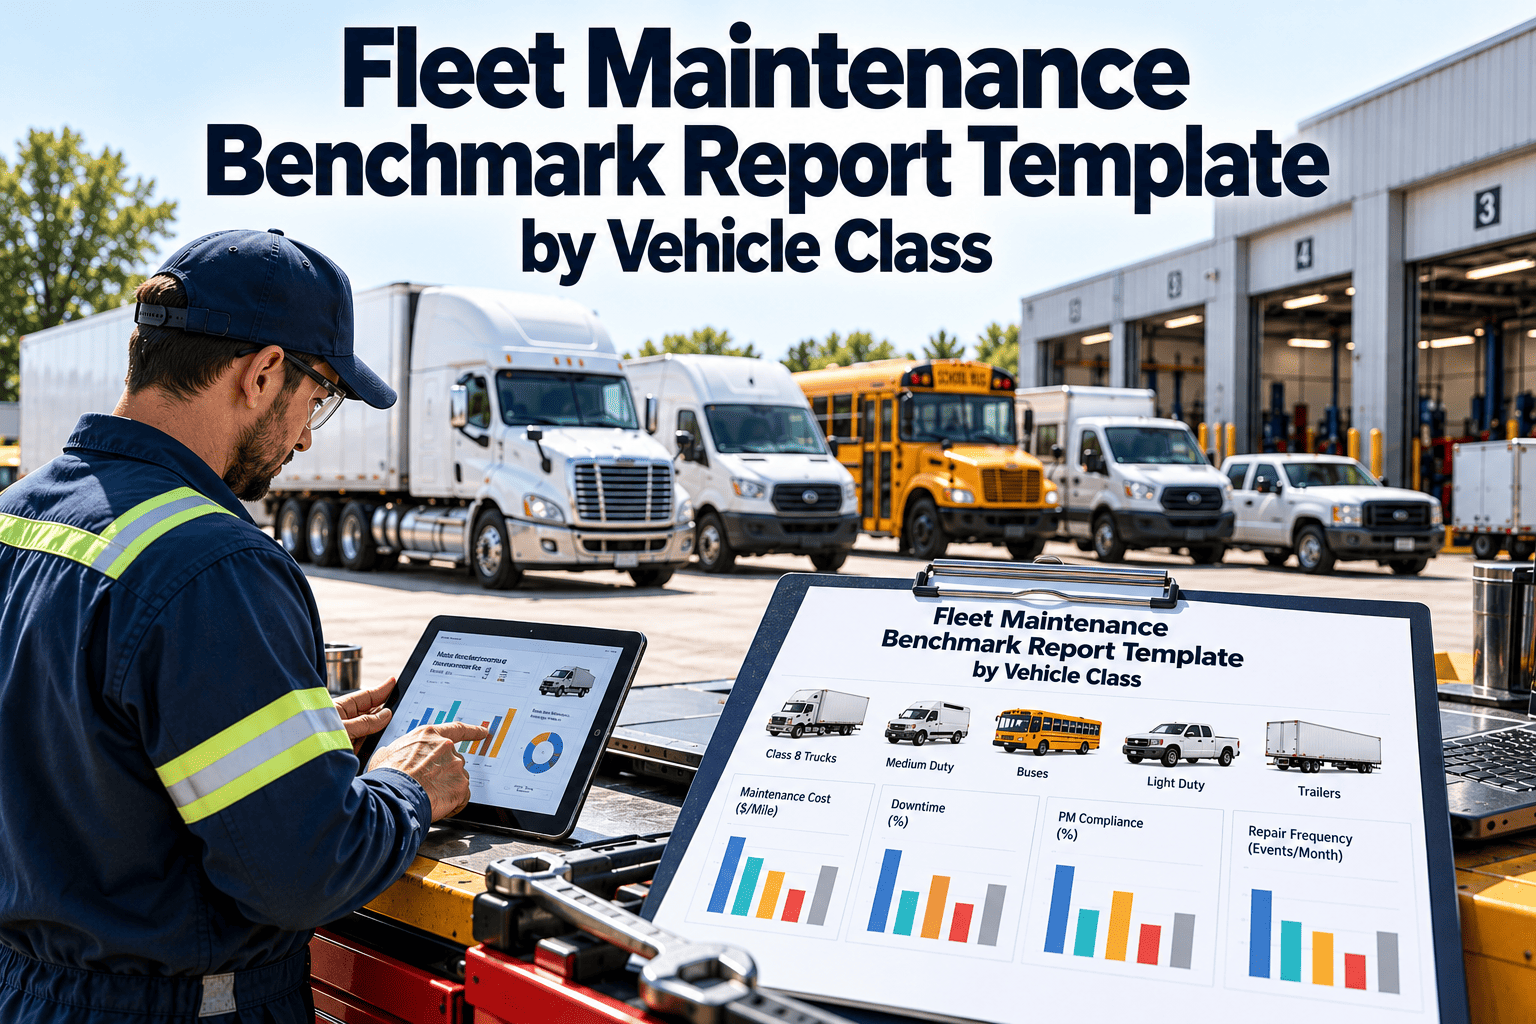
Fleet maintenance cost looks acceptable in a single blended number until a class-by-class view shows where it is really leaking. A light-duty van, a Class 8 tractor, and a refuse truck age differently, fail differently, and should never share one benchmark. This checklist-style report template shows how to group vehicles, normalize the data, and compare results fairly across classes. Teams that already log inspections and repairs in a fleet maintenance management system can populate it directly from work order history.
Fleet Maintenance Benchmark Report Template by Vehicle Class
Stop judging vans, tractors, trailers, and vocational trucks against one average. Build a repeatable benchmark report that compares each vehicle class with its own history, so cost, uptime, and preventive maintenance gaps become visible and actionable.
Why One Fleet Average Hides the Real Problem
A blended cost per mile rewards the wrong vehicles and penalizes the right ones. Benchmarking by vehicle class fixes the comparison.
Blended fleet view
- Light vans pull the average down while heavy tractors hide inside it
- Trailers with no mileage are excluded or distorted
- Hour-based equipment is forced into a per-mile calculation
- A rising cost trend cannot be traced to one class
- Replacement decisions rely on gut feeling
Class-based view
- Each class is compared with its own past performance
- Trailers are measured on defects and inspection currency
- Equipment is measured per engine hour
- Outliers are visible by unit, age band, and duty cycle
- Replacement and PM interval decisions use evidence
Define Vehicle Class Groups Before Collecting Data
Group by gross vehicle weight rating first, then split by duty cycle, because a Class 6 box truck and a Class 6 utility truck rarely behave alike.
| Class group | Typical units | Main maintenance drivers | Cost basis | Watch metric |
|---|---|---|---|---|
| Light duty (Class 1 to 2) | Cars, pickups, vans | Brakes, tires, fluids, short-trip wear | Per mile | PM on time |
| Medium duty (Class 3 to 6) | Step vans, box trucks, service bodies | Stop-start duty, suspension, liftgates, brakes | Per mile | Repeat repair rate |
| Heavy duty (Class 7 to 8) | Day cabs, sleeper tractors | Engine, aftertreatment, tires, air brakes | Per mile | Road call rate |
| Trailers and bodies | Dry van, reefer, flatbed, tanker | Lights, brakes, structure, reefer units | Per unit per month | Defect closure time |
| Vocational | Refuse, dump, utility, buses | PTO, hydraulics, idle hours, body wear | Per hour and per mile | Downtime days |
| Off-road and equipment | Loaders, forklifts, generators | Hydraulics, hours-based service, attachments | Per engine hour | Parts wait time |
Six Steps to Build the Benchmark Report
Lock the class map
Assign every active asset to one class group and one age band. Record the rule so new units are classed the same way.Fix the reporting period
Use full calendar months or rolling twelve months. Short periods exaggerate seasonal repairs and one-off accident work.Pull clean work order data
Labor hours, parts, outside vendor invoices, repair category, and odometer or hour readings must all sit on the work order.Normalize the results
Convert cost into per mile, per hour, or per unit per month. Separate accident damage from wear-related maintenance.Compare against your own baseline
Compare each class with its previous period first. External figures are only useful when duty cycle and definitions match.Assign actions with owners
Each outlier needs a named owner, a due date, and a follow-up check in the next report.Metric Dictionary for the Report
Define every metric in writing once, so the report means the same thing every month and to every reader.
| Metric | Formula | Normalize by | Read together with |
|---|---|---|---|
| Availability | Days available divided by days scheduled | Class and shift pattern | Downtime days |
| PM compliance | PMs done within interval window divided by PMs due | Class and PM type | Unscheduled ratio |
| Maintenance cost | Labor plus parts plus vendor, divided by miles or hours | Class and age band | Repeat repair rate |
| Unscheduled ratio | Unscheduled work orders divided by all work orders | Class | PM compliance |
| Repeat repair rate | Same defect returning within a set window divided by repairs | Repair category | Technician and shop |
| Road call rate | Roadside breakdowns per 100,000 miles | Class and route type | Inspection findings |
| Defect closure time | Hours from reported defect to verified repair | Priority level | Parts wait time |
| Backlog age | Open work orders grouped by days open | Class and priority | Technician capacity |
Report Readiness Checklists
Data readiness
- Every active unit has a class, age band, and status
- Odometer or hour reading captured on each work order
- Repair categories use one shared code list
- Vendor invoices are linked to the unit and work order
- Retired and sold units are marked, not deleted
Normalization
- Accident and vandalism work separated from wear
- Warranty recoveries recorded against the original job
- Tire and fuel costs reported on their own lines
- Low-mileage units reviewed per month, not per mile
- Internal labor rate documented and stable
Review and action
- Top five cost units listed for each class
- Overdue PM units flagged with an owner
- Repeat repairs reviewed for root cause
- Replacement candidates listed with evidence
- Last report actions checked for closure
What the Finished Report Looks Like
Build Class Benchmarks From Live Work Orders
When inspections, repairs, parts, and meter readings sit in one system, the benchmark report becomes an export, not a monthly spreadsheet project.
Data Traps That Distort Class Benchmarks
| Trap | What it distorts | Practical fix |
|---|---|---|
| Missing odometer readings | Cost per mile becomes unreliable | Make the reading a required work order field |
| Mixed repair coding | Category totals cannot be compared | Use one repair code list and retire free-text codes |
| Accident work mixed with wear | Aging units look worse than they are | Tag damage-related jobs separately |
| Vendor invoices booked late | Monthly cost swings between periods | Match invoices to the work order at close-out |
| Spare units in the denominator | Availability looks better than operations feel | Report spare ratio on its own line |
Reading the Results: What to Check First
Class-Specific Checks to Add
Light duty
- Brake and tire wear by driver group
- Idle-heavy units flagged for fluid intervals
Medium duty
- Liftgate and body repairs separated from chassis
- Stop-start brake wear compared by route
Heavy duty
- Aftertreatment events logged by cause
- Tire cost tracked per mile and per position
Trailers
- Annual inspection currency per unit
- Lighting and brake defects per inspection
How Oxmaint Supports the Benchmark Workflow
A benchmark is only as good as the work order behind it. Oxmaint keeps that data structured at the point of work.
Asset register
Every vehicle carries class, age, and meter historyInspections
Mobile checklists capture defects at sourceWork orders
Labor, parts, and vendor cost close out on the jobScheduling
Preventive maintenance triggers by miles, hours, or dateReports
Dashboards group results by class and periodA 90-Day Rollout Plan
Full Benchmark Checklist by Reporting Stage
Work through the stages in order. A stage is complete only when every box in it can be ticked and the evidence is saved with the report.
Stage 1: Setup
- Class groups and age bands approved by fleet and finance
- Reporting period start and end dates fixed
- Metric dictionary reviewed and unchanged since the last report
- Cost basis chosen for each class: mile, hour, or unit-month
- Owner named for each class section of the report
- Data cut-off date agreed with the shop and accounting
Stage 2: Extraction
- All work orders closed within the period are included
- Work orders still open at period end listed separately
- Meter readings checked for impossible jumps or resets
- Duplicate work orders and test entries removed
- Vendor and warranty invoices matched to work orders
- Fuel, tire, and accident costs tagged to their own lines
Stage 3: Calculation
- Miles or hours pulled from the same source for every unit
- Units active for part of the period prorated correctly
- Cost per mile, hour, or unit-month calculated per class
- Class median and range shown, not only the average
- Unscheduled ratio and PM compliance calculated per class
- Earlier figures restated if a definition has changed
Stage 4: Review
- Each class compared with its own last period
- Units far above the class median listed with their history
- Repeat repairs reviewed by component and technician
- Aging backlog reviewed by class and priority
- Spare and out-of-service units reported separately
- Unexplained swings checked against data quality first
Stage 5: Reporting
- Scorecard page shows every class in the same layout
- Definitions and exclusions stated on the report
- Charts use the same scale from period to period
- Actions listed with an owner and a due date
- Data quality notes included where figures are weak
- Report shared with fleet, shop, finance, and operations
Stage 6: Follow-up
- Actions from the last report checked for closure
- PM interval changes raised as controlled changes
- Replacement candidates passed to the planning review
- Recurring data errors fixed at the source
- Next period calendar and cut-off dates shared
- Lessons recorded for the next report cycle
Class Review Checklist: What to Verify for Each Group
Each class has its own failure patterns. These checks make sure the report looks at the right ones, with a named owner and a rhythm.
| Class | Verify | Why it matters | Owner | Frequency |
|---|---|---|---|---|
| Light duty | Brake and tire cost per mile by driver group | Short trips and driving style change wear patterns | Fleet coordinator | Monthly |
| Medium duty | Liftgate and body repairs split from chassis work | Body work can hide the true chassis cost | Shop lead | Monthly |
| Heavy duty tractors | Aftertreatment events and derate codes logged | Repeat faults are a common cause of road calls | Maintenance manager | Monthly |
| Heavy duty tractors | Tire cost per mile by axle position | Alignment and pressure problems show up here first | Tire coordinator | Monthly |
| Trailers | Annual inspection date current for every unit | Expired inspections create compliance exposure | Compliance officer | Monthly |
| Trailers | Brake and lighting defects found per inspection | Shows how well pre-trip checks catch faults | Safety lead | Weekly |
| Vocational | Engine hours and PTO hours recorded | Idle and PTO time cause wear with no miles | Shop lead | Monthly |
| Off-road equipment | Hour-based services done at the right meter reading | Late services raise hydraulic and engine failures | Planner | Weekly |
Mistakes to Rule Out Before You Publish
Most benchmark errors come from data and definitions, not from the maths. Tick each line only after you have looked for the problem.
Data mistakes
- Mileage missing on closed work orders
- Accident repairs counted as wear
- Sold or retired units still in the count
- Different cost codes used by different shops
Calculation mistakes
- Averages used where one unit skews the class
- Cost per mile applied to trailers
- Part-period units counted as a full period
- Warranty credits left out of net cost
Interpretation mistakes
- Low cost read as good without checking road calls
- One bad month read as a trend
- External figures compared without matching definitions
- Aging units judged against new units
Oxmaint Setup Checklist for Class Benchmarking
These configuration points keep the data clean at the point of work, so the report needs less correction at month end.
Records and fields
- Asset records carry class, age band, and location
- Meter reading required on every work order
- Repair categories set up as one shared list
- Parts usage linked to the work order
- Vendor invoices attached at close-out
Workflow and reporting
- Preventive maintenance triggered by miles, hours, or date
- Inspection checklists attached to each vehicle class
- Dashboards grouped by class and reporting period
- Overdue and aging work visible to shop leads
- Role-based access for shop, fleet, and finance
Final Sign-Off Checklist
Complete this before the report leaves the fleet office. Both lists need a named person to confirm.
Content check
- Every class section is present and complete
- Metric definitions match the dictionary
- Each outlier has a recorded explanation or action
- Data quality notes are visible to readers
Approval check
- Fleet manager has reviewed the class results
- Finance has confirmed the cost totals
- Shop leads have seen their outlier units
- Distribution list and archive location confirmed
Frequently Asked Questions
How many vehicle classes should the report use?
Most fleets start with five or six groups. Add a split only when a group shows two clearly different duty cycles.
Can I benchmark trailers without mileage?
Yes. Use cost per unit per month, defect closure time, and inspection currency instead of cost per mile.
Should I compare against other fleets?
Only with matching definitions and duty cycles. Start with your own baseline, then review how others structure reports.
How often should the report run?
Monthly for management review, with a weekly exception view for overdue PMs and aging defects.
Where does the data come from?
Closed work orders, inspections, and meter readings. Start a free trial to see this structure in practice.
Turn Maintenance History Into Class Benchmarks
Give every vehicle class its own baseline and see exactly where cost, downtime, and overdue preventive maintenance are building up.