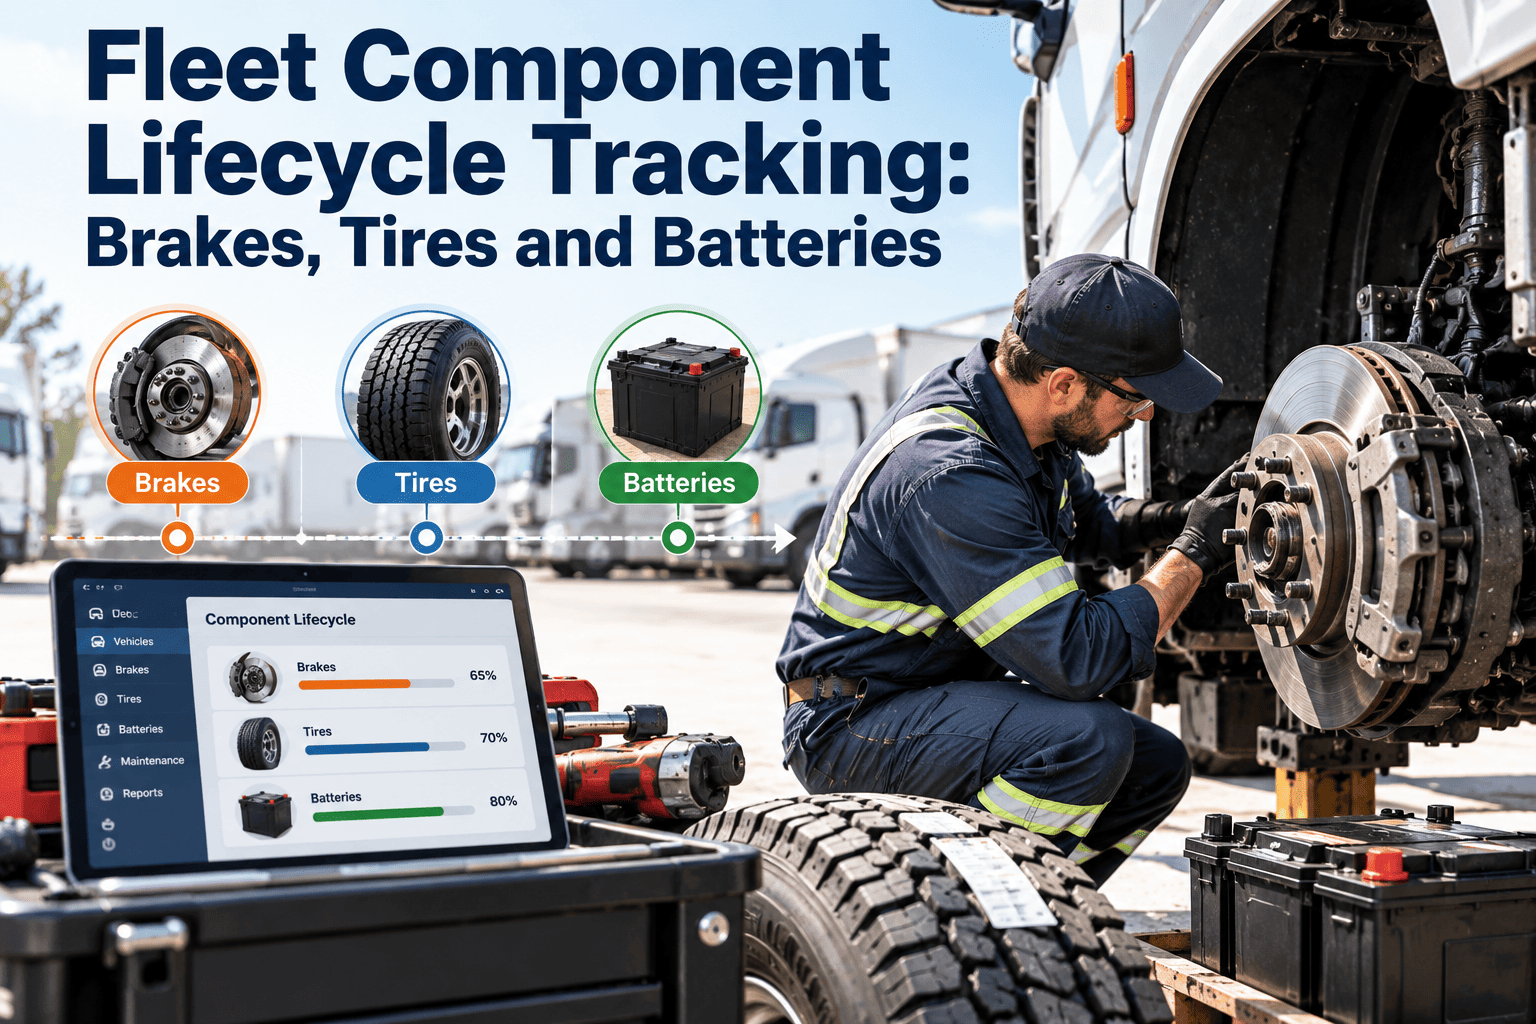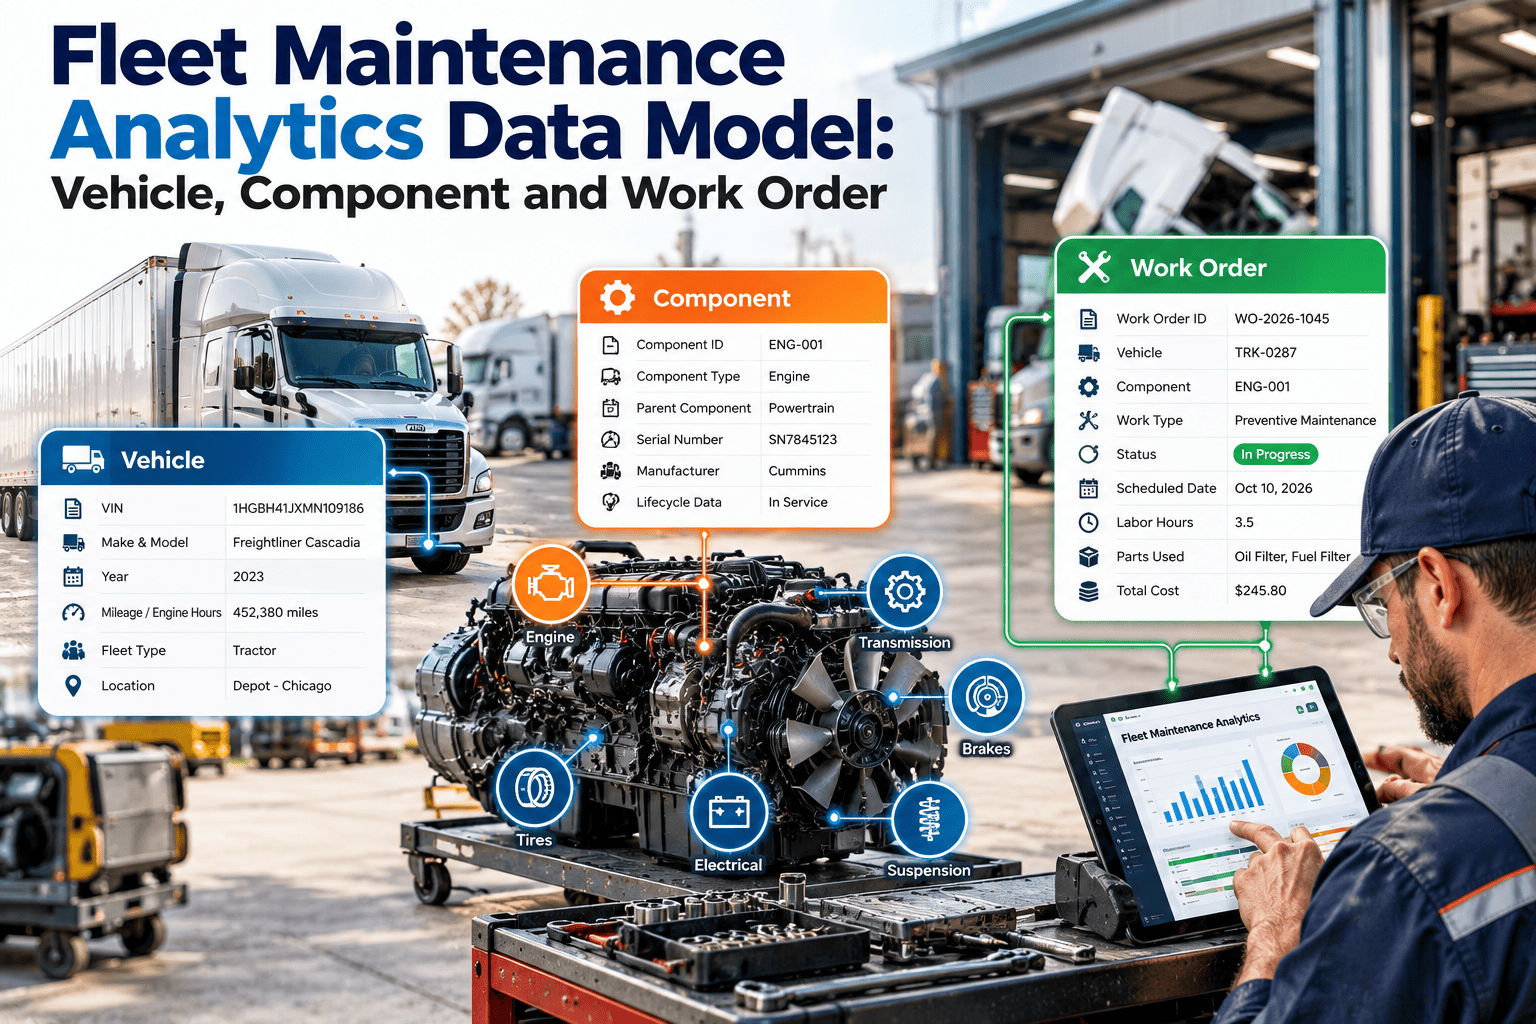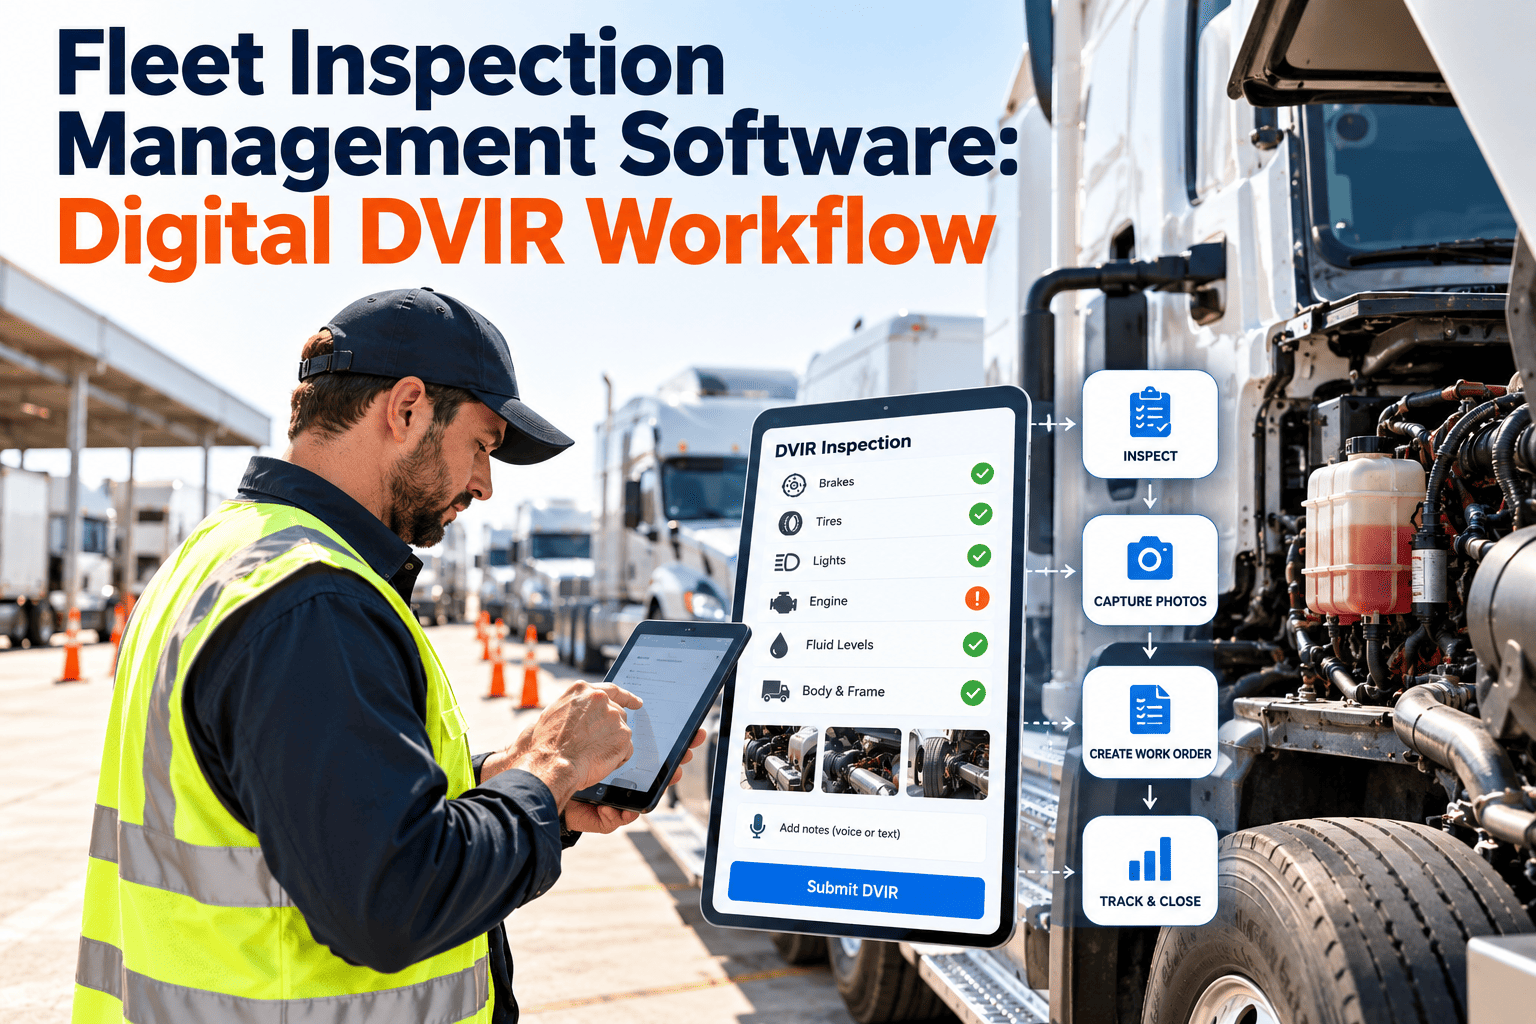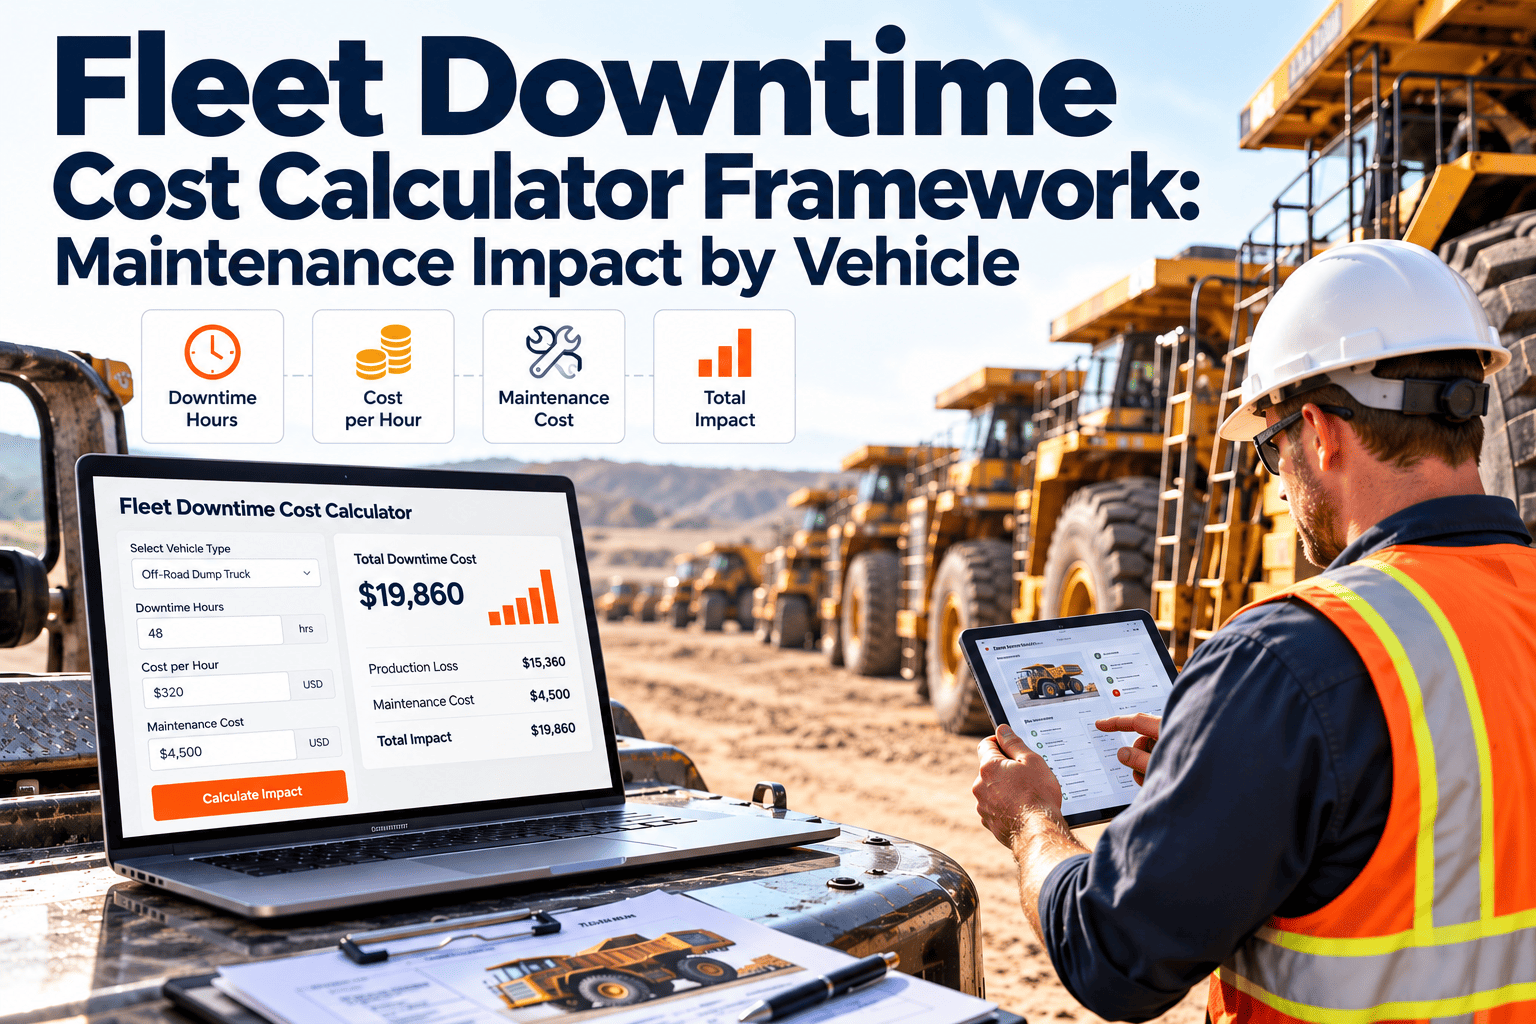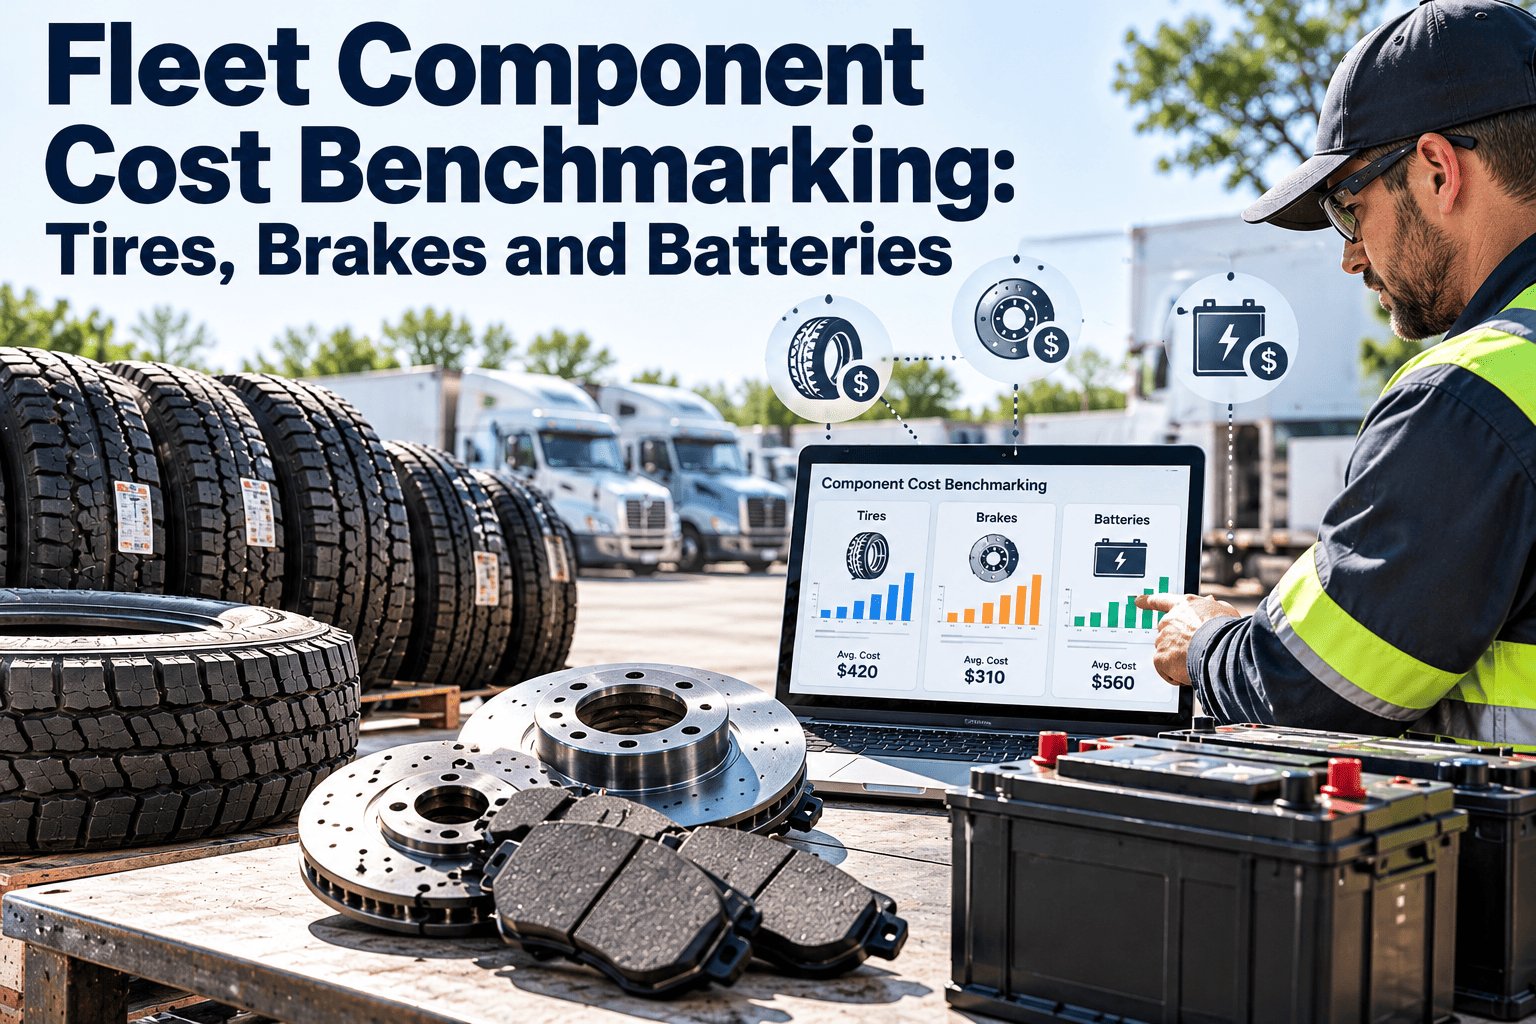
Tires, brakes, and batteries are repeat purchases, so small cost differences multiply fast. Yet many fleets compare themselves with a figure from a report, a supplier, or last year's invoices, without checking that the numbers mean the same thing. Useful benchmarking starts with clean internal data, compares like with like, and turns each gap into a decision. This guide explains how to benchmark component costs, and how Oxmaint fleet maintenance software supplies the work order and parts records the analysis depends on.
Fleet Component Cost Benchmarking: Tires, Brakes and Batteries
Compare against your own history first, then against peers that run the same duty. A benchmark only helps when the cost and the miles behind it are counted the same way.
Why published benchmarks rarely match
Search for a tire cost per mile figure and you will find answers that differ by a factor of two or more. The gap is usually definition, not performance.
- Treat any external figure as a rough reference, and check its definition before comparing.
- Your own trend, normalized for duty and age, is usually the most reliable comparison.
- Record the formula you use so next year's number can be compared with this year's.
Define the cost per mile for each component
Agree what goes into each number before collecting data. Write it down so every depot counts the same items.
| Component | Costs to include | Costs to consider | Divide by |
|---|---|---|---|
| Tires | Purchase, mounting, balancing, repairs, retreads | Road calls, casing credits, scrap loss, fuel effect of poor pressure | Miles on the tires or fleet miles for the period |
| Brakes | Pads, linings, drums, rotors, calipers, labor | Related adjusters, wheel-end work, downtime for the job | Miles for the vehicle or axle group |
| Batteries | Battery, installation labor, disposal | Jump starts, towing, missed dispatch, charging repairs | Months in service or miles, whichever fits the duty |
Formula template
Normalize before you compare
A fair benchmark groups similar units. Without normalization, the vehicle with the hardest duty always looks like the problem.
Group by
- Vehicle class and axle configuration
- Application: long haul, regional, urban, vocational
- Age band and annual mileage
- Terrain, climate, and typical load
Adjust for
- Wheel positions, since steer, drive, and trailer tires wear differently
- Warranty-covered repairs that hide true cost
- One-off events such as accident damage
- Seasonal peaks, such as winter battery failures
Report as
- Cost per mile for wear parts
- Cost per month for batteries and low-mileage units
- Median and spread, not only the average
- Rolling twelve-month trends
Build benchmarks from records you can trust
Capture parts, labor, and mileage on every work order so component costs can be compared by vehicle, position, and supplier.
What to benchmark for each component
Cost per mile is the headline number. These supporting measures explain why it moved.
Tires
- Cost per mile by position
- Tread life by brand and model
- Retread rate and casing yield
- Road calls per million miles
- Pressure check compliance
Brakes
- Cost per mile by axle
- Lining life by vehicle and duty
- Repeat brake repairs on the same unit
- Out-of-service brake findings
- Share of planned versus failure work
Batteries
- Cost per month in service
- Average life by brand and season
- No-start events per month
- Early failures within warranty
- Charging system repairs per unit
From a cost gap to a decision
A gap is only a question. Work through it in order before assigning an action.
- Confirm the dataCheck mileage, part codes, and missing work orders
- Check the peer groupIs this unit compared with similar duty and age?
- Find the driver of costPrice, life, frequency, labor, or downtime
- Look for a root causeAlignment, pressure, charging, installation, or supplier
- Choose the actionChange spec, routine, vendor, or inspection
- Re-measureCompare after a full test period
Cost driver diagnosis
Cost per mile rises for only a few reasons. Naming the reason points to the right owner.
| Driver | Signal in the data | Typical owner | Possible action |
|---|---|---|---|
| Higher unit price | Same life, higher cost per replacement | Purchasing | Re-quote, consolidate suppliers, review specification |
| Shorter life | Cost per replacement flat, interval shorter | Maintenance | Check alignment, pressure, charging, and duty |
| More frequent events | Many small jobs on one unit | Maintenance and operations | Deeper inspection and repeat-defect review |
| High labor share | Hours per job above peers | Shop management | Training, tooling, parts availability, job planning |
| Failure-driven work | Road calls and emergency purchases | Maintenance planning | Condition-based replacement and stocking |
| Poor casing or battery quality | Early rejects and warranty claims | Purchasing and quality | Spec review and supplier feedback |
Comparing brands and suppliers fairly
Price per unit is the least useful supplier comparison. Compare total cost over life.
Price-only comparison
- Looks at purchase cost per unit
- Ignores life, failures, and labor
- Misses warranty handling and delivery delays
- Favors cheap parts that return sooner
Total-cost comparison
- Uses cost per mile or per month in service
- Includes labor, road calls, and downtime
- Tracks early failures by brand and batch
- Supports data-backed supplier reviews
A hypothetical comparison
- Brake set A costs 600 installed and lasts 60,000 miles, giving 0.010 per mile.
- Brake set B costs 400 installed and lasts 35,000 miles, giving about 0.0114 per mile.
- The cheaper set costs more per mile, before counting the extra downtime of earlier replacement.
Setting action bands instead of a single target
One target number invites argument. Bands built from your own spread tell people when to look.
Set band limits from your own distribution, such as quartiles within each peer group, and review them each year.
Data problems that distort component benchmarks
Fix these first. A tidy dataset is worth more than a sophisticated model.
KPIs for the benchmarking program
Measure the quality of the data and the result of the actions, not just the cost.
How Oxmaint supports component cost benchmarking
Oxmaint is maintenance management software. It holds the work order, parts, and labor records that benchmarks rely on, and it does not supply external industry data.
Component cost benchmarking FAQs
What is a good tire cost per mile for a fleet?
It depends on duty, vehicle class, and what the figure includes. Compare your own trend and a similar peer group before using an outside number.
Should I benchmark brakes per mile or per event?
Use cost per mile for comparison, and track events per unit to see how often work occurs. Both views help locate the cause.
How should battery cost be measured?
Cost per month in service often fits better than per mile, because batteries age and fail with time and conditions as well as use.
How long should the benchmarking period be?
A rolling twelve months smooths out large jobs. Book a demo to see how cost history is stored by vehicle.
Where should a fleet start?
Start by cleaning part codes and capturing mileage on every work order. Create an Oxmaint account to set up the records.
Benchmark against facts, not guesses
Give purchasing, maintenance, and finance one clean record of component cost. See how Oxmaint helps you find and fix the gaps.