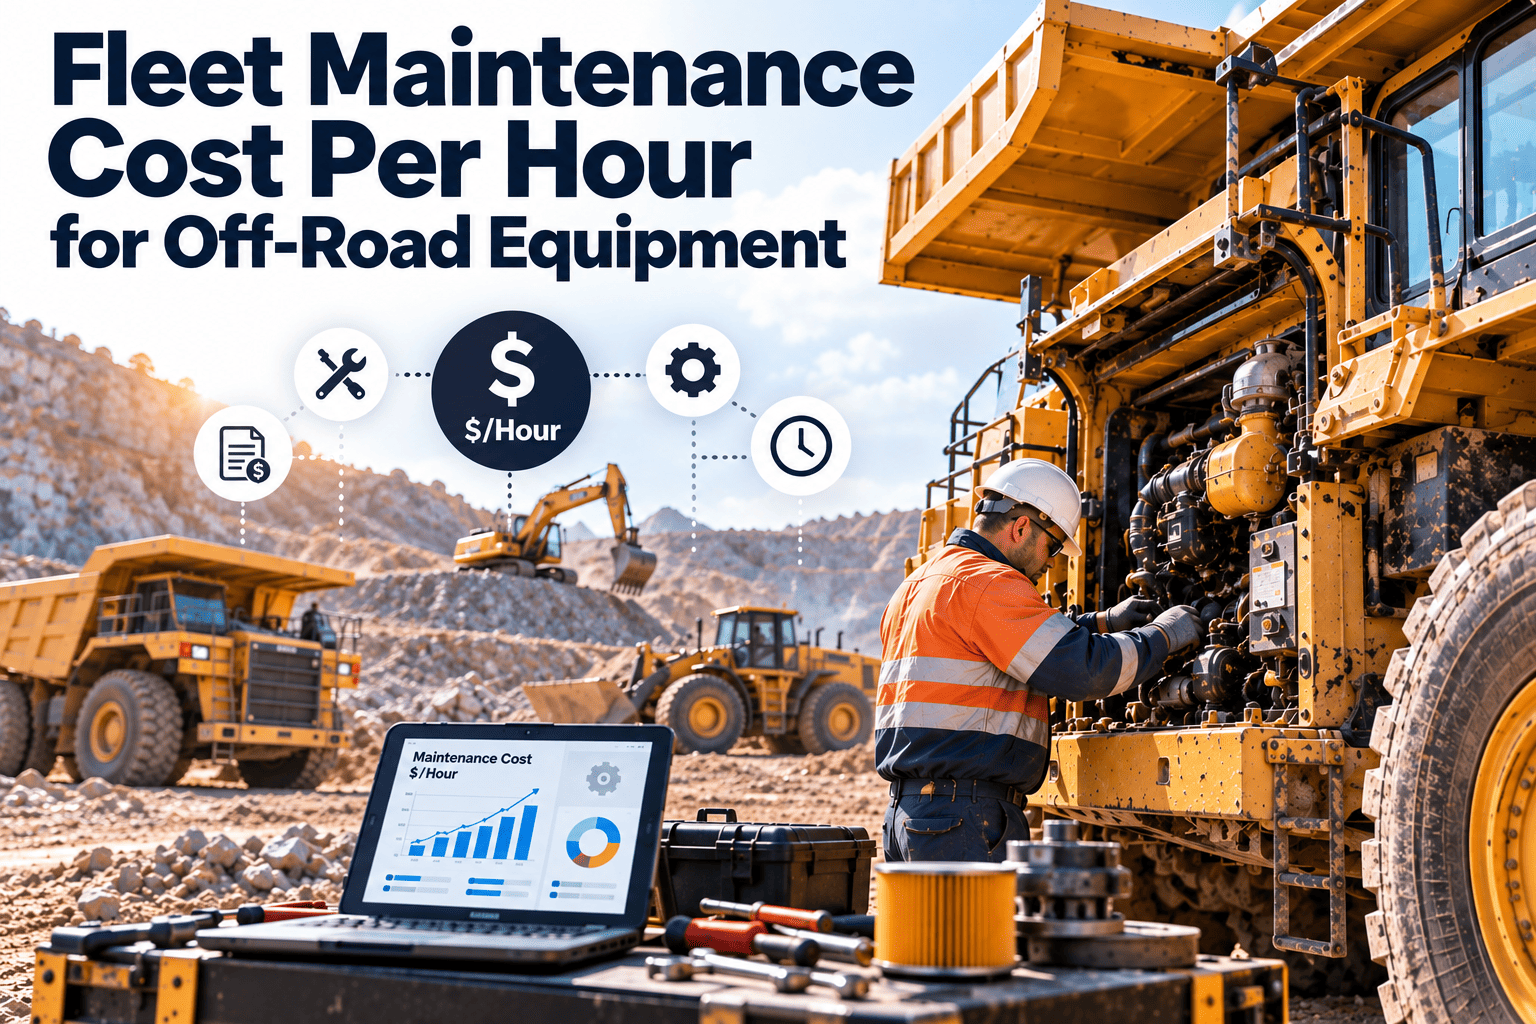
Cost per operating hour is the number that decides whether a piece of off-road equipment is still worth running or ready to be replaced. Unlike a simple repair invoice, it blends labor, parts, downtime, and consumables into a single figure that can be compared across machines, sites, and years. For equipment working in dust, heat, and constant duty cycles, that number tends to run higher than fleets expect — and much of the gap comes from how maintenance is tracked and reported, not from the machine's design or duty cycle itself. A maintenance management system built around asset history is usually the fastest way to find out where the hour is actually going.
What Is Your Off-Road Equipment Actually Costing You Per Hour?
Excavators, loaders, dozers, and other off-road machines don't run on a clean, predictable schedule the way an over-the-road truck does. Duty cycles vary by site and season, which means cost per hour has to be measured continuously against the asset's own meter, not estimated once a year and left alone.
Cost per repair tells you what broke. Cost per hour tells you what to do about it.
A single repair invoice is easy to explain away as a one-off event. Cost per operating hour, tracked over consecutive months, is what actually exposes whether a machine is settling into a normal wear pattern or heading toward a rebuild-or-replace decision.
Why total spend alone misleads
It's also the number that lets you compare dissimilar equipment fairly. A dozer that runs long hours through the season and a loader that sits idle for part of the year don't compare well on total annual maintenance spend — but their cost-per-hour figures sit on the same scale, which is what makes the metric useful across a mixed fleet.
Five components that make up a true cost-per-hour figure
Fleets that only count parts and labor consistently underestimate cost per hour. A complete figure pulls from every line below, tied back to the specific asset.
The same repair costs differently depending on when it happens
The single biggest lever most fleets have over cost per hour isn't the price of parts — it's whether a repair happens on a planned service interval or after a failure stops the machine on site, unplanned and often at the worst possible moment for the job schedule.
| Cost Driver | Scheduled Maintenance | Reactive Repair |
|---|---|---|
| Parts sourcing | Ordered in advance, standard freight | Often expedited, at a freight premium |
| Labor | Planned into the shop schedule | May require overtime or a mobile service call |
| Machine downtime | Scheduled around low-demand periods | Unplanned, often during active site work |
| Collateral damage risk | Caught before secondary components fail | Higher risk of a failure cascading to nearby parts |
| Site impact | Substitute equipment arranged ahead of time | Crew or project delay while a fix is found |
Benchmark against your own fleet before you benchmark against the industry
Published industry averages for cost per hour vary widely by equipment class, age, application, and region, which makes them a rough starting point at best. The more reliable benchmark is the machine's own trend line, tracked consistently over time rather than compared once against a generic figure.
A more useful comparison set
Compare a machine's current cost per hour against its own trailing average, against other units of the same make and model in your fleet, and against its own age bracket. Divergence inside that comparison set is far more actionable than a gap against a generic published figure.
Accounting for site conditions
This is also where site-level context matters. A machine running in soft, abrasive ground will post a structurally higher cost per hour than the same model on a hard-surface site, and that difference is expected — it shouldn't be mistaken for a maintenance problem or a sign that the machine itself is underperforming.
Using cost per hour to time a rebuild or a replacement decision
Cost per hour tends to follow a predictable curve over a machine's life — low during the early service years, gradually rising as components age, then climbing more steeply as the machine approaches a major overhaul point.
Reading the curve
A gradual, steady rise is normal wear. A sharper inflection — several consecutive periods where cost per hour jumps well above the machine's own historical trend — is the signal fleets use to evaluate a rebuild, a component overhaul, or a replacement, rather than continuing to fund repairs one at a time.
Why it's easy to miss
Without asset-level history, that inflection point is easy to miss, because each individual repair still looks reasonable in isolation on its own invoice. It only becomes visible when every repair is tied back to the same asset and reviewed together as a trend over consecutive periods.
See your real cost per hour, by machine, by site.
Track labor, parts, and downtime against every asset's meter hours so cost per hour stops being an estimate.
Conditions that push cost per hour above what a spec sheet would suggest
Off-road equipment operates in conditions a highway vehicle never sees, and each of the factors below adds cost that's easy to miss without asset-level tracking tied to the individual machine rather than a fleet-wide average.
Dust and dirt intrusion accelerates filter, seal, and hydraulic component wear well ahead of the manufacturer's baseline interval.
Remote job sites mean a simple part swap can turn into a half-day delay while parts are sourced and freighted in.
Operator variability — how a machine is loaded, idled, and handled on grade — changes wear rates on the same model significantly.
Undercarriage and ground-engaging tool wear is highly terrain-dependent, and often tracked separately from the rest of the maintenance budget.
Without meter-hour tracking tied to the PM schedule, service intervals are estimated by calendar time instead of actual usage.
Multiple job sites and rotating equipment make it hard to keep a single, complete history on any one machine without a shared system.
Steps that consistently bring cost per hour down
None of these require new equipment — they require better tracking and a tighter link between the meter, the PM schedule, and the parts room, so the number reflects what's actually happening on each machine rather than a fleet-wide estimate.
- 01Schedule PM intervals against actual meter hours, not fixed calendar dates
- 02Track parts and labor cost against each individual asset, not a fleet-wide average
- 03Set minimum stock levels for the highest-wear parts specific to your terrain
- 04Log every unplanned repair separately from planned service, so the ratio is visible
- 05Review cost-per-hour trends by machine on a recurring schedule, not only at year-end
- 06Flag machines whose cost-per-hour trend is rising steadily as candidates for rebuild or replacement review
Why one unplanned failure can distort a whole quarter's number
A single unplanned hydraulic failure or engine issue on a remote site doesn't just add a repair line to the ledger — it tends to bring several secondary costs along with it, and each one lands directly on the cost-per-hour figure reported for that period.
What tends to follow an unplanned failure
Freight on an expedited part, a technician's travel time to a remote site, a rented substitute machine to keep the job moving, and in some cases secondary damage to a connected component if the machine ran a short time before the failure was caught. Any one of these can outweigh the original repair cost.
The payoff of catching it earlier
This is why a fleet with a low reactive-repair share tends to show a flatter, more predictable cost-per-hour curve over time — not necessarily because the machines themselves are more reliable, but because fewer of these expensive secondary costs are being triggered in the first place.
What changes once cost per hour is tied to the asset
The difference isn't the maintenance work itself — it's the visibility to act on a cost trend before it becomes a major failure, and the ability to make a rebuild-or-replace call with data instead of a guess.
Without Asset-Level Tracking
- Cost per hour is estimated once a year from total spend
- PM intervals are based on calendar time, not usage
- Reactive and planned repairs aren't separated in reporting
- Rebuild-or-replace decisions rely on gut feel
With Asset-Level Tracking
- Cost per hour updates continuously as work orders close
- PM triggers off actual meter hours per machine
- Reactive share of total repairs is visible on a dashboard
- Rising cost-per-hour trends flag a machine for review early
Where cost-per-hour figures usually go wrong
Before trusting a cost-per-hour number enough to act on it, it's worth checking whether it's actually complete. A few recurring mistakes quietly understate the figure, sometimes by a wide enough margin to change a rebuild-or-replace decision.
- 1Leaving downtime cost out entirely and counting only parts and labor
- 2Using calendar days instead of actual meter hours as the denominator
- 3Pooling costs across a whole fleet instead of tracking each asset individually
- 4Excluding rental or substitute equipment cost incurred during a repair
- 5Comparing a machine's figure against a generic published average instead of its own trend
Each of these mistakes pushes the reported number below the machine's true cost of ownership, which can make a rebuild-or-replace decision look less urgent than it actually is.
Where to begin tracking this metric correctly
Most of the groundwork is organizational, not technical. Before cost per hour can be trusted as a decision-making number across a mixed fleet, a few basics need to be in place consistently for every single asset.
Once those four habits are in place, cost per hour stops being a once-a-year estimate and becomes a live number that updates as work orders close — which is what makes it useful for day-to-day fleet decisions, not just annual budget reporting after the fact.
Cost per hour for off-road equipment — answered
How is maintenance cost per hour calculated?
Total maintenance cost for an asset — labor, parts, and allocated downtime — divided by its meter hours over the same period, usually tracked monthly or quarterly and reviewed against the machine's own trailing average rather than a one-time estimate.
Should downtime be included in cost per hour, or just repair spend?
A complete figure includes downtime, since an idle machine on a job site carries a real cost even when no parts or labor are involved yet.
What cost-per-hour trend suggests a machine should be rebuilt or replaced?
A steady upward trend over several consecutive periods, rather than a single high month, is the stronger signal — a single spike is often one unplanned repair. Book a Demo to see how trend tracking works.
Why does the same machine model show different cost per hour at different sites?
Terrain, dust exposure, operator habits, and PM compliance all vary by site, and each of them changes wear rates independently of the machine itself — which is why a site-to-site gap in cost per hour isn't automatically a maintenance failure.
How does a CMMS help lower cost per hour?
It ties PM schedules to actual meter hours, tracks parts and labor against each asset, and separates reactive from planned work so the trend is visible before it becomes a major cost — instead of surfacing only once a year during a budget review. Get Started to set this up on your fleet.
Stop estimating cost per hour once a year.
Track labor, parts, downtime, and meter hours against every machine so the number updates itself, continuously and by asset.
Free trial · No credit card