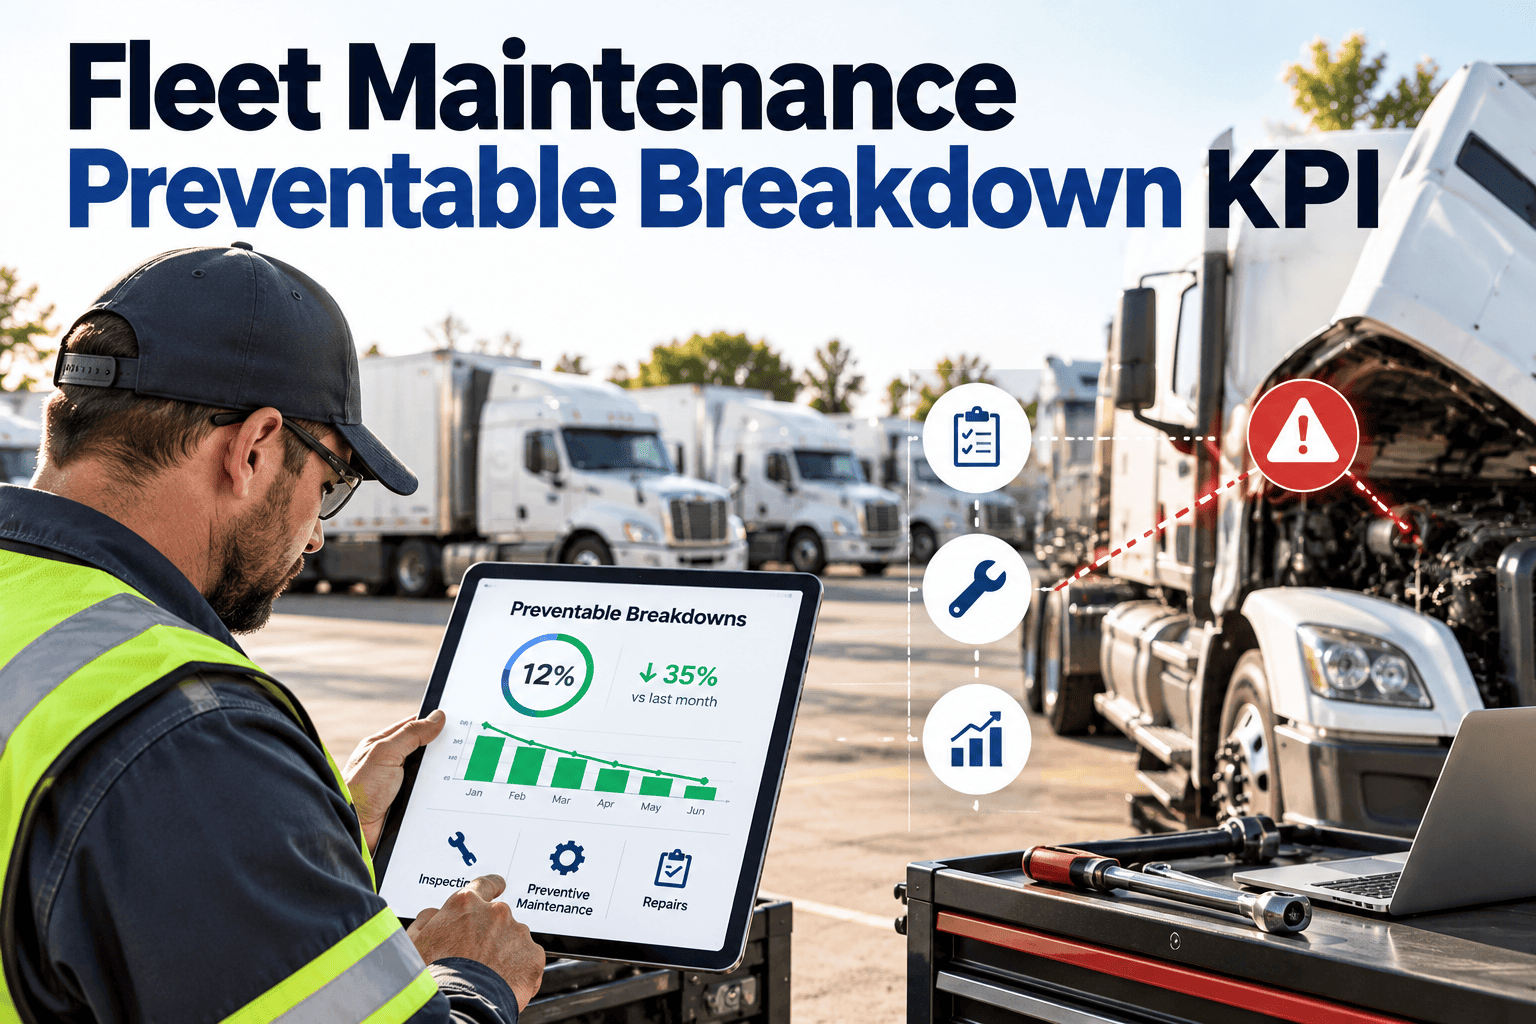
Every fleet records breakdowns, but few separate the ones that were avoidable from the ones nobody could have stopped. The preventable breakdown KPI makes that split visible by tying each roadside failure to the inspection, preventive maintenance task, or deferred repair that could have intercepted it. Without that link, maintenance reviews turn into arguments about bad luck instead of decisions about intervals and workflow. Teams that want this data captured at the work order level can use fleet maintenance software to classify every breakdown consistently.
Fleet Maintenance Preventable Breakdown KPI
Why a Total Breakdown Count Is Not Enough
A fleet that logs more breakdowns this month than last month has a trend line, but it has no direction. The count does not say whether the failures came from worn parts nobody inspected, a PM that slipped past its interval, a defect a driver reported that never reached the shop, or a genuine surprise.
Reporting only the count
- Breakdowns are logged as one number per month
- Cause is typed as free text, if it is recorded at all
- Reviews focus on which vehicle failed
- Corrective action is a one-off repair on that unit
- PM intervals stay the same year after year
Classifying preventable events
- Each breakdown links to a work order and the asset history
- Cause is selected from a fixed code list
- Reviews focus on which process step failed
- Corrective action changes a checklist item, interval, or part
- PM intervals are adjusted on failure evidence
The KPI is not designed to blame technicians or drivers. It is designed to find the step in the maintenance chain where a detectable condition failed to become a completed repair.
What Counts as a Preventable Breakdown
A breakdown is an unplanned event that stops a vehicle from completing its assignment, usually ending in roadside service, a tow, or an emergency swap. It is preventable when the failure traces to a condition that the fleet's inspections, PM program, driver reporting, or repair queue could reasonably have found and corrected beforehand.
Usually non-preventable when documented
- Collision damage and third-party contact
- Road debris punctures with no prior tire condition issues
- Vandalism or theft damage
- Contaminated fuel from a supplier, with evidence
- Component failures with no prior warning signs or fault history
Gray areas that need a written policy
- Operator misuse or ignored dashboard warnings
- Wear-out failures that happen between PM intervals
- Tire failures where pressure checks were not recorded
- Failures right after a repair by a vendor
- Parts that fail early under correct installation
A Cause Code List That Fleets Can Actually Use
The KPI is only as good as the codes behind it. Keep the list short enough that technicians pick the right one quickly, and specific enough that each code points to an owner and a fix.
| Cause Code | What It Means | Example | Preventive Lever | Typical Owner |
|---|---|---|---|---|
| Missed PM | Scheduled service was overdue or skipped before the failure | Belt or hose failure on a unit past its service interval | PM scheduling with due alerts and escalation | Maintenance planner |
| Inspection miss | Condition existed at the last inspection but was not recorded | Visible fluid leak or worn component not noted | Structured checklists with required fields and photos | Technician |
| Defect not actioned | Driver reported the defect but no work order followed | Brake complaint on a vehicle inspection report with no repair | Automatic defect-to-work-order conversion | Shop supervisor |
| Deferred repair | A known repair was postponed beyond its safe window | Cracked mount left in service until it failed | Deferral approval with a due date and re-check | Fleet manager |
| Repeat failure | The same fault returned soon after a repair | Intermittent electrical fault that returns within weeks | Repeat flag in asset history and root cause review | Lead technician |
| Parts or workmanship | Wrong, low-quality, or incorrectly installed part | Incorrect part fitted and failing prematurely | Part specifications, warranty and return tracking | Parts manager |
| Interval mismatch | PM interval was too long for the real duty cycle | Severe-service unit running on a standard interval | Interval review by duty cycle and failure history | Maintenance manager |
| Operator misuse | Abuse or misuse is documented | Overheating after repeated ignored warning lamps | Driver coaching and fault alerts to dispatch | Operations supervisor |
| External event | Outside the maintenance process | Debris strike or collision | Evidence on file, then excluded from the KPI | Maintenance manager |
Five Ways to Calculate and Segment the KPI
Segment by vehicle class, age, duty cycle, and depot before comparing numbers. A vocational truck and a highway tractor should not share a benchmark. Small fleets should use rolling 90-day or 12-month windows so one event does not swing the rate.
See Which Step Is Causing Your Breakdowns
How a Preventable Breakdown Develops
Most failures begin as a detectable condition long before the vehicle stops. Reliability engineers call the period between the first detectable sign and functional failure the P-F interval. The wider that window, the more chances a fleet has to intervene.
Every handoff in this chain is a place where the event can become preventable. The KPI is really a measurement of those handoffs, which is why it improves when workflow improves and not only when parts get replaced earlier.
What Every Breakdown Record Should Capture
Event details
- Date, time, and location of the stop
- Odometer reading or engine hours
- Vehicle, driver, and route or assignment
- Symptom reported and active fault codes
- Response type: roadside repair, tow, or vehicle swap
- Downtime start and end
- Cost of response, including labor, parts, towing, and substitute vehicle
Classification details
- Failed system and component
- Linked PM and its last completion date
- Last inspection result for that system
- Open defects or work orders at the time of failure
- Cause code and preventable decision
- Reviewer name and review date
- Corrective action and whether it was a repeat
If the record cannot show what was open on the unit when it failed, the review will rely on memory. Linking records is what turns a breakdown note into evidence.
A Review Cadence That Produces Changes
Leading Indicators That Predict the KPI
Preventable breakdown rate is a lagging measure. These indicators move earlier and tell you where the next failure is likely to come from.
| Leading Indicator | What It Warns About | Related Cause Code |
|---|---|---|
| PM compliance rate | Services are being completed late or not at all | Missed PM |
| Overdue PM count and age | Backlog is growing in specific depots or vehicle classes | Missed PM, Interval mismatch |
| Inspection completion rate | Pre-trip and post-trip reports are not being filed consistently | Inspection miss |
| Defect age | Reported defects are sitting without action | Defect not actioned, Deferred repair |
| Time from defect to work order | Reporting is not connected to scheduling | Defect not actioned |
| Repeat repair rate | Repairs are being closed without fixing the root cause | Repeat failure |
How Oxmaint Supports Preventable Breakdown Tracking
The KPI depends on records that connect. Oxmaint maintenance management software brings the relevant records into one workflow so classification is based on evidence.
Setting Targets and Reading the Trend
A target only works after a baseline exists. Run the classification process for at least one full quarter before publishing a goal, then set targets by vehicle class instead of one number for the whole fleet.
Expect the rate to rise at first in some fleets. Better recording often reveals preventable events that used to be logged as bad luck, and that is a sign the data is improving.
Connecting the KPI to Cost, Uptime, and Compliance
Cost
Uptime
Compliance
Common Mistakes When Starting the KPI
- Using a cause list with too many codes, so technicians pick the first one that fits.
- Letting the person who did the repair make the final preventable decision alone.
- Counting only roadside failures and ignoring tows and swaps for the same reasons.
- Comparing depots without adjusting for vehicle class, age, or duty cycle.
- Setting a zero target, which encourages reclassifying events as external.
- Reviewing the number monthly but never changing a checklist or interval.
- Skipping evidence, so the same breakdown is classified differently each time.