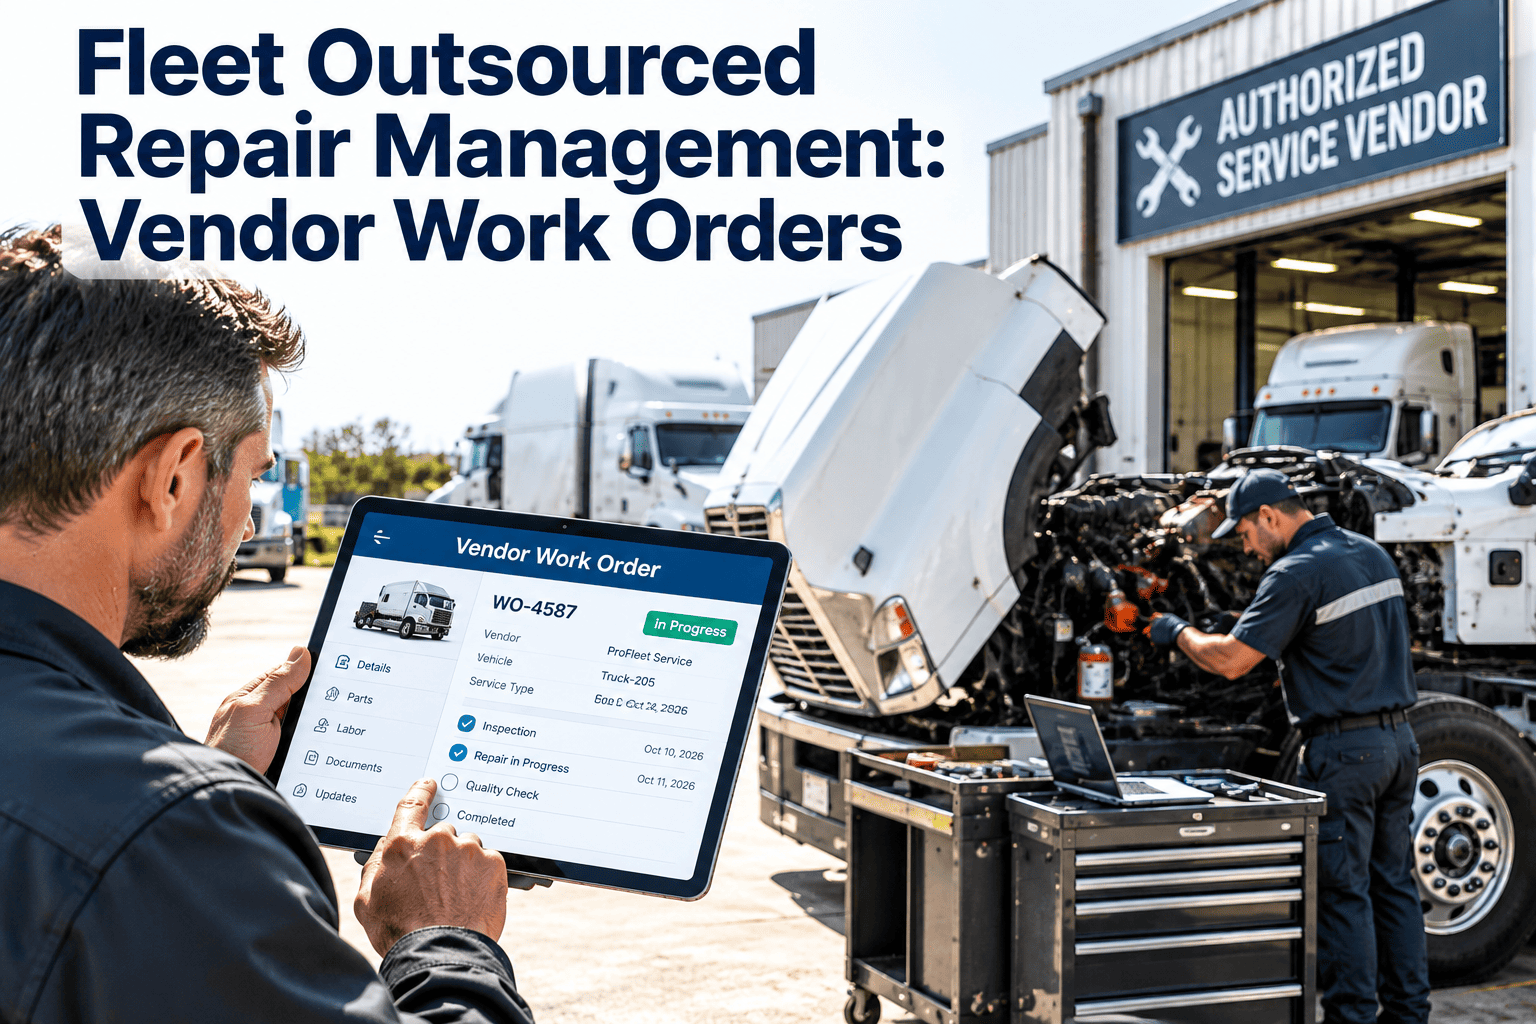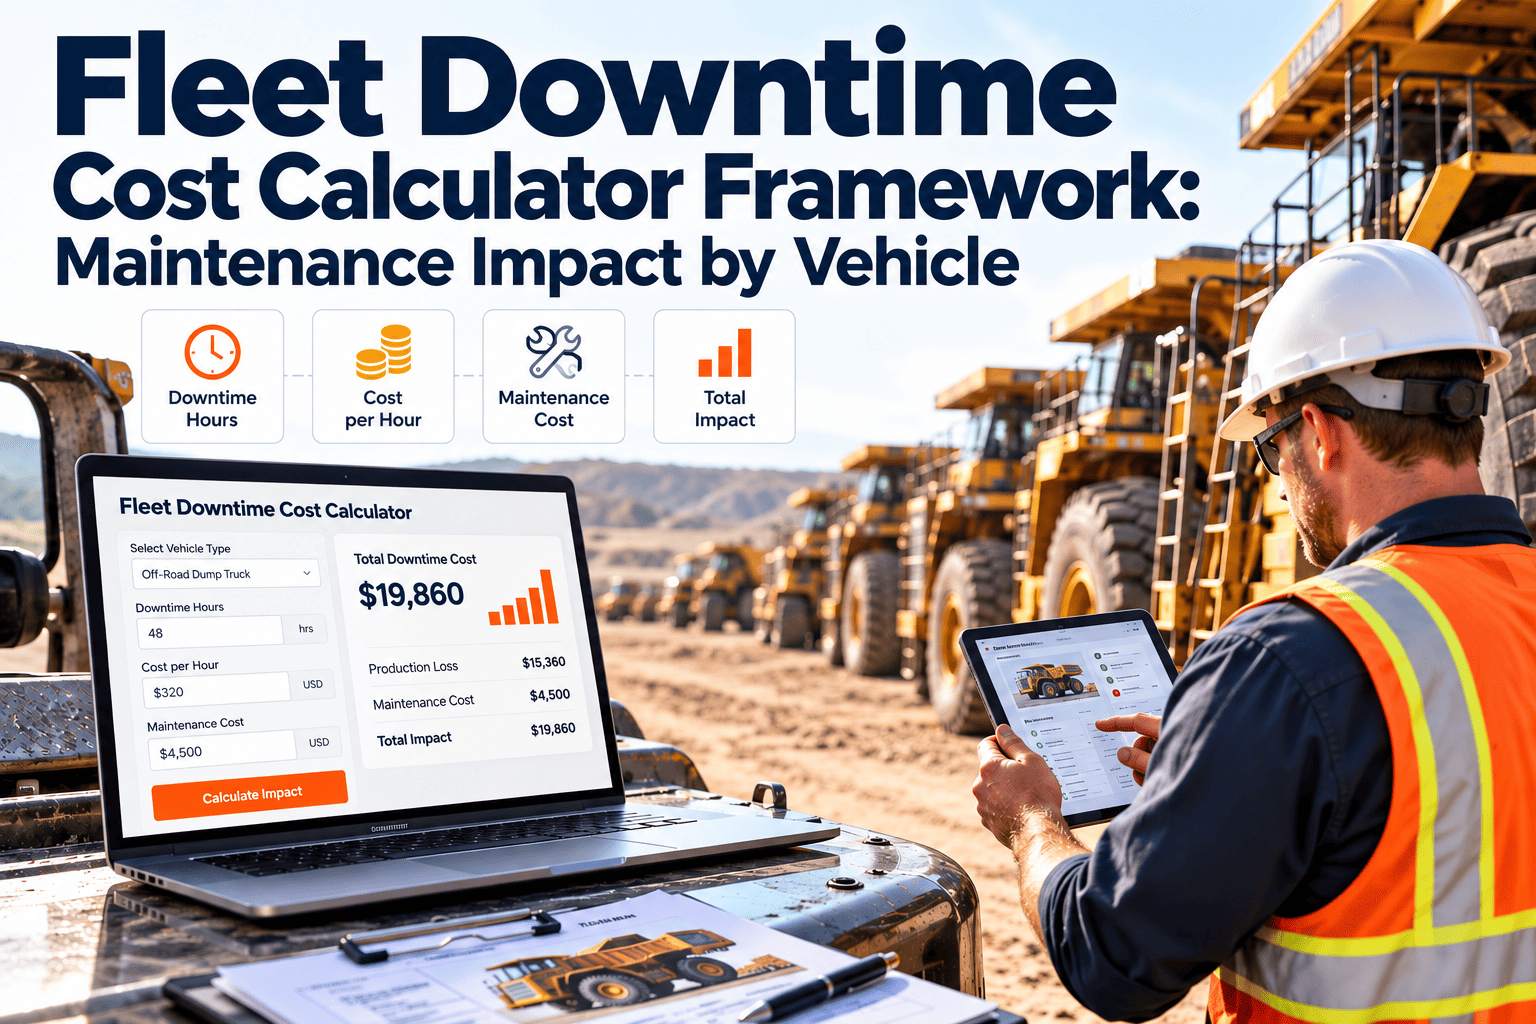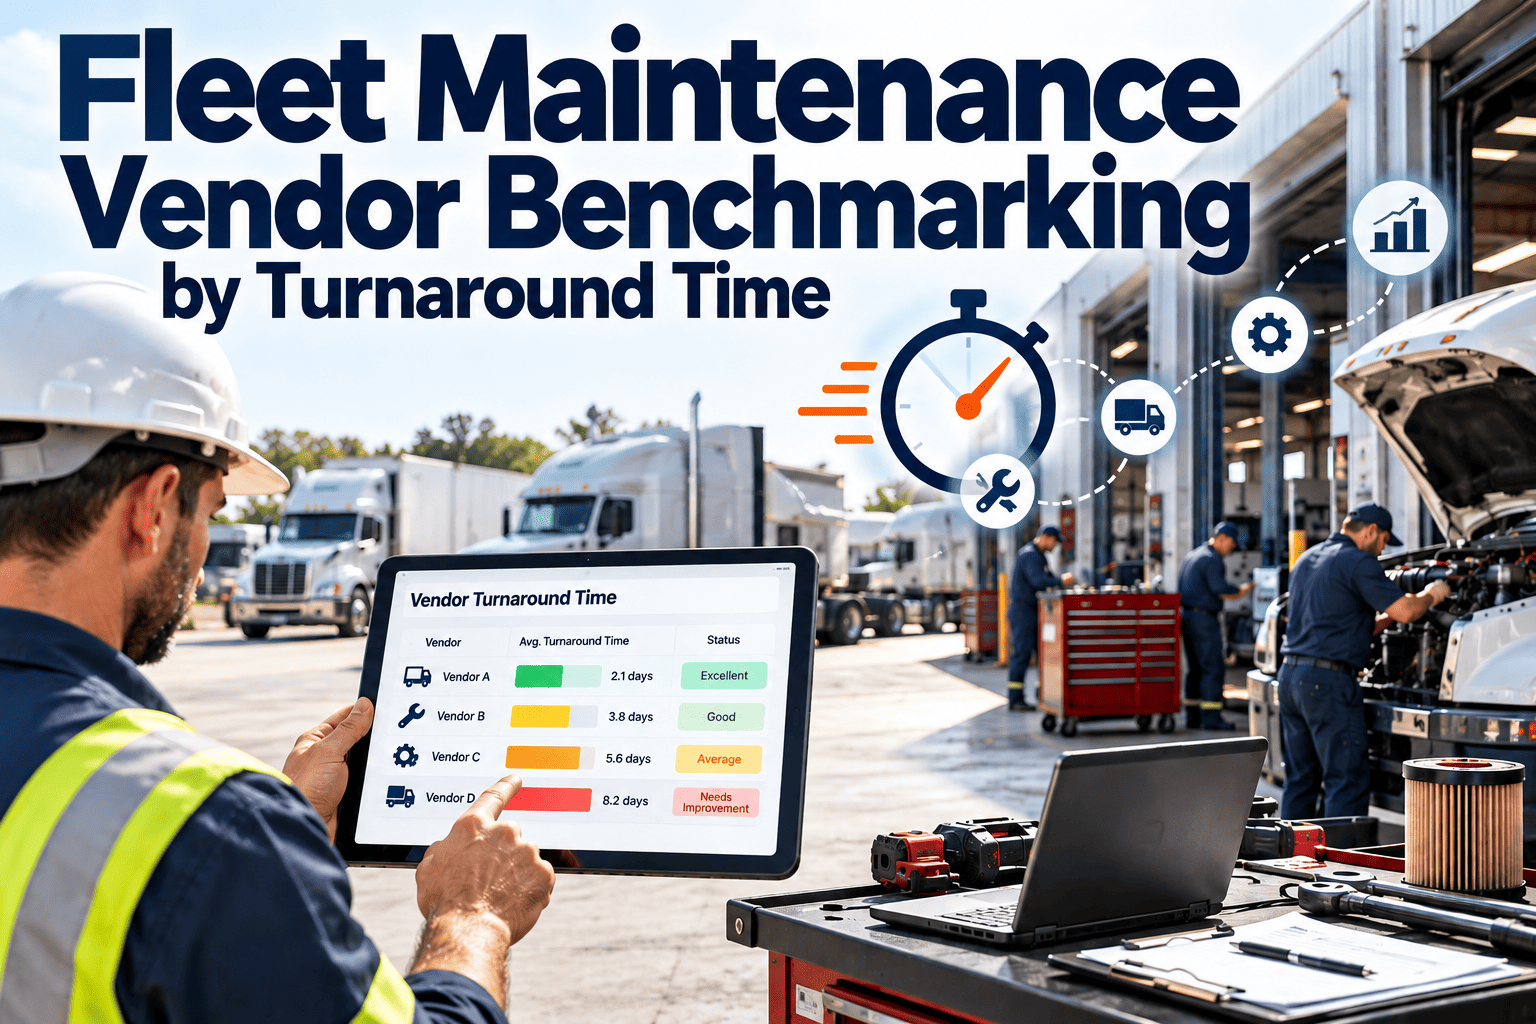
Every fleet depends on outside shops, dealers, and mobile repair vendors, yet few teams can say which vendor returns vehicles to service fastest. Without timestamped records, turnaround time becomes a matter of opinion, and slow vendors keep receiving work. Benchmarking vendors by turnaround time gives maintenance managers hard evidence for awarding jobs and negotiating service levels. A structured fleet maintenance software workflow captures those timestamps automatically.
Fleet Maintenance Vendor Benchmarking by Turnaround Time
Measure how long each vendor keeps your vehicles out of service, separate real repair time from waiting time, and rank vendors on evidence instead of habit.
Why turnaround time is the vendor metric fleets feel first
Price per job shows up on an invoice. Turnaround time shows up as a parked truck, a missed route, and a rented replacement.
Lost availability
Each extra day in a vendor bay removes a vehicle from dispatch, and the cost lands on operations rather than on the maintenance budget.Hidden waiting time
Most delay is not wrench time. It is queueing, diagnosis, estimate approval, and waiting for parts.Rework and comebacks
A fast release means little if the same defect returns within weeks. Speed must be read alongside repeat repairs.Scattered records
Drop-off times live in emails, phone calls, and driver notes, so nobody can reconstruct what actually happened.Turnaround time is more than days in the shop
Break every vendor visit into stages. The stage that causes delay tells you whether to coach the vendor, change your own process, or move the work.
Vendor-controlled stages
- Intake queue and bay scheduling
- Diagnostic speed and accuracy
- Parts sourcing and delivery
- Repair labor and quality check
Fleet-controlled stages
- Estimate review and approval speed
- Clear job scope and defect description
- Vehicle hand-off and pickup timing
- Warranty and authorization rules
The core turnaround formulas
Use consistent definitions across every vendor, or the comparison is meaningless.
A six-step benchmarking method
Define job classes
Group work into preventive service, brakes, tires, electrical, engine and drivetrain, body work, and regulatory inspections.Stamp every event
Record drop-off, estimate received, approval, parts arrival, repair complete, and pickup against one work order.Normalize the data
Compare vendors only within the same job class, vehicle type, and priority level.Score each vendor
Combine turnaround, promise accuracy, comeback rate, and cost into one weighted scorecard.Review with vendors
Share stage-level data and agree on corrective actions before changing allocation.Reallocate work
Route each job class to the vendor that performs best, and re-test quarterly.Vendor scorecard: what to track and what it reveals
| Metric | How to measure | What it reveals |
|---|---|---|
| Total turnaround | Drop-off to pickup, per job class | Overall time the vehicle is unavailable |
| Diagnosis time | Drop-off to estimate received | Technician capacity and diagnostic skill |
| Parts wait | Parts ordered to parts received | Sourcing strength and stock levels |
| Promise accuracy | Promised date versus actual release | Reliability of vendor commitments |
| Comeback rate | Repeat repairs within a set window | Quality of the first-time fix |
| Cost per job class | Invoice total versus estimate | Pricing discipline and scope creep |
| Documentation quality | Complete invoices, parts, and labor notes | Readiness for audits and warranty claims |
Read speed and quality together
A four-quadrant view prevents you from rewarding fast but sloppy vendors.
Fast and reliable
Preferred vendor. Route urgent and high-utilization vehicles here.Slow but reliable
Good for planned work where downtime is scheduled in advance.Fast but repeat repairs
Hidden cost. Investigate root causes before sending more work.Slow and unreliable
Place on corrective action or phase out of the approved list.Put a timestamp on every vendor visit
Track drop-off, approval, parts, and release dates against one work order, and see vendor turnaround without chasing emails.Before and after structured vendor tracking
Without a system
- Drop-off dates remembered, not recorded
- Vendors chosen by habit or proximity
- Delays blamed on whoever called last
- Invoices disputed without evidence
- Repeat repairs not linked to earlier jobs
With work order timestamps
- Every stage logged on one work order
- Vendors ranked by job class
- Delay causes visible by stage
- Estimates and invoices compared in one record
- Asset history exposes repeat failures
Data you must capture on every outsourced job
Compliance and records: why documentation counts
For commercial motor vehicles in the United States, FMCSA rules require systematic inspection, repair, and maintenance, along with records kept for the period the regulations specify. Verify current requirements for your operation before setting retention rules.
Why vendor records matter
Outsourced repairs still belong to your compliance file. Missing invoices or undocumented repairs create audit exposure even when the work was done correctly.What to require from vendors
Itemized labor and parts, completion dates, technician notes, and inspection sign-off, all attached to the matching work order.How Oxmaint supports vendor turnaround benchmarking
Oxmaint maintenance management software keeps vendor jobs inside the same workflow as in-house repairs.
Common benchmarking mistakes
Comparing unlike jobs
A brake job and an engine rebuild cannot share one average. Always segment by job class.Ignoring your own delays
Slow estimate approval inflates every vendor's number. Measure internal wait separately.Rewarding speed alone
Pair turnaround with comeback rate so rushed repairs do not look like wins.Using too little data
A handful of jobs can mislead. Build a meaningful sample before changing allocation.A practical vendor review cadence
Segment by job class before you compare any vendor
A single average turnaround figure per vendor is almost always misleading. Different work has different natural durations, and vendors specialize.
| Job class | Why turnaround differs | What to watch |
|---|---|---|
| Preventive service | Predictable scope, easy to schedule ahead | Same-day completion and promise accuracy |
| Brakes and tires | Parts are usually common and quick to source | Queue time before work starts |
| Electrical and diagnostics | Fault finding can take longer than the repair | Diagnosis time and repeat visits |
| Engine and drivetrain | Larger scope, special parts, longer bay time | Parts wait and estimate revisions |
| Body and collision | Claims, approvals, and paint cure add delay | Approval wait separate from repair time |
| Regulatory inspections | Fixed procedure but strict documentation | Completeness of inspection records |
Decide which vendors belong in the benchmark
Not every shop you have ever used deserves a place on the scorecard. Start with the vendors that receive meaningful work.
List every active vendor
Include dealers, independent shops, tire centers, body shops, and mobile or roadside providers that touched a vehicle in the last year.Check job volume
A vendor with only a handful of jobs gives you noisy data. Group them or wait until you have enough history.Match vendors to job classes
Benchmark each vendor only on the work they actually perform, not on categories they rarely handle.Add a baseline
If you also repair in-house, include your own shop. It shows whether outsourcing is saving time or costing it.Parts logistics: the hidden driver of vendor delay
When a vehicle sits for days, the cause is often a missing part rather than a slow technician. Parts wait deserves its own line in every benchmark.
Vendor does not stock common items
Filters, belts, brake components, and lamps should rarely cause a multi-day wait. If they do, the vendor has a sourcing problem.Parts ordered after approval
Some shops wait for estimate approval before ordering. Agreeing on pre-ordering for routine jobs removes that delay.Wrong part delivered
Poor vehicle identification leads to returns and reorders. Accurate asset records reduce this error.Speed, cost, and quality: reading the trade-offs
The fastest vendor is not automatically the best choice. Weigh turnaround against the other outcomes your operation cares about.
When speed should win
- High-utilization vehicles with no spare
- Time-sensitive routes and contracts
- Safety-related repairs awaiting release
- Peak season when every vehicle is needed
When cost or quality should win
- Vehicles with a spare available
- Planned work scheduled during slow periods
- Complex repairs with a history of comebacks
- Warranty work where documentation matters
Turning benchmark data into a vendor conversation
Data is only useful if it changes behavior. Share it with vendors in a way that invites improvement rather than defensiveness.
Lead with stages, not blame
Show where time was lost: intake, diagnosis, parts, or repair. Vendors can usually explain and fix a specific stage.Acknowledge your own delays
If slow approvals contributed, say so. Credibility improves when both sides own their part.Agree on specific commitments
Set targets such as diagnosis within a defined window or parts ordered at drop-off, and record them.Follow up with the next review
Return with updated numbers. Vendors respond when they know results will be checked.Benchmarking mobile, roadside, and dealer vendors
Different vendor types need slightly different definitions, so the clock starts and stops in the right place.
Set turnaround targets from your own baseline
Copying another fleet's numbers rarely works. Duty cycle, vehicle mix, and geography all change what is realistic.
Data quality checks before you trust the scorecard
Bad timestamps produce confident but wrong rankings. Audit the inputs before sharing results.
Look for gaps
- Jobs with no drop-off or pickup time
- Work orders closed days after pickup
- Missing job class or vehicle type
Look for outliers
- Extremely long jobs caused by backorders
- Same-minute timestamps entered in bulk
- Duplicate work orders for one visit