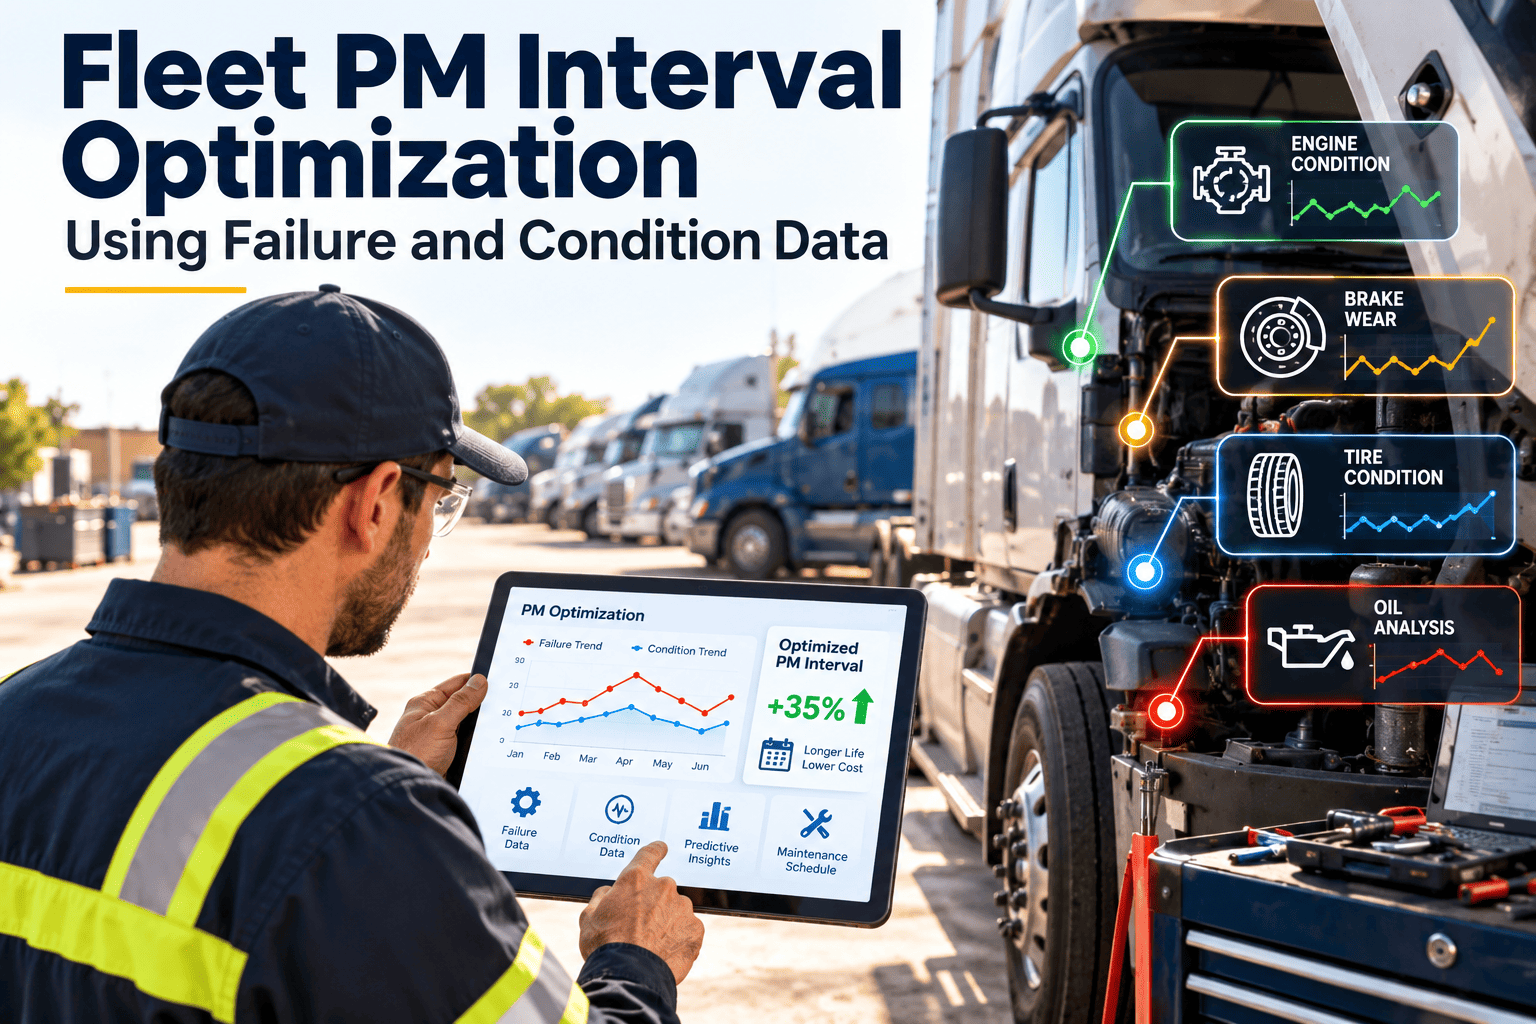
Most fleets still run preventive maintenance on a mileage or calendar number inherited from an OEM manual or an old shop habit. That number may be safe, but it is rarely the best number for every vehicle, duty cycle, and route. Fleet PM interval optimization uses failure history and condition data to move each service interval toward the point where parts are used well and breakdowns are avoided. This guide covers the data, the method, the guardrails, and the metrics, and shows how a fleet maintenance software workflow keeps the evidence in one place.
Fleet PM Interval Optimization Using Failure and Condition Data
Replace one-size-fits-all service schedules with intervals tuned to duty cycle, repair history, and measured condition, so every vehicle is serviced when the evidence says it is time.
Why one fixed PM interval rarely fits every vehicle
A 10,000-mile or 90-day schedule treats a highway tractor, a stop-and-go delivery van, and a refuse truck as if they wear the same way. They do not. Idle hours, payload, terrain, climate, and driver behavior all change how fast oil degrades, brakes wear, and filters load.
Fixed-schedule habits
- One interval applied to every unit in a class
- Intervals copied from the manual and never reviewed
- Inspection findings kept on paper and not trended
- Failures described as "repaired" with no cause recorded
- Extensions or cuts decided by opinion in the shop
Evidence-based habits
- Intervals set by duty-cycle group, not only vehicle type
- Scheduled reviews of every interval against real results
- Measured readings captured at each inspection
- Failure, cause, and component coded on every work order
- Changes trialed, measured, and documented before rollout
The cost of getting the interval wrong
The data that should drive interval decisions
Interval optimization needs two kinds of evidence. Failure data shows what already broke and when. Condition data shows how components are wearing before they break. Each source answers a different question.
| Data source | What it shows | Interval decision it informs |
|---|---|---|
| Work order history | Repairs, causes, parts, labor, repeat visits | Which components fail between services, and how often |
| Inspection readings | Brake lining, tread depth, fluid levels, play, leaks | Measured wear rate and remaining life at each service |
| Meter data (miles, hours) | Actual utilization by unit | Whether to schedule by distance, engine hours, or time |
| Fluid and oil analysis | Contamination, wear metals, fuel dilution, viscosity | Drain interval for engines, transmissions, and axles |
| Fault codes and telematics | Active and historical diagnostic trouble codes, idle time | Early warnings and duty-cycle segmentation |
| Road calls and roadside events | In-service failures and their root causes | Where the current interval is clearly too long |
| Parts consumption | Usage rate by component and vehicle group | Replacement frequency versus expected life |
Data quality comes first
- Use a consistent failure, cause, and component code list across all shops.
- Capture odometer or engine-hour readings on every work order, not only on PMs.
- Link repeat repairs to the original job so patterns are visible.
- Record the parts actually installed, not only the parts planned.
- Close work orders with findings, so "no defect found" is also data.
A seven-step method for tuning PM intervals
Treat each change as a small experiment. The goal is a documented decision, not a guess.
- 1
Segment by duty cycle
Group vehicles by how they work: line-haul, urban delivery, vocational, severe service. Intervals belong to groups, not to a vehicle label alone.
- 2
Baseline current performance
Measure PM compliance, repeat repairs, road calls, and defects found at PM for each group before changing anything.
- 3
Classify the failures
Separate failures that a PM could have prevented from random failures, abuse, and defects introduced by poor workmanship.
- 4
Find the warning window
For each important failure mode, identify the condition signal that appears before failure and how much time it gives you to act.
- 5
Propose a trial interval
Set the interval shorter than the warning window and inside the wear-out edge, with a documented safety margin.
- 6
Pilot on a controlled group
Apply the change to a limited set of units, keep a comparison group, and add extra inspections during the trial.
- 7
Review and standardize
Compare results, approve or roll back, update the PM template, and schedule the next interval review.
Put your repair history to work on your PM schedule
Capture failure causes, inspection readings, and meter data in one system, then adjust intervals with evidence instead of habit.
Deciding whether to extend, hold, or shorten
Not every component deserves the same level of risk tolerance. Weigh the consequence of failure against the evidence that the current interval is or is not working.
What failure patterns tell you about the interval
Time-based PM only helps when failures are tied to age or use. Reading the pattern first prevents wasted effort.
| Pattern in the history | Likely meaning | Best response |
|---|---|---|
| Failures soon after a service | Workmanship, wrong parts, or a missed step | Fix the procedure and verification, not the interval |
| Failures spread randomly across mileage | Not age-related | Use inspections and condition monitoring instead of more PM |
| Failures cluster near a similar mileage or age | Clear wear-out | Set the service before that point with a margin |
| Failures concentrated in one route or vehicle group | Duty-cycle effect | Create a separate interval for that group |
| Many "no defect found" results at PM | Interval may be too short for that task | Trial a longer interval for that item with extra checks |
Condition signals by vehicle system
Condition data turns a calendar guess into a remaining-life estimate. These are the signals most fleets can collect during normal inspections.
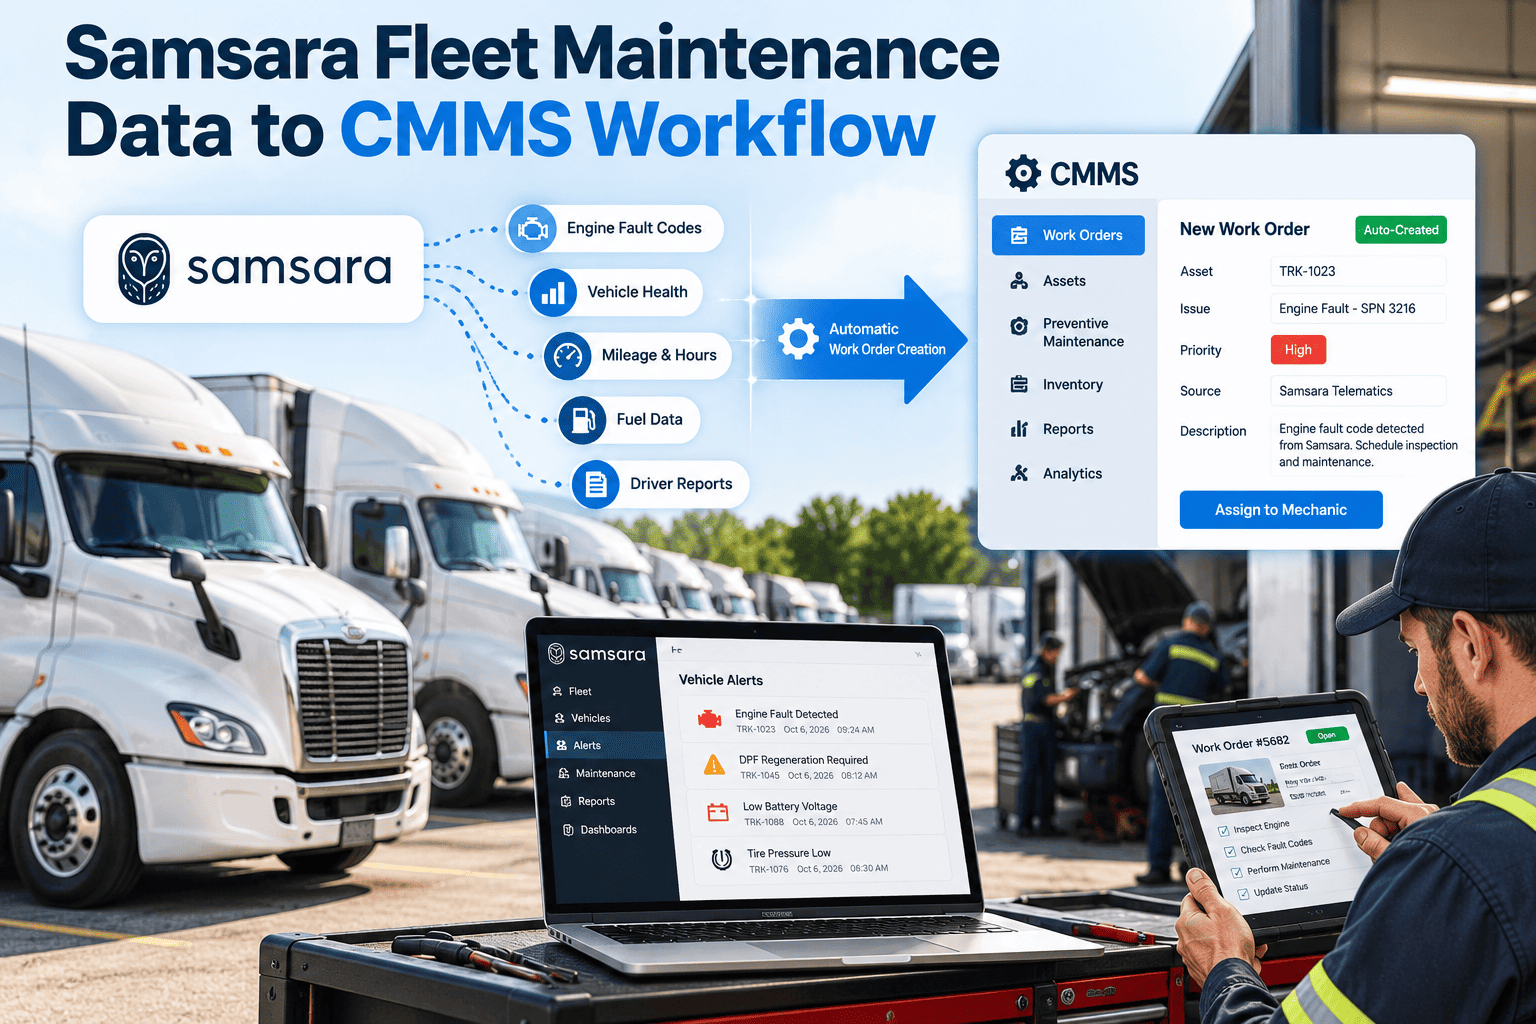
From telematics and fault codes to condition-based triggers
Connected vehicles generate fault codes, idle time, engine load, and battery data every day. Used well, that stream does not replace PM. It tells you when a scheduled interval should be pulled forward, pushed back, or supplemented with an inspection.
- SignalFault code, reading, or alert from the vehicle or an inspection
- ThresholdA defined limit that separates normal from actionable
- Work orderAn inspection or corrective job created and assigned
- FindingsWhat the technician actually found, coded and recorded
- Interval reviewFindings feed back into the PM template for that group
Why the feedback step matters
Alerts that never reach a work order are just noise. Alerts that reach a work order but return no coded findings cannot improve the next threshold. The loop only works when the closing step is as disciplined as the opening one.
A review cadence that keeps intervals current
Intervals drift out of date when routes, vehicle models, drivers, and parts suppliers change. A fixed review rhythm prevents that drift.
- MonthlyReview PM compliance, overdue items, road calls, and any repeat repairs inside the last service cycle.
- QuarterlyReview pilot results, defects found at PM by task, and parts consumption against expected life for each vehicle group.
- AnnuallyRevisit every PM template, confirm duty-cycle groups still make sense, and check changes against warranty and regulatory requirements.
- Event-drivenReopen the interval after new vehicle models, route changes, a failure spike, a supplier change, or a serious in-service event.
Common mistakes in PM interval optimization
Most failed optimization projects fail for process reasons, not analytical ones.
- Extending first, measuring laterLonger intervals without a comparison group make it impossible to tell whether results improved or simply got lucky.
- Treating all failures as PM failuresAbuse, accident damage, and workmanship errors do not respond to interval changes and distort the analysis.
- Ignoring the techniciansTechnicians know which tasks routinely find nothing and which always find something. Their input shortens the analysis.
- Changing too many things at onceAltering intervals, parts brands, and procedures together hides the cause of any change in results.
- Skipping documentationWithout a recorded rationale, the next manager cannot tell why an interval was changed or when to revisit it.
Before and after: an illustrative PM program revision
This is a generic scenario to show the shift in approach, not a customer result.
- All delivery vans on one 90-day service
- Brake wear recorded as pass or fail only
- Road calls logged without a cause
- Interval changes argued from experience
- Vans grouped by stop density and idle hours
- Brake thickness measured and trended each visit
- Every road call coded to a failure cause
- Interval changes piloted, measured, and approved
Guardrails: safety, compliance, and warranty
Optimization never means skipping required work. Keep these checks in place before extending anything, and review them with safety, compliance, and warranty owners so that efficiency gains never come from reduced protection.
- Regulatory inspections and driver vehicle inspection report workflows stay on their required schedule.
- Maintenance, inspection, and repair records are retained and retrievable for each vehicle, as required for commercial motor vehicles in your jurisdiction.
- Safety-critical systems such as brakes, steering, and tires are not extended without measured evidence.
- OEM warranty and emissions-system requirements are reviewed before any change.
- Every interval change has an owner, an approval, a rationale, and a rollback trigger.
- Pilot units receive extra inspections until results are confirmed.
How Oxmaint supports interval optimization
Interval work fails when the evidence is scattered across paper forms, spreadsheets, and memory. A maintenance-first CMMS gives the team one record to analyze.
Metrics that show whether the new intervals are working
Track these by duty-cycle group, and compare pilot units with the baseline group.
- PM complianceShare of PMs completed on time. A change that lowers compliance is a warning sign.
- Defects found at PMToo many suggests a long interval, too few may suggest a short one.
- Repeat repair rateThe same fault returning points to a root cause the interval is not solving.
- Road callsIn-service failures per unit or per distance, tracked by cause.
- Mean time between failuresFor key components, measured before and after the change.
- Maintenance cost per mile or hourTotal cost, including downtime and towing, not only shop labor and parts.
Frequently asked questions
How much history do I need before changing an interval?
Enough repeat events per component to see a pattern, which varies by fleet size. Start with the highest-cost failures and pilot carefully. You can sign up to start collecting clean history.
Should PM be based on mileage, hours, or time?
Use the measure that best matches wear. Idle-heavy vehicles often track better by engine hours, while seasonal units may need a time limit as well.
Can I extend intervals on warranty vehicles?
Check warranty terms first. Many require OEM minimum service, so optimize additional inspections and task content rather than cutting required work.
What if my failure data is incomplete?
Standardize failure codes and inspection readings now, then analyze as data builds. A short demo can show how this fits your workflow.
How often should intervals be reviewed?
Review at least annually, and sooner after fleet changes, new routes, new vehicle models, or a spike in road calls.
Move from fixed schedules to intervals you can defend
Bring inspections, work orders, parts, and vehicle history into one maintenance workflow, and let the evidence guide every interval decision.