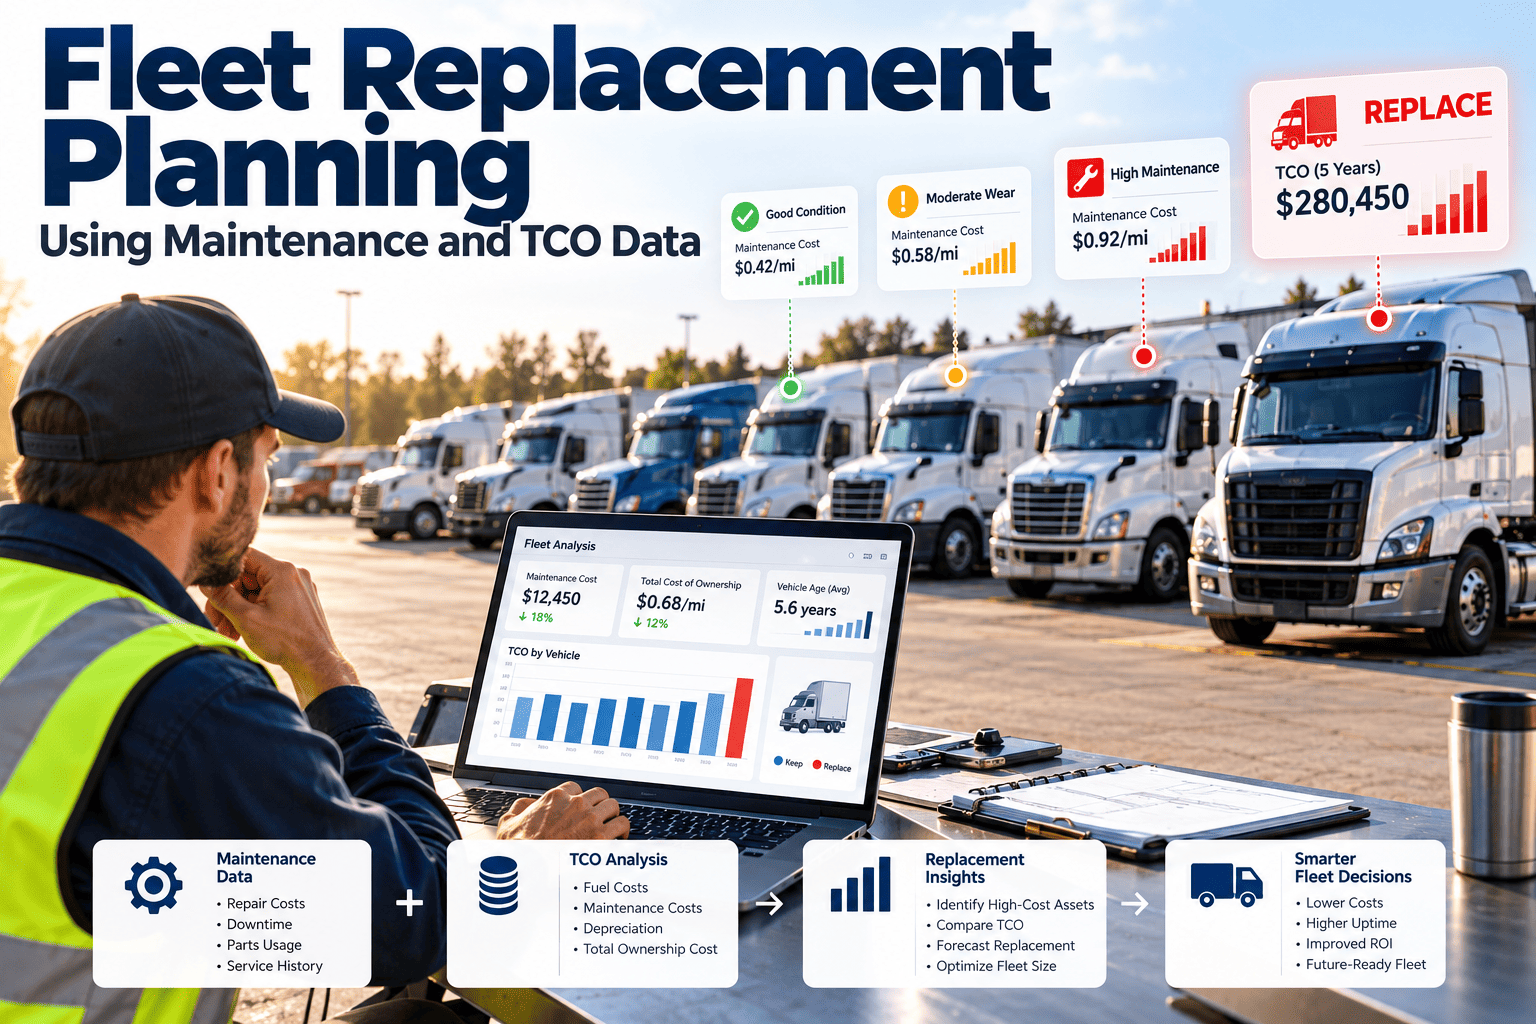
Most fleets replace vehicles on a calendar or an odometer number, then discover that some units were retired too early while others drained the budget for two more years. The maintenance record holds a better answer: repair cost per mile, downtime days, repeat failures, and parts spend show exactly when a vehicle stops earning its place. This guide explains how to build a fleet replacement plan from maintenance and total cost of ownership (TCO) data, and how a maintenance-first CMMS keeps that data clean enough to trust.
Fleet Replacement Planning Using Maintenance and TCO Data
Stop guessing at retirement dates. Use work order history, downtime, and lifecycle cost to decide which vehicles to keep, repair, or replace next.
Acquisition and depreciation
Repair and parts spend
Downtime and disruption
Illustrative: the replacement window opens where combined cost per mile stops falling.
Why age and mileage alone lead to bad replacement calls
A fixed rule such as "replace at 150,000 miles" is easy to budget and easy to defend. It is also blind to how each vehicle was used and maintained.
- Duty cycle differs. A pickup that idles on a job site all day wears differently from one that drives highway miles, even at the same odometer reading.
- Maintenance quality differs. Two identical units can have very different repair histories depending on how consistently preventive maintenance was completed.
- Downtime is rarely counted. Repair invoices are visible. Lost route coverage, rental substitutes, and missed jobs usually are not.
- Model-specific failures cluster. Some vehicle families develop the same expensive failure around the same age. Only grouped work order data reveals it.
What belongs in a fleet TCO model
Total cost of ownership adds every cost of keeping a vehicle in service and subtracts what it is worth when you sell it. The maintenance system supplies most of the operating inputs.
| Cost element | What to capture | Where the data lives |
|---|---|---|
| Acquisition and financing | Purchase price, interest, upfit, registration | Asset record |
| Depreciation and resale | Expected and actual resale value at disposal | Asset record and disposal notes |
| Preventive maintenance | Labor hours, parts, outside service, intervals met | PM work orders |
| Corrective repairs | Failure type, labor, parts, vendor invoices | Corrective work orders |
| Downtime | Days out of service, substitute vehicle cost | Work order open and close times |
| Fuel and energy | Cost per mile, idle share, efficiency trend | Fuel records and meter readings |
| Compliance and safety | Failed inspections, out-of-service events, recalls | Inspection and compliance records |
How the cost curve bends as a vehicle ages
Ownership cost per mile usually falls early as depreciation spreads out, then turns upward as repairs and downtime grow. The lowest point marks the economic life.
Years 1-2DepreciationPMHigh total, low repair
Years 3-4DepreciationRepairsOften the sweet spot
Years 5-6DepreciationRepairsDowntimeWatch closely
Years 7+Dep.RepairsDowntimeReplacement likely
Segment widths are illustrative. Your own work order history sets the real shape for each vehicle class.
Put every repair dollar against the right vehicle
Replacement decisions are only as good as the history behind them. Start building clean asset records today.
Maintenance signals that mark a replacement candidate
No single number decides a replacement. A scorecard of several signals, with thresholds set from your own fleet history, is more defensible.
Repair cost per mile
Compare each unit to the median for its class. A sustained climb above class average is the first flag.
Repair cost against replacement cost
Many fleets review a unit when cumulative repair spend approaches a set share of its replacement price.
Unplanned downtime days
Count days out of service per quarter, not just invoice totals.
Repeat failures
The same system failing again within a short window signals a deeper condition problem.
Inspection failures and safety defects
Rising defect counts at inspection show structural or safety-system wear.
Parts availability
Long lead times on older models extend downtime and raise repair cost.
A six-step replacement planning workflow
Replacement planning works best as a repeatable annual cycle tied to the budget calendar.
1
Clean the asset register
Confirm every vehicle has class, in-service date, purchase cost, and a current meter reading.
2
Roll up cost by vehicle
Sum PM, repair, parts, and outside service from work orders for the last 12 and 36 months.
3
Benchmark against class
Rank units by cost per mile and downtime inside their own vehicle class.
4
Review the flagged units
Have technicians confirm whether the cost is a real condition problem or a one-time event.
5
Rank and fund
Order the replacement list by risk and cost, then match it to budget and lead times.
6
Feed results back
Record actual resale and early life performance of new units to improve the next cycle.
Repair, keep, or replace: a decision matrix
Use the matrix as a conversation starter between maintenance, finance, and operations.
| Condition | Cost trend | Downtime | Suggested action |
|---|---|---|---|
| Single major failure, otherwise healthy | One-time spike | Low | Repair and keep |
| Rising minor repairs across systems | Climbing steadily | Moderate | Plan replacement next cycle |
| Repeat failure on the same system | Climbing quickly | High | Root cause review, likely replace |
| Safety or inspection defects increasing | Any | Any | Prioritize replacement |
| Low use, low cost, backup role | Flat | Low | Keep, consider reassigning |
Work order data quality decides the answer
TCO analysis fails when repairs are logged against the wrong vehicle or described as "fixed." These habits protect the data.
Charge every labor hour and part to the correct asset
Record meter readings at each work order
Use a standard failure and system code list
Log outside vendor invoices on the same work order
Capture open and close times to measure downtime
Mark whether a repair was preventive, corrective, or accident related
Calendar-based versus data-based replacement
Calendar-based approach
- Fixed age or mileage triggers for every class
- Budgets built from last year's list
- Surprise failures force emergency purchases
- Healthy vehicles retired early
Data-based approach
- Triggers set from observed cost curves by class
- Budgets built from ranked, evidence-backed lists
- Declining units spotted before failure
- Vehicles kept while they remain economical
Trends changing replacement planning
Several shifts make disciplined data more valuable than a fixed schedule.
Longer vehicle lead times
Ordering windows can stretch for many vehicle types, so planning must start earlier and rely on forecasts.
Electric and alternative fuel pilots
Maintenance profiles differ. Early pilots need their own cost records so comparisons are fair.
Volatile used vehicle values
Resale assumptions should be reviewed against actual disposal results each year.
Connected vehicle data
Meter, fault, and usage data can enrich maintenance records when it is tied to the right asset.
Fleet replacement KPIs to track every quarter
Cost per mile or hour
Maintenance plus fuel divided by usage, by class
PM compliance
Preventive services completed on time
Unplanned repair share
Corrective hours as a share of all labor
Availability
Days in service divided by days scheduled
Average age by class
Fleet age compared to planned economic life
Resale versus forecast
Actual disposal value against the planning estimate
A worked example of the repair-versus-replace math
The numbers below are hypothetical and exist only to show the method. Substitute your own work order totals, prices, and resale estimates.
| Input | Unit A: older van | Unit B: newer van |
|---|---|---|
| Annual miles | 22,000 | 22,000 |
| Annual repair and parts cost | High and rising for three years | Mostly preventive maintenance |
| Days out of service per year | Several unplanned events | Scheduled service only |
| Depreciation per year | Small, value already low | Larger, value still high |
| Combined cost per mile | Compare to Unit B | Compare to Unit A |
Read the last row as the decision row. When the older unit's combined cost per mile, including downtime, exceeds the newer unit's, holding it costs more than it saves.
Three things the example shows
- Low depreciation does not make an old vehicle cheap. Repair spend and lost availability can outweigh it.
- Downtime belongs in the calculation, even when it is an estimate based on substitute vehicle or lost job cost.
- The comparison must use the same mileage basis, or the older unit may look better only because it runs less.
Common replacement planning mistakes
Most poor replacement decisions trace back to data problems or process gaps rather than market conditions.
Counting only shop invoices
In-house labor, roadside calls, towing, and rentals often sit in different budgets. Pull them into one vehicle record.
Letting one accident distort the record
Collision repairs should be coded separately so they do not make a healthy vehicle look like a lemon.
Ignoring utilization
A vehicle that barely moves may be a candidate for disposal or reassignment instead of replacement.
Skipping preventive maintenance to delay spend
Deferred services raise later repair cost and make cost curves look worse than the model really is.
Treating every class the same
Light-duty, medium-duty, and specialty vehicles reach their economic life at very different ages and usage levels.
Special cases that need their own rules
Standard thresholds do not suit every asset. Define separate criteria for these groups before the planning cycle starts.
Specialty and upfit vehicles
Bucket trucks, service bodies, and refrigerated units have a chassis life and an equipment life. Track both, because the body may outlast the truck or the reverse.
Low-hour and standby units
Age-driven wear such as seals, hoses, batteries, and corrosion matters more than mileage. Plan by condition and inspection results.
Regulated vehicles
Vehicles subject to inspection and out-of-service rules should factor in failed inspections and repeat defects as replacement drivers.
Pilot electric or alternative fuel units
Keep a separate record of energy cost, service tasks, and downtime so you can compare them with conventional units on the same basis.
Presenting the replacement case to finance and leadership
Finance teams approve plans they can trace back to evidence. Structure the proposal so each number has a source.
A
Start with the exposure
Show how much was spent keeping the flagged units running over the past 12 months, and how many days they were unavailable.
B
Compare against the alternative
Present projected cost per mile for the replacement option next to the current trend for the old unit.
C
State the assumptions
List resale values, financing terms, and expected maintenance, and mark which are measured and which are estimated.
D
Show the risk of waiting
Explain what happens if a flagged unit fails before replacement arrives, including coverage gaps and safety exposure.
Using preventive maintenance to extend the right vehicles
Replacement planning is not only about retiring vehicles. It also identifies where better maintenance can safely push economic life further.
| Finding in the data | Maintenance response |
|---|---|
| Missed or late preventive services before a cost spike | Tighten PM scheduling and escalate overdue work orders |
| Repeat brake, tire, or suspension repairs | Review inspection frequency and driver reporting |
| Same component failing across a vehicle model | Shorten the service interval or plan model-level replacement |
| High parts cost on one unit only | Check part quality, installation practice, and warranty claims |
How Oxmaint supports replacement planning
Oxmaint does not replace your finance model. It supplies the maintenance evidence that feeds it.
- Asset management: a lifetime record for each vehicle with meter readings, documents, and full service history.
- Preventive maintenance: scheduled services by meter or calendar so cost history reflects consistent care.
- Work orders: labor, parts, and vendor cost captured against the correct asset, with open and close times.
- Inspections: mobile checklists that record defects early and build a condition trail.
- Inventory: parts usage tied to vehicles, showing which units consume the most.
- Reporting: dashboards for repair cost, downtime, and PM compliance that support budget discussions.
Close the loop after every disposal
Each retired vehicle is a free data point for the next plan. Capture it while the details are fresh, and your replacement model improves every year.
Final odometer or hour reading and total months in service
Lifetime maintenance and repair cost, split into preventive and corrective
Total unplanned downtime days over the vehicle's life
Actual sale price compared to the planning estimate
Top three failure systems and the age at which they appeared
Technician notes on condition and whether replacement came too early or too late
Why this step is usually skipped
- Disposal is handled by a different team than maintenance, so records never meet.
- Asset records are archived or deleted when the vehicle leaves the fleet.
- Nobody owns the question of whether the replacement timing was right.
Keeping retired assets in the system, marked as disposed, lets you compare lifetime cost by model and class in future reports.
Frequently asked questions
What is TCO in fleet replacement planning?
It is the full cost of owning a vehicle over its life, including purchase, maintenance, fuel, downtime, and resale value.
When should a fleet vehicle be replaced?
When combined cost per mile starts rising and downtime or safety risk grows. Thresholds should come from your own history.
Which maintenance data matters most?
Cost per asset, meter readings, downtime days, repeat failures, and inspection defects. Start free to capture them.
Can a CMMS calculate replacement timing?
It provides the cost and downtime history that informs the decision. See it live in a short demo.
How often should we review the replacement plan?
Review quarterly for flagged units and refresh the full ranked list once a year before budgeting.
Build your next replacement list on evidence
Give every vehicle a complete cost and maintenance history, then rank replacements with confidence.