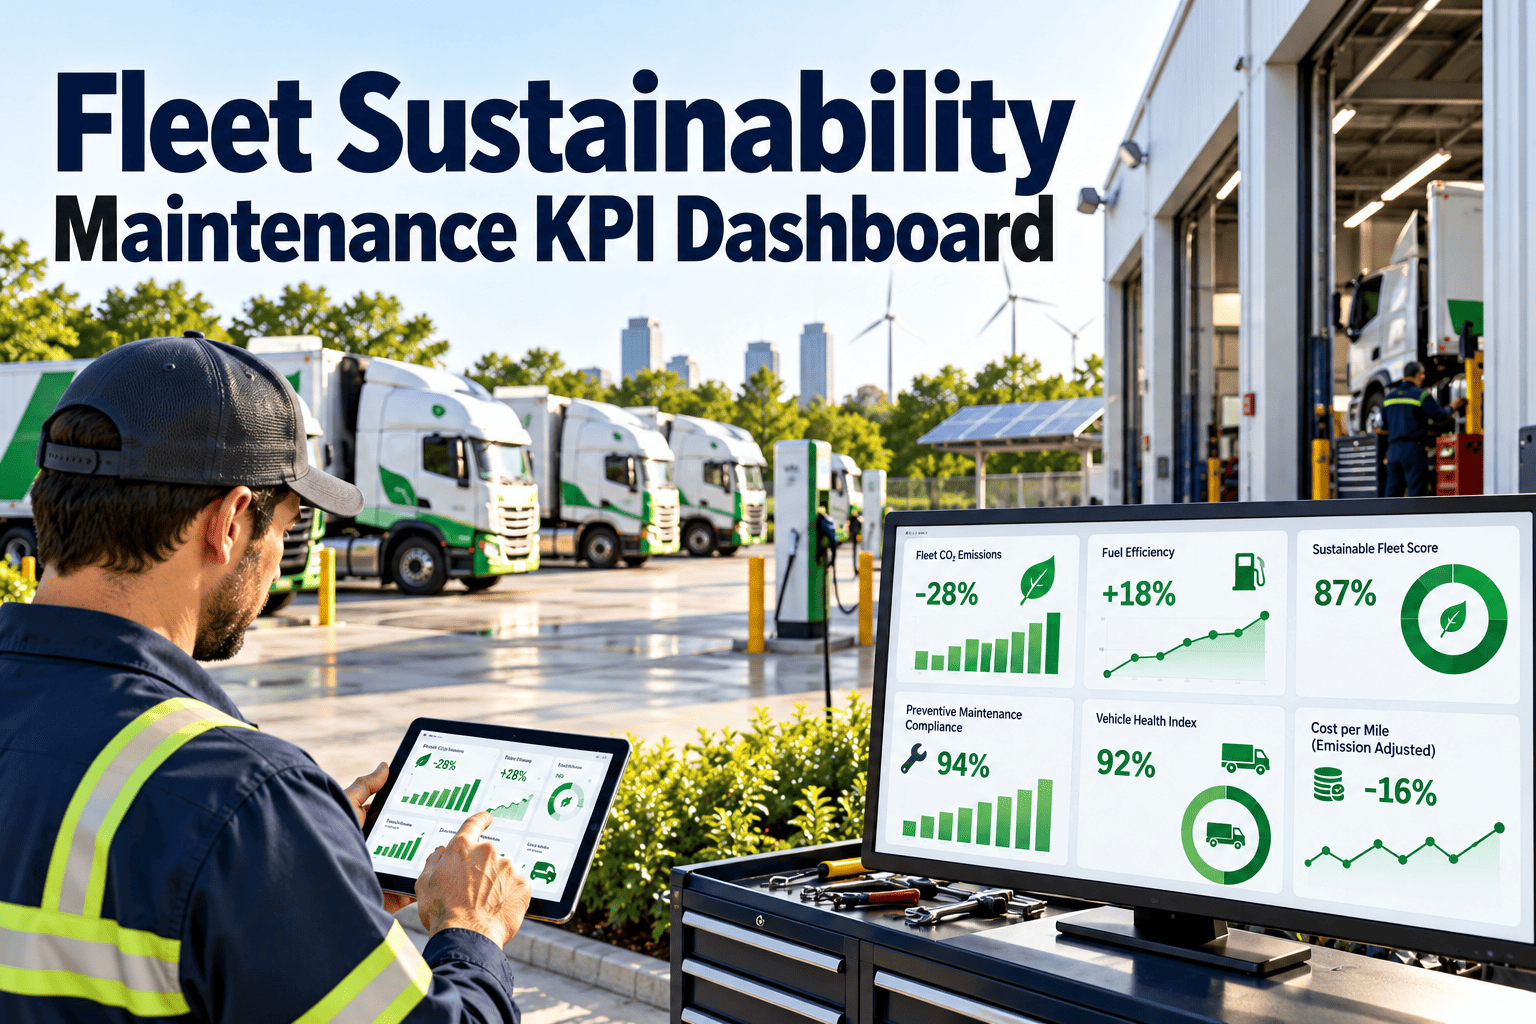
Fleet sustainability is often discussed as a fuel or vehicle-purchase topic, yet maintenance decides much of the outcome. Under-inflated tires, late filter changes, unresolved fault codes and repeat repairs all raise fuel use, emissions and waste. A sustainability KPI dashboard puts those maintenance drivers on one screen, so teams can see what is helping and what is not. This guide shows which KPIs belong on it, where the data comes from, and how Oxmaint supports the maintenance side.
Fleet Sustainability Maintenance KPI Dashboard
How maintenance connects to sustainability
KPI library for the dashboard
Pick a small set and define each one clearly. A dashboard of forty measures helps nobody.
| KPI | Definition | Sustainability link | Source |
|---|---|---|---|
| PM compliance | PMs completed within interval | Efficient, reliable engines | Work orders |
| Fuel per mile or hour | Fuel used divided by usage | Direct fuel and emission driver | Fuel data, telematics |
| Idle time share | Idling as a share of engine hours | Wasted fuel and emissions | Telematics |
| Emissions fault age | Days between fault and repair | Shorter time with a faulty system | Fault codes, work orders |
| Repeat repair rate | Same component repaired again soon | Less parts and fluid waste | Work order history |
| Tire inspection completion | Inspections done on schedule | Lower rolling resistance, longer tire life | Inspections |
| Vehicle life extension | Planned vs actual service life | Spreads embedded impact over more years | Asset records |
| Used oil and fluid recovery | Waste handled through proper channels | Lower spill and disposal risk | Shop records |
Measure what your shop already controls
Design the dashboard for three audiences
Executive view
- PM compliance trend
- Fuel per distance by class
- Emissions fault age
- Asset life against plan
Shop view
- Overdue and due-soon PM
- Open fault codes by severity
- Repeat repair list
- Parts and fluid usage
Driver and route view
- Idle share by shift
- Pre-trip inspection completion
- Tire and defect reports
- Trend against peers
From raw data to a trusted number
Collect
Clean
Define
Display
Act
Pitfalls that make sustainability dashboards misleading
Weak dashboard
- Compares unlike vehicles directly
- Uses totals without normalizing for usage
- Fuel data and maintenance data kept apart
- No owner for off-track measures
Useful dashboard
- Groups by class, age and duty cycle
- Uses rates per mile or hour
- Links fuel, faults and repairs per vehicle
- Assigns each KPI an accountable role
A review rhythm that keeps KPIs alive
Fuel and idle KPIs: how to read them correctly
Fuel use is the most visible sustainability measure, and the easiest to misread. A raw total only tells you how much a vehicle worked.
| Measure | Good use | Common mistake | Maintenance action |
|---|---|---|---|
| Fuel per mile or hour | Compare similar vehicles over the same period | Comparing loaded and empty routes | Check tires, filters, tune and fault codes on outliers |
| Idle share of engine hours | Find routes and shifts with avoidable idling | Counting required idling such as power take-off use | Review idle policy and equipment settings |
| Trend per vehicle | Spot gradual decline after a repair or season change | Ignoring weather and load changes | Schedule an inspection when the trend turns |
| Fleet average by class | Set realistic targets and track progress | Mixing vehicle classes in one average | Report by class, depot and period |
Maintenance quality KPIs behind the sustainability numbers
These measures show whether maintenance work itself is helping or hurting efficiency and waste.
Planned work share
- Preventive work as a share of total
- Overdue PM count and age
- PM done within the grace window
Repair quality
- Repeat repairs within a set period
- Comebacks after a vendor repair
- Jobs closed with verification recorded
Resource use
- Parts used per repair type
- Fluids added between services
- Rework hours by technician team
Emissions-related maintenance indicators
Maintenance does not measure tailpipe emissions directly, but it controls the health of the systems that reduce them.
Electric and alternative-fuel assets need their own KPIs
Fleets that add electric vehicles or equipment keep the same dashboard, with measures that fit the new technology.
Waste and circularity indicators
Sustainability also means using fewer parts and fluids to keep vehicles running. Track what leaves the shop as well as what comes in.
- Parts replaced per vehicle per year, split by component group.
- Share of repairs using rebuilt, remanufactured or reused components where suitable.
- Tires retreaded or recycled compared with tires scrapped early.
- Used oil, coolant and battery volumes handled through approved channels.
- Vehicle life achieved compared with planned life, by class.
Set baselines and targets in four steps
Measure
Segment
Target
Review
Reporting to leadership and customers carefully
Sustainability claims draw scrutiny. Report what the data supports and show how it was measured.
Avoid
- Claiming emissions reductions without fuel data
- Mixing estimates and measurements without saying so
- Changing definitions between reporting periods
- Presenting a single good month as a trend
Do
- State the source and period for each figure
- Keep definitions fixed and documented
- Show trends over several periods
- Link improvements to specific maintenance actions
What Oxmaint contributes to the dashboard
The maintenance side of a sustainability dashboard comes from records that Oxmaint captures as work happens.
Dashboard build checklist
- Choose five to eight KPIs and write a one-line definition for each.
- Name the data source and the owner for every KPI.
- Confirm vehicle IDs match across maintenance, fuel and telematics data.
- Decide the segments: class, depot, age band and duty cycle.
- Set the refresh rhythm and the review meeting that will use the dashboard.
- Agree what action follows when a KPI moves off track.
Turn each KPI into a maintenance action
A dashboard only matters if a number moving the wrong way leads to work. Map every KPI to a response before the first review.
| If this moves the wrong way | Check first | Typical work order |
|---|---|---|
| Fuel per mile rises on a vehicle class | Tire pressure, air filters, recent repairs, fault codes | Inspection and corrective tasks on affected units |
| Idle share climbs on one route | Route changes, shift patterns, equipment settings | Review with dispatch and adjust settings |
| Overdue PM backlog grows | Bay capacity, parts availability, technician hours | Reschedule and add capacity or buffer |
| Emissions fault age increases | Parts lead time, diagnosis delays, approval steps | Priority work order and parts reservation |
| Repeat repairs rise | Diagnosis quality, part source, driver or route cause | Root-cause inspection |
| Tire inspection completion falls | Checklist friction, mobile access, shift pressure | Simplify the checklist and reassign ownership |
Data sources and who maintains them
Most dashboards fail because nobody owns the data feeding them. Assign each source an owner and a quality check.
Maintenance system
- Work orders and PM compliance
- Inspections and defects
- Parts and fluids used
- Owner: maintenance manager
Fuel and telematics
- Fuel volumes and card data
- Idle, speed and usage readings
- Fault code feeds
- Owner: fleet manager
Asset and finance
- Vehicle age, class and cost
- Planned and actual life
- Disposal and resale data
- Owner: finance or asset lead
Common dashboard mistakes in sustainability reporting
Quarterly review agenda
A quarterly session gives leadership a clear picture without drowning in detail. Keep it to a short, repeatable agenda.
Trend review
Outliers
Actions closed
Asset life
Next actions
Why preventive maintenance is the foundation
Many sustainability gains come from doing ordinary maintenance consistently. Efficient, well-tuned vehicles use less fuel and last longer.
- Clean filters and correct fluids keep engines running as designed.
- Correct tire pressure and alignment reduce rolling resistance and tire waste.
- Prompt repair of leaks and faults limits fluid loss and extra emissions.
- Planned repairs use fewer rush parts and less shipping and rework.
- Longer vehicle life spreads the impact of manufacturing over more years of service.
Start small: a first-month dashboard plan
You do not need every data feed on day one. A modest first version builds trust and shows where the data needs work.
Questions to ask before adding another KPI
- Which decision will this number change, and who makes that decision?
- Can we measure it reliably with the data we already collect?
- Does it overlap with a KPI that is already on the dashboard?
- Is it a result of maintenance work, or mostly outside the shop's control?
- What will we do differently if the number gets worse?
- Who will check that the data behind it is accurate each month?
Share results with drivers and shop teams
People change habits when they see their own results and understand why they matter. Keep feedback practical and specific.
For drivers
- Show idle and inspection completion trends for their routes
- Explain how reported defects led to repairs
- Recognize improvement, not just top performers
For technicians
- Show repeat-repair and rework trends by job type
- Share which fixes cut fuel use or leaks
- Use findings to improve checklists and training
Examples of maintenance actions that feed the dashboard
Concrete actions make KPIs believable. Each of these produces a record that can be counted and trended.
- Record the reason for every replacement, so repeat failures stand out.
- Track parts reused or rebuilt where it is safe and suitable.
- Note when a repair restored fuel economy, so the link is visible next time.