Tires rank as the second-largest operating expense for most fleets after fuel, typically running $2,500–$4,000 per commercial vehicle every year, and the fleets that treat rubber as a serialized asset rather than a consumable are the ones that capture the savings hidden inside that spend. A disciplined lifecycle program—barcoding each casing at purchase, logging every mount and rotation, recording tread and pressure readings, and routing good casings back through retread—cuts tire cost-per-mile by 25–40% and turns a chaotic replacement cycle into a predictable procurement pipeline. This guide walks through the tracking mechanism, the four decision categories it powers, and the exact reports that move the needle. You can put the framework to work today when you Start Free Trial, or read on for the full strategy.
FLEET TIRE STRATEGY · 2026
Is your fleet spending $642,000 a year on tires it never fully uses?
A 200-truck fleet at $3,210 per vehicle per year burns roughly $642K on rubber. Without serialized tracking, 25–40% of that spend evaporates through missed retreads, premature replacements, and underinflation penalties. Lifecycle tracking reclaims it.
37%
Average fleet tire-spend waste
when casings aren't tracked
THE TRACKING MECHANISM
One tire, one identity, from mount to final scrap
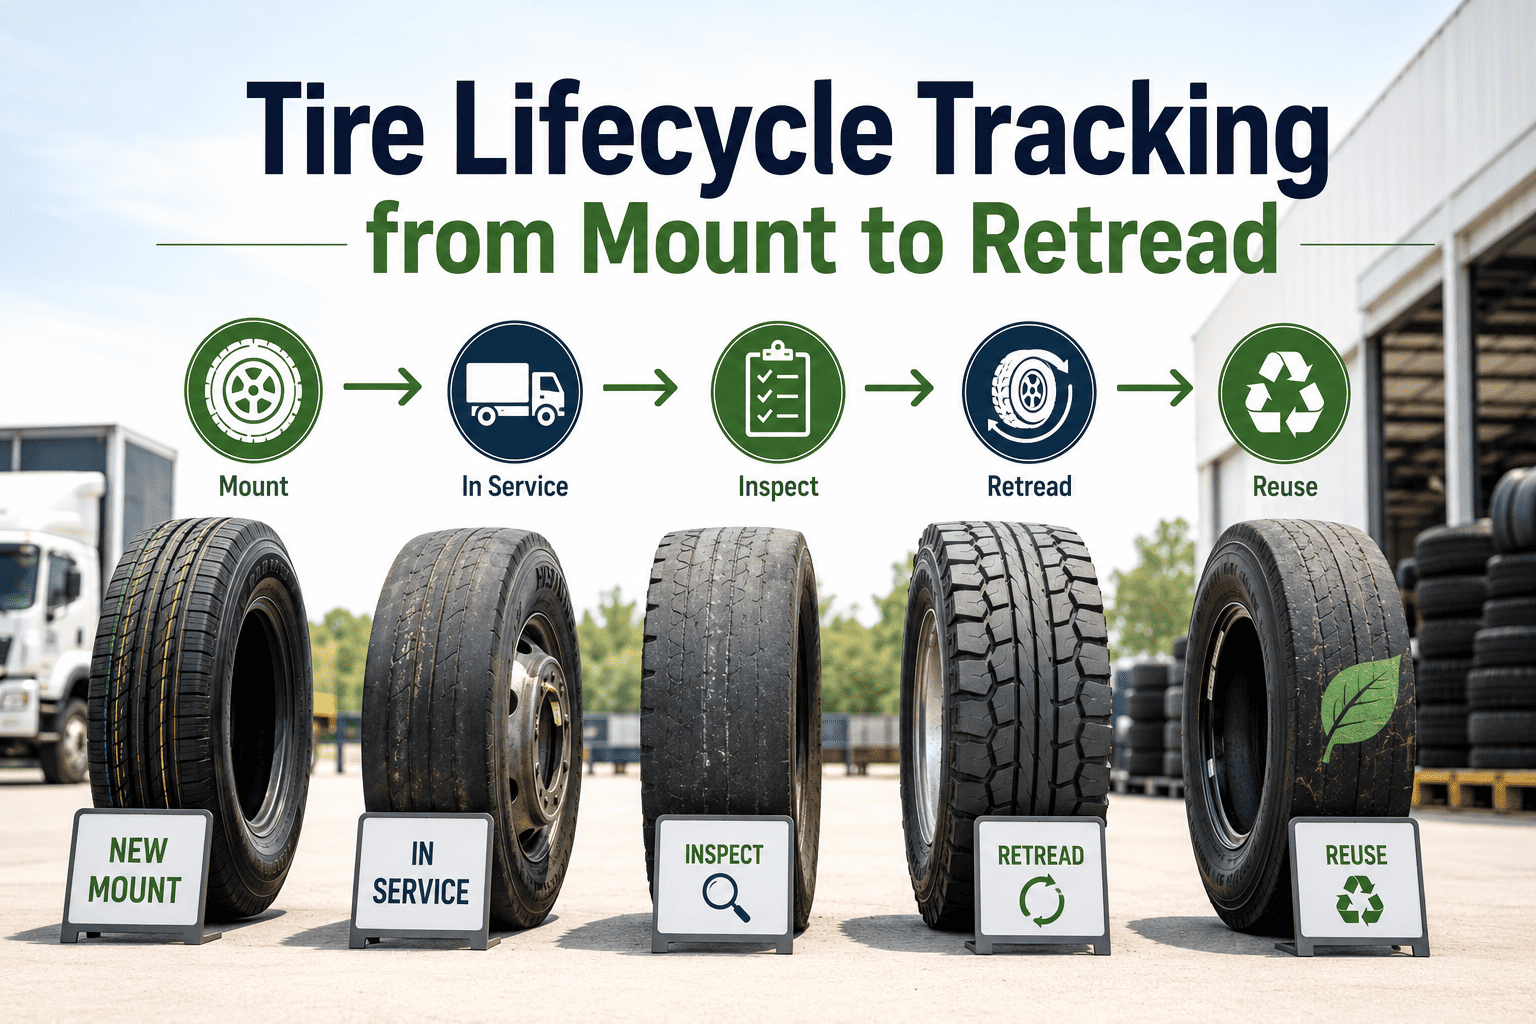
Tire lifecycle tracking treats every casing as a serialized capital asset. Each tire carries its DOT code plus an internal barcode or RFID tag, is assigned to a specific axle position on a specific vehicle, and accumulates a complete event history across its working life—typically 3–5 years and one to three retread cycles.
01
Identify
DOT code + barcode or RFID tag assigned at receiving. One record per casing, forever.
02
Mount & Position
Logged to vehicle ID and axle position (steer, drive, trailer, inner/outer). Every move timestamped.
03
Inspect
Tread depth per position, pressure from TPMS or manual gauge, recorded at every PM interval.
04
Rotate
Side-to-side, cross-axle, or front-to-rear rotations logged so wear patterns are traceable.
05
Retread
Casing inspected, retreaded at ~$130, remounted with new DOT and continued history.
06
Scrap
Final disposition recorded—scrap, warranty return, or sale—with reason code and mileage.
THE NUMBERS THAT MATTER
What every fleet tire actually costs you
Before you can manage tire spend you have to measure it per casing, per axle, per mile. These four benchmarks define the baseline every lifecycle program is judged against.
$2,500–$4,000
Annual tire spend per commercial vehicle
25–40%
Spend lost to poor tracking & underinflation
1–3
Retread cycles per casing before scrap
30–50%
More casings captured for retread vs. un-tracked
FOUR DECISIONS THE DATA DRIVES
From raw tracking data to fleet-wide savings
Lifecycle data is only valuable if it changes a decision. Here are the four decision categories tire tracking directly powers—and what each one is worth.
DECISION 1
Replacement timing & procurement
Projected replacement dates based on wear rate let procurement order ahead at contract pricing instead of paying emergency retail markup. A 200-truck fleet ordering 80 steers a quarter at contract saves $35–$60 per tire versus spot buys—roughly $14K–$19K per year on steers alone.
DECISION 2
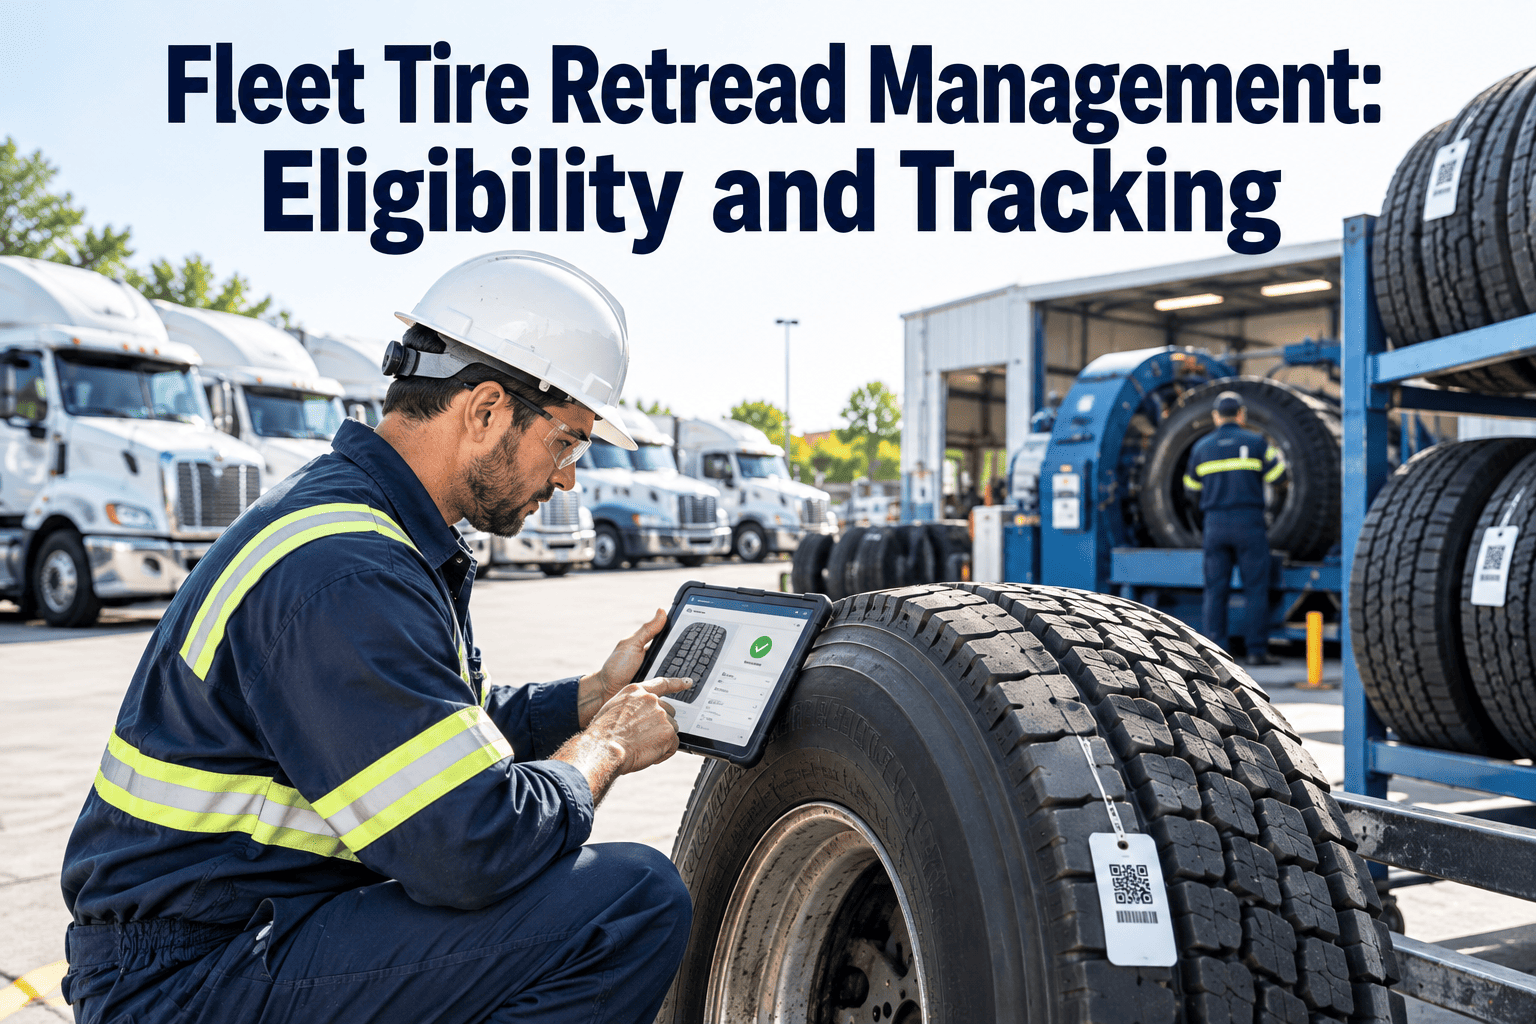
Retread eligibility at removal
Casing condition captured at removal decides whether the casing retreads (~$130) or scraps ($0). Structured tracking captures 30–50% more retreadable casings than un-tracked programs, turning would-be scrap into running rubber. Each saved retread casing is worth ~$90 over a new tire.
DECISION 3
Brand & model performance
Cost-per-mile by tire model reveals which brands actually deliver on lifecycle cost versus sticker price. A premium drive tire at $520 that runs 270K miles with one retread often beats a budget tire at $380 that scraps at 160K—data replaces opinion in the next bid cycle.
DECISION 4
Defect & failure trend detection
Repeat blowouts or fast wear on the same axle position across multiple vehicles point to alignment, suspension, or spec issues—not the tire. Catching a right-rear trailer alignment problem can save $8K–$15K per year in rubber on a 50-trailer fleet.
MONTH-BY-MONTH
The tire lifecycle timeline, from delivery to scrap
A single casing moves through roughly eight lifecycle events over three to five years. Here's what a tracked casing looks like from cradle to grave.
Month 0
Receiving & ID assignment — DOT logged, barcode/RFID applied, added to fleet inventory
Month 0
Initial mount — assigned to vehicle and axle position, mount date and pressure recorded
Month 3
First PM inspection — tread depth measured (e.g., 14/32″ steer), pressure logged via TPMS
Month 8
Rotation event — side-to-side or cross-axle move, new position logged, wear pattern noted
Month 14
Removal at 4/32″ — casing inspected, sent to retread, mileage frozen at ~175,000
Month 15
Retread complete — new tread applied at $130, new DOT, remounted on drive axle
Month 28
Second removal — casing fails inspection, marked for scrap, reason code "belt separation"
Month 28
Final disposition — scrapped at 312,000 total miles, full history archived for warranty audit
BRAND vs BRAND
Cost-per-mile comparison across four tire models
Sticker price tells you nothing. This table shows what four common drive-tire models actually cost per mile when tracked across a real fleet—purchase, retread, and total service miles included.
| Tire Model |
Purchase Price |
Retreads |
Total Miles |
Lifecycle Cost |
Cost / Mile |
| Premium Drive A |
$520 |
1 × $130 |
295,000 |
$635 |
$0.00215 |
| Mid-Tier Drive B |
$445 |
1 × $130 |
240,000 |
$545 |
$0.00227 |
| Budget Drive C |
$380 |
0 (casing fail) |
165,000 |
$380 |
$0.00230 |
| Premium Drive D |
$540 |
2 × $130 |
380,000 |
$760 |
$0.00200 |
Model D costs $160 more upfront than Model C yet delivers 15% lower cost-per-mile—visible only when you track the full lifecycle.
REAL-WORLD PAYBACK
A 180-truck fleet that found $217,000 in hidden tire spend
Midwest regional carrier · 180 power units · 420 trailers
BEFORE TRACKING
$578K
Annual tire spend with manual spreadsheets, no retread routing, reactive spot-buy purchasing.
→
AFTER 12 MONTHS
$361K
Serialized tracking + retread routing + contract ordering. Retread capture up 42%, blowouts down 31%.
$217,000
annual savings · payback in under 4 months · 37% reduction in cost-per-mile
READY TO TRACK EVERY CASING?
Stop buying tires you already own.
Oxmaint turns every tire into a tracked asset—barcode or RFID, TPMS integration, per-tire cost-per-mile for the full population. See it in 30 minutes.
FREQUENTLY ASKED
Tire lifecycle tracking, answered
What's the minimum data I need to capture per tire to make tracking worthwhile?
DOT code, internal barcode or RFID, purchase date and source, current vehicle and axle position, mount date, and tread-depth reading at every PM. Pressure history from TPMS or manual checks adds the predictive layer. Anything less and you're tracking inventory, not lifecycle. You can stand this up in Oxmaint in a day—
Start Free Trial to begin.
How does tracking capture 30–50% more casings for retread?
Without tracking, casings get pulled and scrapped reactively—often by a shop tech who doesn't know the casing's age, retread count, or wear history. Tracked casings arrive at removal with a full record, so the retread shop can confidently accept good casings and reject only the ones that genuinely fail inspection. The data removes the guesswork.
Should I use barcodes or RFID tags?
Barcodes are cheaper (~$0.10 each) and work fine for shops where tires are handled at a stationary rack. RFID (~$1.50–$3 per tag) reads through sidewalls and mud, making it better for yard inventories and automated gate scans. Most fleets start with barcodes and add RFID for high-volume yards. Oxmaint supports both natively.
How quickly can a tire tracking program pay for itself?
Typical payback is 3–5 months for a fleet of 100+ vehicles. The savings come from three places: captured retreads (~$90 per saved casing), avoided emergency spot-buys (~$35–$60 per tire), and reduced blowout roadside calls (~$800–$1,200 each). A 180-truck fleet usually sees $150K–$250K in annual savings against a software cost under $15K.
Can tracking really detect vehicle-level defects, not just tire problems?
Yes. When the same axle position on the same vehicle model repeatedly shows accelerated wear or repeat failures, the tire isn't the problem—the alignment, suspension, spec, or driver route is. Pattern analysis across the fleet isolates these systemic issues in weeks, not years. Want to see the defect-detection reports?
Book a Demo.
YOUR TIRES ARE TALKING. ARE YOU LISTENING?
Turn every casing into a tracked, retreadable, cost-optimized asset.
Join the fleets saving 25–40% on tire spend with serialized lifecycle tracking, TPMS integration, and per-tire cost-per-mile reporting in Oxmaint.
Free 14-day trial · No credit card