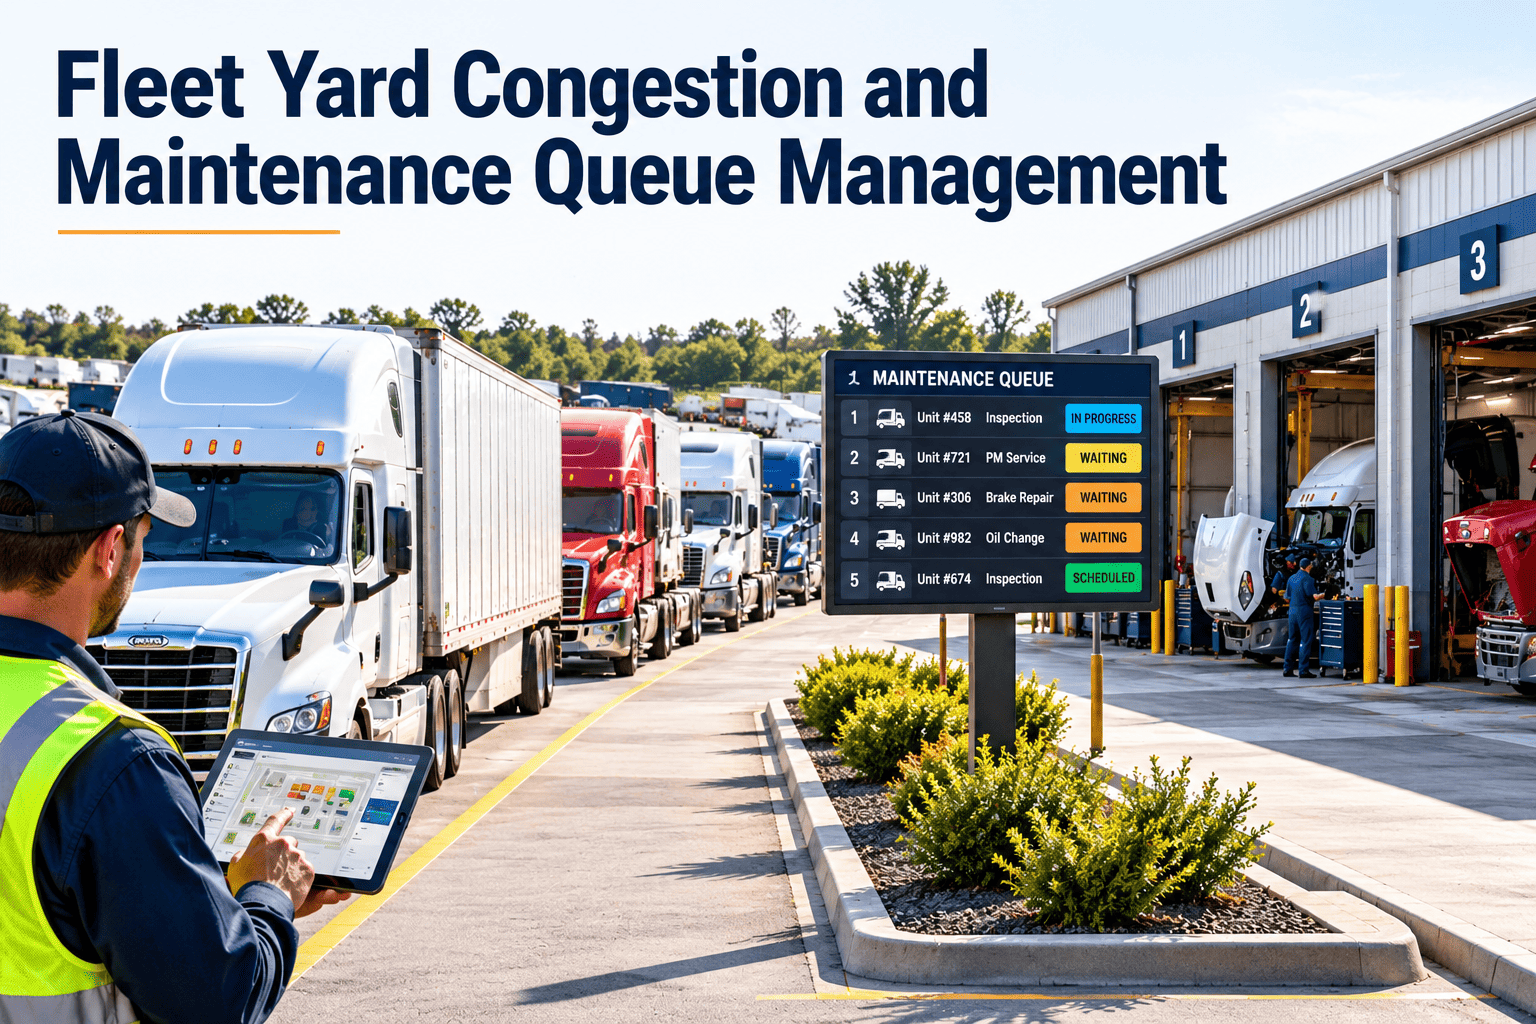
A crowded yard is rarely a parking problem. It is a maintenance flow problem that shows up as vehicles blocking bays, drivers waiting for keys, and technicians walking past units that are not ready to be worked on. When repairs stall, the queue grows and every new arrival makes the next one slower. Fleets that treat the yard as a managed system, with clear queues, priorities, and timestamps, recover bay hours that were being lost to waiting. Tracking each stage in maintenance management software gives supervisors the data to find where the line is actually stuck.
Fleet Yard Congestion and Maintenance Queue Management
Where Yard Congestion Really Comes From
Congestion is a symptom. The visible pile of vehicles usually traces back to a handful of causes in how work is scheduled, diagnosed, supplied, and approved.
| What You See in the Yard | Likely Root Cause | What to Check |
|---|---|---|
| Many units arriving at once | PM due dates cluster, or all vehicles return at shift end | Distribution of PM due dates and arrival times by weekday |
| Units sitting in bays with no one working | Waiting for parts, approval, or a second technician | Status history showing time in each waiting state |
| Quick services stuck behind long repairs | One shared queue for all work types | Whether short PMs have a separate lane or bay |
| Repeat visits for the same fault | Incomplete diagnosis or unverified repair | Repeat work orders on the same asset within a short window |
| Drivers waiting at the counter | No check-in process, unclear status, or missing defect details | Time from arrival to a work order being opened |
| Finished units not released | Paperwork, final inspection, or dispatch not informed | Time between repair complete and release |
Why Waiting Costs More Than Bay Hours
A vehicle that waits in the yard is not earning revenue, and it is not being repaired either. The cost of that wait spreads across several parts of the operation.
Operational impact
- Routes are covered by spare units or cancelled
- Dispatch loses confidence in return-to-service times
- Drivers wait or are reassigned, adding labor cost
- Planned PM is skipped when bays are full of urgent work
Maintenance impact
- Skipped PM leads to more breakdowns, which add to the queue
- Technicians lose time searching for vehicles and parts
- Overtime rises as work piles up at shift end
- Repair quality drops when jobs are rushed to free a bay
This feedback loop is the real danger. Congestion causes PM to slip, slipped PM creates breakdowns, and breakdowns create more congestion.
What Little's Law Says About Your Shop
Queueing theory offers a simple relationship that applies to any stable process. The average number of items in the system equals the rate at which they leave multiplied by the average time each one spends inside.
The practical lesson is that the yard fills when cycle time rises, even if arrivals stay the same. Cutting the days a vehicle spends waiting reduces the number of vehicles on the lot without adding a single bay.
A Maintenance Queue Is Really Several Queues
Treating all work as one line forces short jobs to wait behind long ones. Splitting the queue by work type lets each lane run at its own pace and makes bottlenecks easier to see.
| Queue | Entry Rule | Typical Bottleneck | Rule to Keep It Moving |
|---|---|---|---|
| Quick PM | Scheduled service with a known task list and parts kit | Missing filters or fluids at the bay | Dedicated lane and pre-kitted parts for each service type |
| Inspection and annual | Regulatory inspections with fixed due dates | Findings that trigger unplanned repairs | Book slots early and reserve capacity for repairs found |
| Light repair | Short corrective jobs such as lamps, hoses, and minor adjustments | Diagnosis time | Time limit for diagnosis before the job moves to heavy repair |
| Heavy repair | Engine, transmission, axle, and electrical work | Parts lead time and technician skill | Early parts ordering and assignment by certification |
| Tire and wheel | Tire replacement, rotation, and wheel-end work | Equipment availability and stock sizes | Separate bay or mobile service with a stock check at triage |
| Hold area | Units waiting on parts, approval, or a vendor | Vehicles forgotten once they leave the bay | Owner, reason code, and review at every shift start |
Triage: Deciding Who Goes First
Without written rules, the loudest request wins the next bay. A two-factor triage matrix replaces that with a consistent decision based on safety and operational need.
Document the matrix, apply it at check-in, and record the assigned priority on the work order. When someone requests an exception, the record shows who approved it and why.
Give Every Vehicle a Visible Place in the Queue
Follow a Vehicle From Gate to Release
Each handoff is a place where time disappears. Capturing a timestamp at each one turns a vague sense of delay into measurable segments.
Walk-In Culture Versus Scheduled Flow
Walk-in culture
- Vehicles arrive at shift end, all at once
- Bay assignment depends on who speaks first
- Parts are requested after diagnosis
- Status is known only by asking technicians
- PM competes with emergency repairs for the same bay
Scheduled flow
- PM appointments are spread across days and shifts
- Priority rules decide the next unit
- Parts are kitted before the vehicle arrives
- Status is visible on the work order and board
- Reserved repair capacity absorbs unplanned arrivals
Level the load by assigning PM due dates across the week instead of letting them cluster. Keep some capacity open each day for repairs found during inspections and for breakdown tows.
Parts and Approvals: The Hidden Yard Blockers
Many units that look like they are in repair are really waiting. The two most common waits are parts and approval, and both can be reduced before the vehicle reaches the bay.
Reduce parts waits
- Build PM parts kits for each service type
- Link parts lists to recurring PM work orders
- Set min and max stock levels for fast-moving items
- Check stock at triage, not after diagnosis
- Track vendor lead times for non-stocked items
Reduce approval waits
- Set spending limits that technicians can approve
- Route larger estimates to a named approver
- Show approval age on the work order
- Escalate approvals that exceed a set time
- Pre-approve common repairs by vehicle class
Handling Breakdown Arrivals Without Breaking the Schedule
Towed and roadside-recovered vehicles arrive without warning. If the shop has no plan for them, they displace planned PM and push the queue further behind.
- Reserve a fixed share of daily capacity for unplanned arrivals, and adjust it from your own history of breakdown volume.
- Assign one lead technician each shift to run quick diagnosis on unplanned units so they do not stall the whole line.
- Decide in advance which planned work can move when a priority 1 unit arrives, and which cannot.
- Record the reason for every schedule change so repeated disruptions can be traced to their source.
KPIs for Yard Flow and Queue Health
| KPI | How It Is Measured | What a Rising Value Tells You |
|---|---|---|
| Wait before bay | Time from arrival to bay start | Capacity, triage, or scheduling problem |
| Repair cycle time | Time from arrival to release | Overall flow is slowing |
| Hands-on time ratio | Technician work time divided by total time in the shop | Falling ratio means more waiting than working |
| Hold area dwell | Time in waiting states by reason | Parts, approvals, or vendors are the constraint |
| Bay utilization | Time a bay is occupied by active work | Low values suggest blocked bays, not spare capacity |
| Release delay | Time from repair complete to return to service | Final inspection or dispatch handoff gaps |
| Repeat visit rate | Return visits for the same fault within a set window | Diagnosis or verification quality issues |
A Shift-Start Huddle That Keeps the Queue Honest
A ten-minute review at the start of each shift catches stalled units before they become the next crisis. Keep the agenda fixed so it stays short.
Yard Layout and Visual Management Rules
- Park units by status, not by arrival order, so ready units are never blocked by units on hold.
- Keep the hold area separate from the bay approach so waiting vehicles do not obstruct active work.
- Use a consistent tag or board color for each status, and make the same status appear on the work order.
- Assign one person per shift to review the hold area and push each unit to a decision.
- Keep keys and paperwork with the work order so completed vehicles can be released without a search.
- Mark out-of-service units clearly so they cannot be dispatched by mistake.
How Oxmaint Supports Queue and Yard Management
Queue control depends on a single, current picture of work. Oxmaint maintenance management software supports that picture through the following capabilities.
| Yard Problem | Oxmaint Capability |
|---|---|
| No visibility of what is in the shop | Work order status tracking with priorities, assignments, and due dates |
| PM due dates cluster | Preventive maintenance scheduling by mileage, hours, or calendar to spread load |
| Parts delays at the bay | Inventory tracking with parts linked to work orders and reorder visibility |
| Defects reported but not scheduled | Mobile inspections that convert defects into work orders |
| Unclear repair history | Asset history showing past repairs, parts, and repeat issues per vehicle |
| Flow metrics built by hand | Dashboards and reports on work order ageing, backlog, and completion times |
Common Queue Management Mistakes
- Adding bays before measuring how much time vehicles spend waiting.
- Letting units stay in a bay while waiting on parts.
- Using one status such as in progress for every state of work.
- Scheduling all PM at the end of the month or the same day of the week.
- Ignoring the release step, where finished vehicles can sit for hours.
- Measuring only repair time and missing the waiting time around it.
- Assigning priorities verbally, so no record exists of why one vehicle went ahead of another.
- Closing work orders at the end of the repair and losing the release and paperwork time from the data.
- Reviewing queue metrics monthly instead of weekly, when the causes are already forgotten.