A vehicle inspection failure program is not a folder of checklists — it is a closed loop that turns every defect a driver spots into a scheduled repair before that defect becomes a roadside breakdown. Most fleets already run inspections, yet they still average 8.7 days of unplanned downtime per vehicle each year, because findings die on paper instead of triggering work. This guide walks you through building a program that actually reduces downtime, from baseline data to predictive alerts. Sign Up Free and start closing the loop from day one.
Turn Inspection Findings Into Fewer Breakdowns
OxMaint links every failed inspection item to a work order, tracks defect-to-repair time per asset, and surfaces the recurring failures that quietly drain your uptime — so your program reduces downtime instead of just documenting it.
Why Most Inspection Programs Fail to Reduce Downtime
The problem is rarely a missing inspection. It is the gap between finding a defect and fixing it. A 5-minute walk-around under time pressure misses issues, a paper checklist gets pencil-whipped, and a reported fault never becomes a work order. Studies show 43% of vehicles have critical issues missed on paper checklists, and the majority of unplanned downtime is gradual deterioration — brakes, tires, fluids, batteries — that was detectable long before failure. A downtime-reducing program closes every one of those gaps. Book a Demo to see the closed loop in action.
- Findings recorded but never converted to a work order
- No timestamp or photo — defects are unverifiable at audit
- Repeat failures invisible because data is scattered across binders
- Time-based service only; no reaction to actual condition
- Every failed item auto-generates a tracked work order
- GPS, timestamp, and photo attached to each finding
- Recurring failures surface as trends across the fleet
- Defect data feeds predictive alerts weeks ahead of failure
The 5-Phase Roadmap to a Downtime-Reducing Program
You cannot skip stages — the average carrier runs 10,600 miles between breakdowns, while top-performing fleets reach over 75,000 miles, and that 7x difference maps directly to program maturity. Each phase builds the data foundation the next one needs. Sign Up Free to start at Phase 1 today.
Baseline your current downtime and defect data
Before changing anything, measure it. Capture current unplanned downtime hours per vehicle, average defect-to-repair time, and your scheduled-versus-unscheduled service ratio. Most programs average 55% scheduled versus 39% unscheduled — the goal is a 70/30 split. You cannot prove a program reduced downtime without a starting number.
Replace paper inspections with guided digital DVIRs
This is the single biggest leap in maturity. Digital inspections identify 40% more defects than paper and push completion rates from 60–75% up past 95%. Guided checklists with required photo and signature fields make pencil-whipping impossible and create the data layer everything else depends on.
Auto-generate work orders for every failed item
This is where a program starts reducing downtime. Each defect classified as Repair or Out of Service must create a work order automatically, with parts and technician assignment, before the vehicle is cleared. An inspection that logs findings but creates no work orders guarantees those findings resurface as breakdowns.
Analyze defect trends to target prevention
With clean digital data, patterns emerge: which vehicles, components, and routes generate the most downtime. Data-driven fleets cut maintenance costs by moving from reactive to proactive, and defect trend analysis tells you exactly where to focus PM before failures cluster.
Layer predictive alerts on your highest-value assets
Once inspection and repair history is clean, predictive analytics forecasts failures 2–4 weeks ahead with 85–92% accuracy. Start a 90-day pilot on your five highest-risk vehicles. The first prevented failure typically pays for the system, and downtime drops 32–45% at this stage.
Build Every Phase on One Platform
OxMaint runs digital DVIRs, auto-generated work orders, defect trend analytics, and AI predictive maintenance in a single system — so you advance from paper to predictive without ever switching tools or losing your data history.
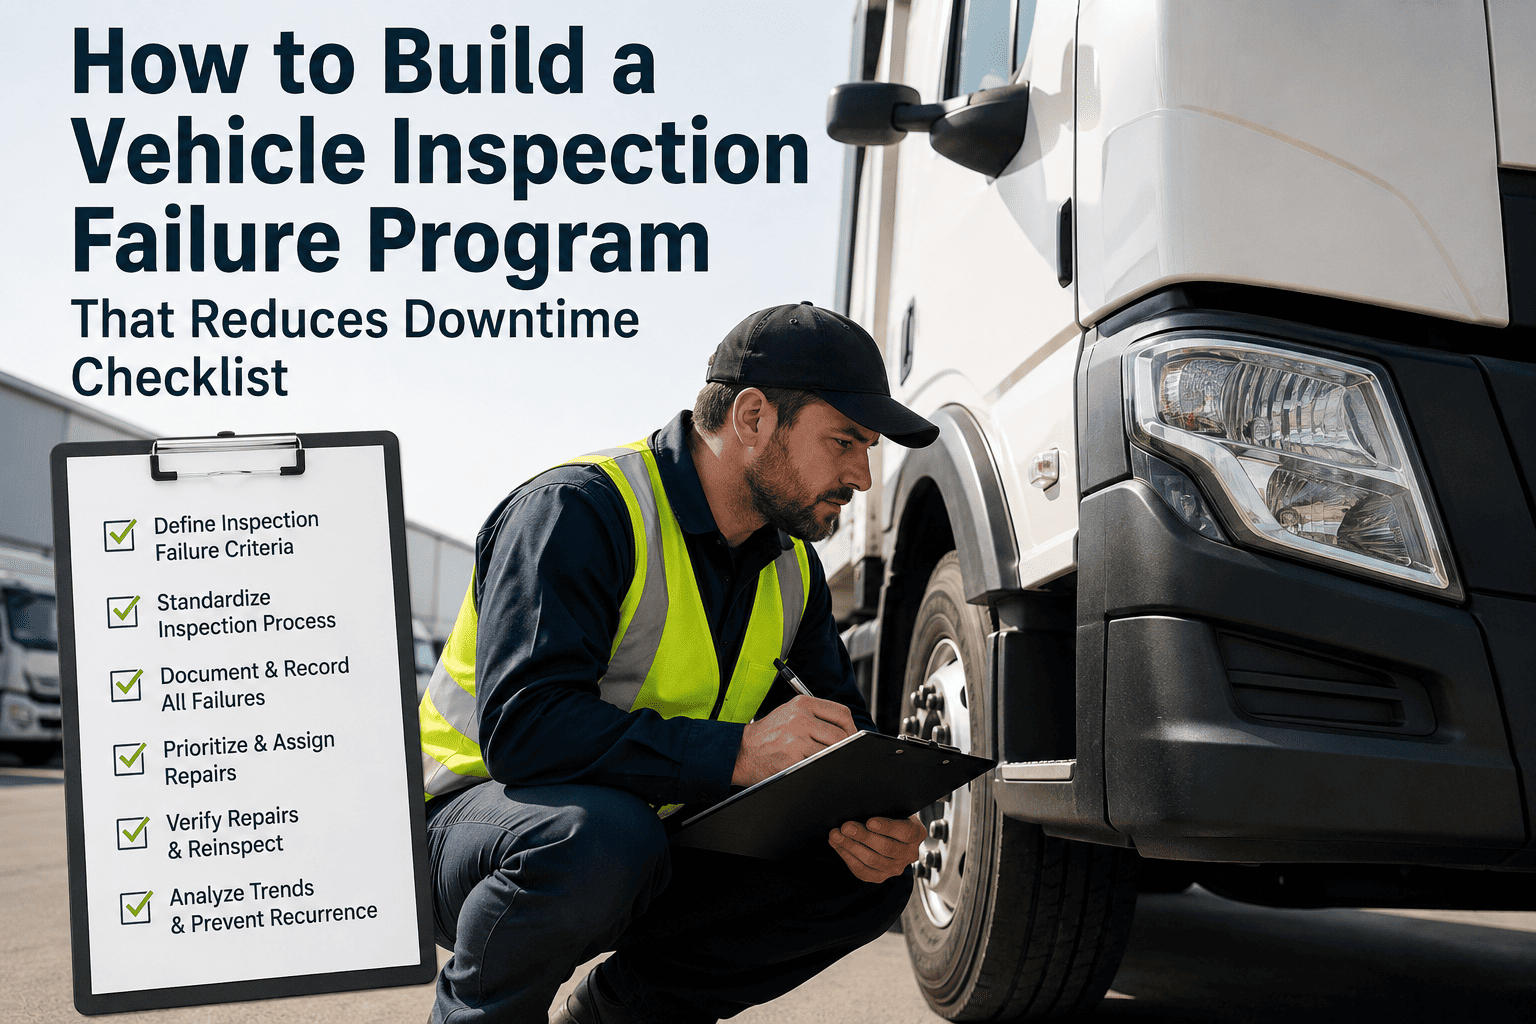
Program Build Checklist — What to Put in Place
Use this as your implementation punch list. Each item is a component of a program that reduces downtime rather than just satisfying a regulation. Work top to bottom — the foundational items enable the advanced ones.
Guided digital pre-trip and post-trip DVIR templates
Build component-specific checklists for each vehicle class with required photo fields on defect items. A DVIR that captures every safety-critical component and forces documentation is the foundation the entire program stands on.
Defect severity classification on every finding
Every item must be logged as Pass, Monitor, Repair Before Next Use, or Out of Service. Clear severity levels drive the right action and let the system decide what blocks dispatch versus what schedules ahead.
Automatic work order generation for Repair and OOS items
The system must not accept an inspection close-out with open Repair or OOS findings and no linked work order. This single rule is what converts an inspection program into a downtime-reduction program.
Defect-to-repair time tracking per asset
Measure how long each defect stays open. Rising defect-to-repair time is an early warning that shop capacity or parts availability is about to cause downtime. This metric proves the program is working.
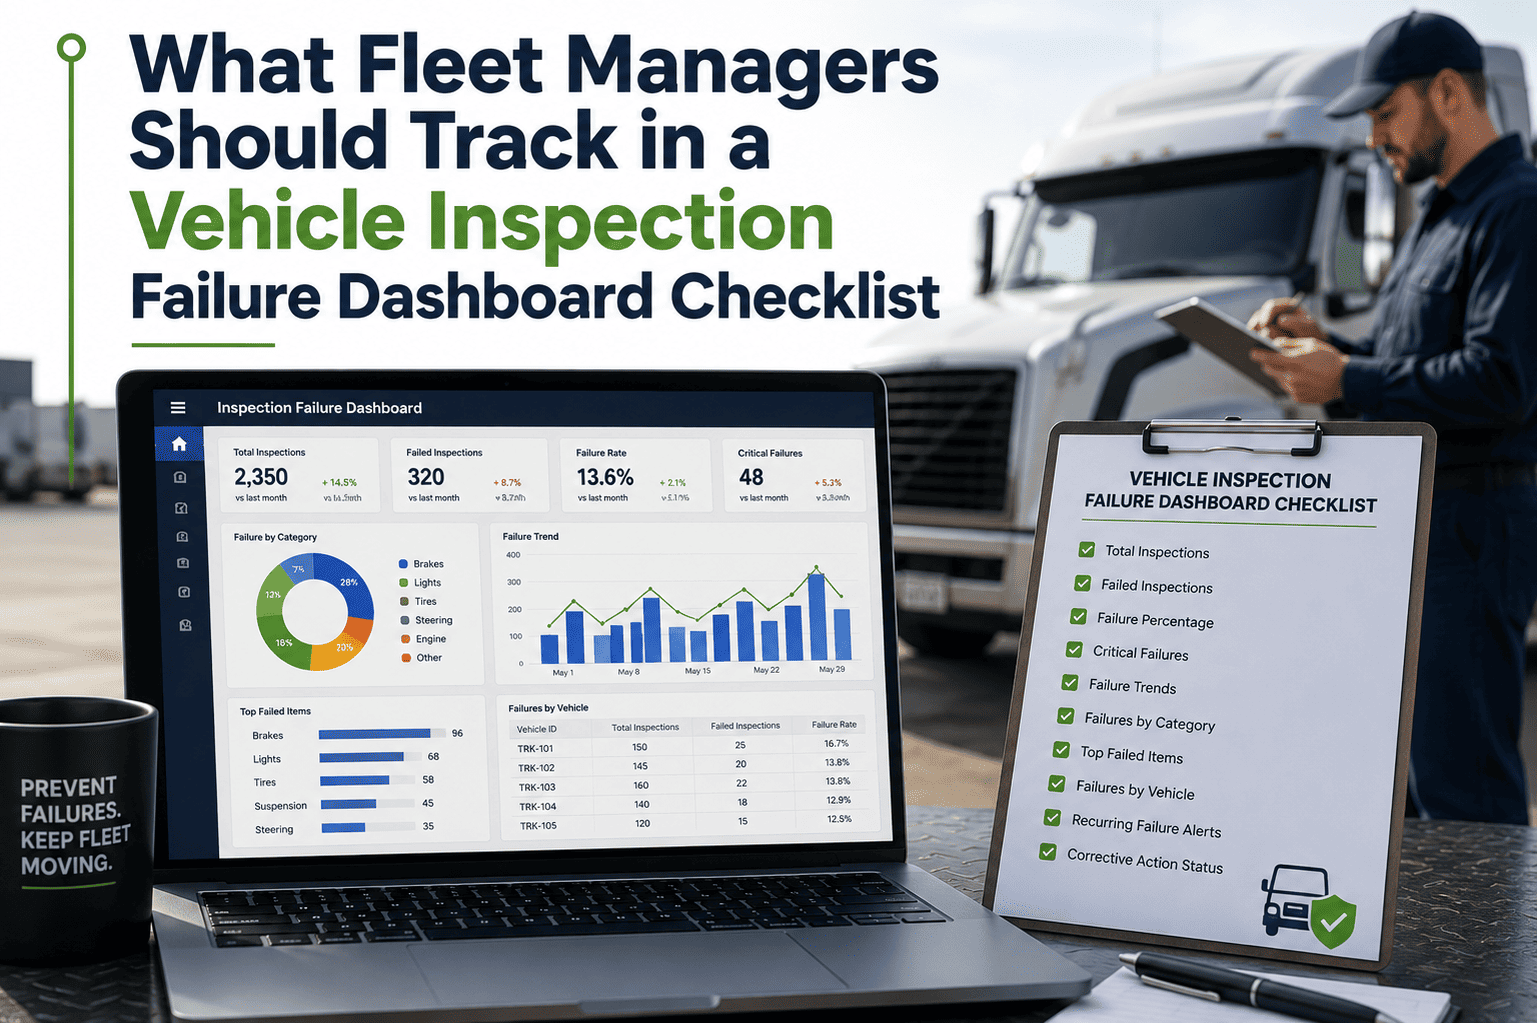
Recurring-failure trend dashboard
Surface the components and vehicles that fail repeatedly. Targeting the recurring 20% of assets that cause most downtime delivers the biggest return on prevention effort.
Predictive maintenance pilot on critical assets
Layer AI failure forecasting on your highest-value vehicles once you have clean history. Predictions 2–4 weeks ahead move repairs into planned downtime windows and cut unplanned stops by 32–45%.
What Reducing Downtime Actually Delivers
The financial case for a mature program is not marketing — it is documented across fleet operations of every size. As your program advances through the phases, the returns compound. The table below scrolls horizontally on mobile so you can compare every stage.
| Program stage | Unplanned downtime | Maintenance cost | Typical ROI |
|---|---|---|---|
| Paper-based, reactive | Highest — 100% unplanned | Emergency repairs 3–9x planned cost | None |
| Digital DVIRs live | 40% more defects caught | Fewer emergency repairs | ROI in 60–90 days |
| Work orders auto-linked | Defects fixed before failure | 20–30% lower maintenance cost | 300–400% |
| Trend analytics active | Targeted prevention | 10–15% lower total cost of ownership | 250–400% in 18 months |
| Predictive on critical assets | 32–45% reduction | 20–40% lower maintenance cost | 500%+ cumulative |
We were running inspections on paper across 40 trucks and still getting blindsided by roadside failures. Once every failed item started generating a work order automatically, our unscheduled repairs dropped by nearly a third in one quarter. The predictive alerts caught two engine issues weeks before they would have stranded a driver.
— Fleet Maintenance Director, regional distribution operation, 40 vehicles
Frequently Asked Questions
The questions fleet managers ask most often when building an inspection program designed to reduce downtime rather than simply pass audits.
Start by digitizing DVIRs — it is the single biggest maturity leap and catches 40% more defects. Then baseline your current downtime so you can measure improvement. Sign Up Free to launch digital inspections in minutes.
The key is auto-generating a work order for every failed item so defects get fixed on schedule instead of becoming breakdowns. Trend data and predictive alerts then prevent the recurring failures before they occur.
No. Predictive AI is the final phase and needs clean history first. Digital DVIRs, severity classification, and auto work orders deliver most of the downtime reduction and build the data foundation AI later learns from.
Digital inspection programs commonly show first ROI within 60–90 days, and many fleets reach positive ROI in under 6 months. Predictive pilots often pay back on the first prevented failure.
Yes. OxMaint gives each vehicle its own inspection templates, defect history, and work order log, with a unified dashboard across every location. Book a Demo to see the multi-site view.
Build a Program That Reduces Downtime — Starting Today
OxMaint gives fleet maintenance teams the full stack to build a downtime-reducing inspection program: guided digital DVIRs, auto-generated work orders for every defect, trend analytics, and AI predictive maintenance — all in one platform that grows from paper replacement to predictive intelligence.