Unplanned brake downtime costs commercial fleets an average of $448 to $760 per hour in lost productivity — and brake-related breakdowns account for roughly 1 in 4 unscheduled repair events across heavy commercial vehicle fleets. The difference between fleets with chronic brake downtime and those that maintain near-zero unplanned brake failures is not the quality of their parts — it is the quality of their program. A structured brake inspection workflow built on clear inspection stages, measured thresholds, technician accountability, and digital documentation transforms brake maintenance from a reactive cost center into a predictable, budget-controlled program. This guide walks through exactly how to build that program: from setting inspection standards to building the CMMS workflows that make it self-sustaining. To see how OxMaint supports this for your fleet, sign up free or book a demo.
Fleet Program Design · Brake Maintenance · Downtime Reduction 2026
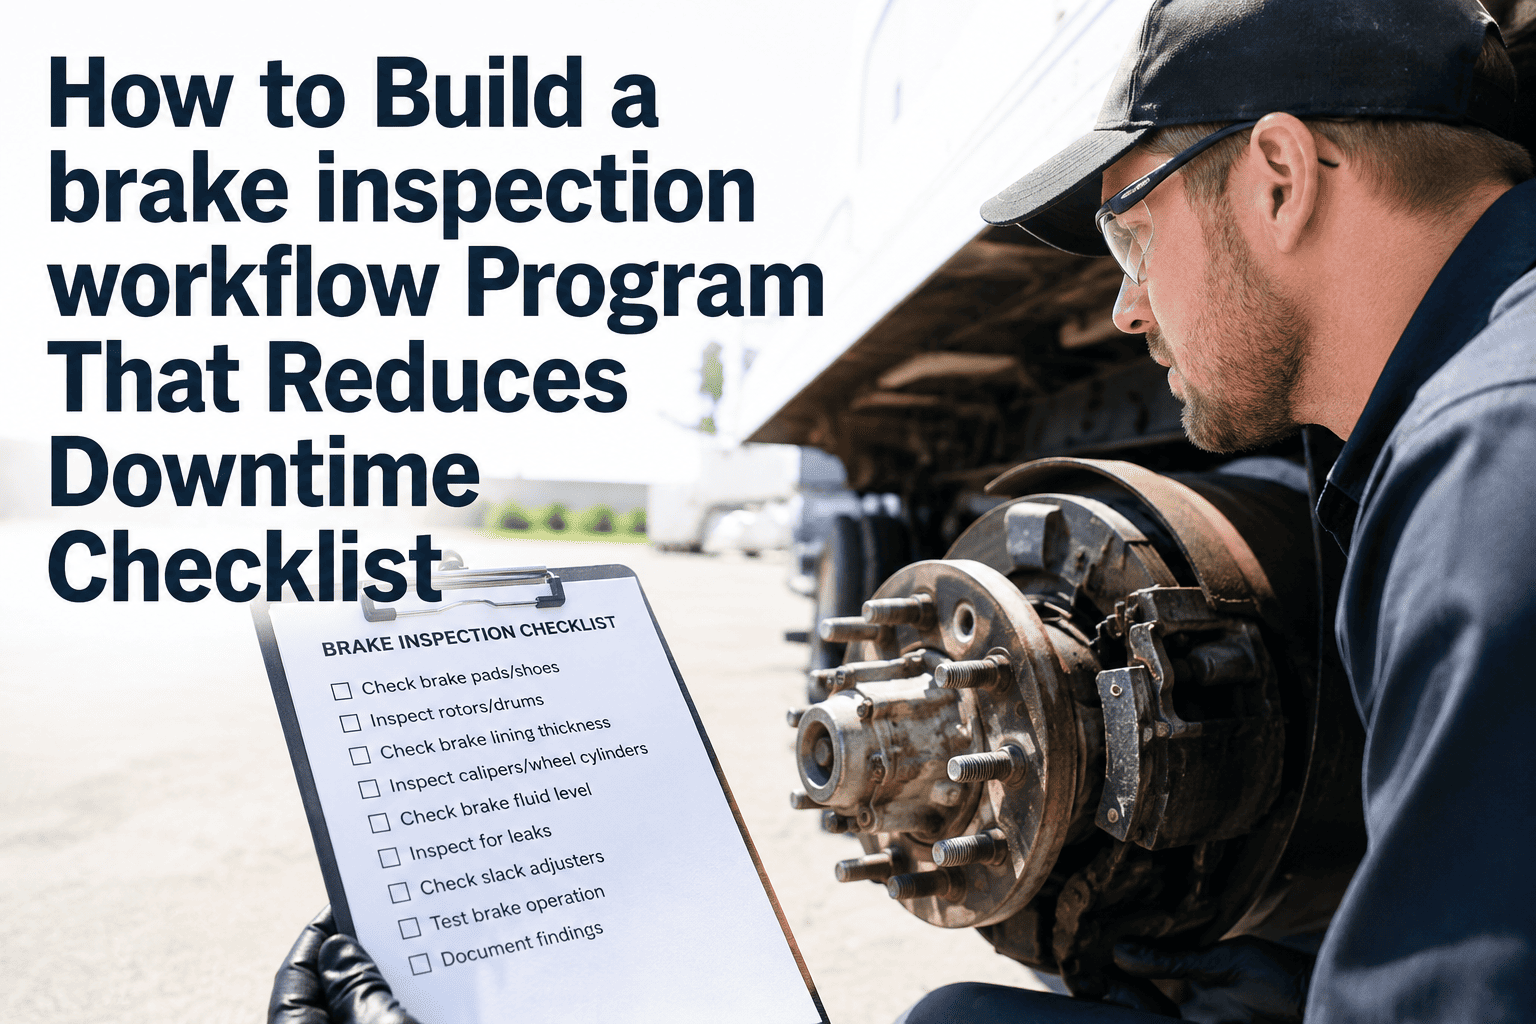
How to Build a Brake Inspection Workflow That Eliminates Unplanned Downtime
The fleets with the lowest brake downtime are not lucky — they built a system. Here is the complete program blueprint: inspection stages, technician accountability, CMMS workflows, and the metrics that tell you it is working.
$760/hr
Average cost of unplanned brake downtime per vehicle per hour
25%
Of all unscheduled repairs are brake-related — the most preventable category
60%
Reduction in unplanned brake events for fleets that implement structured inspection workflows
Program Architecture
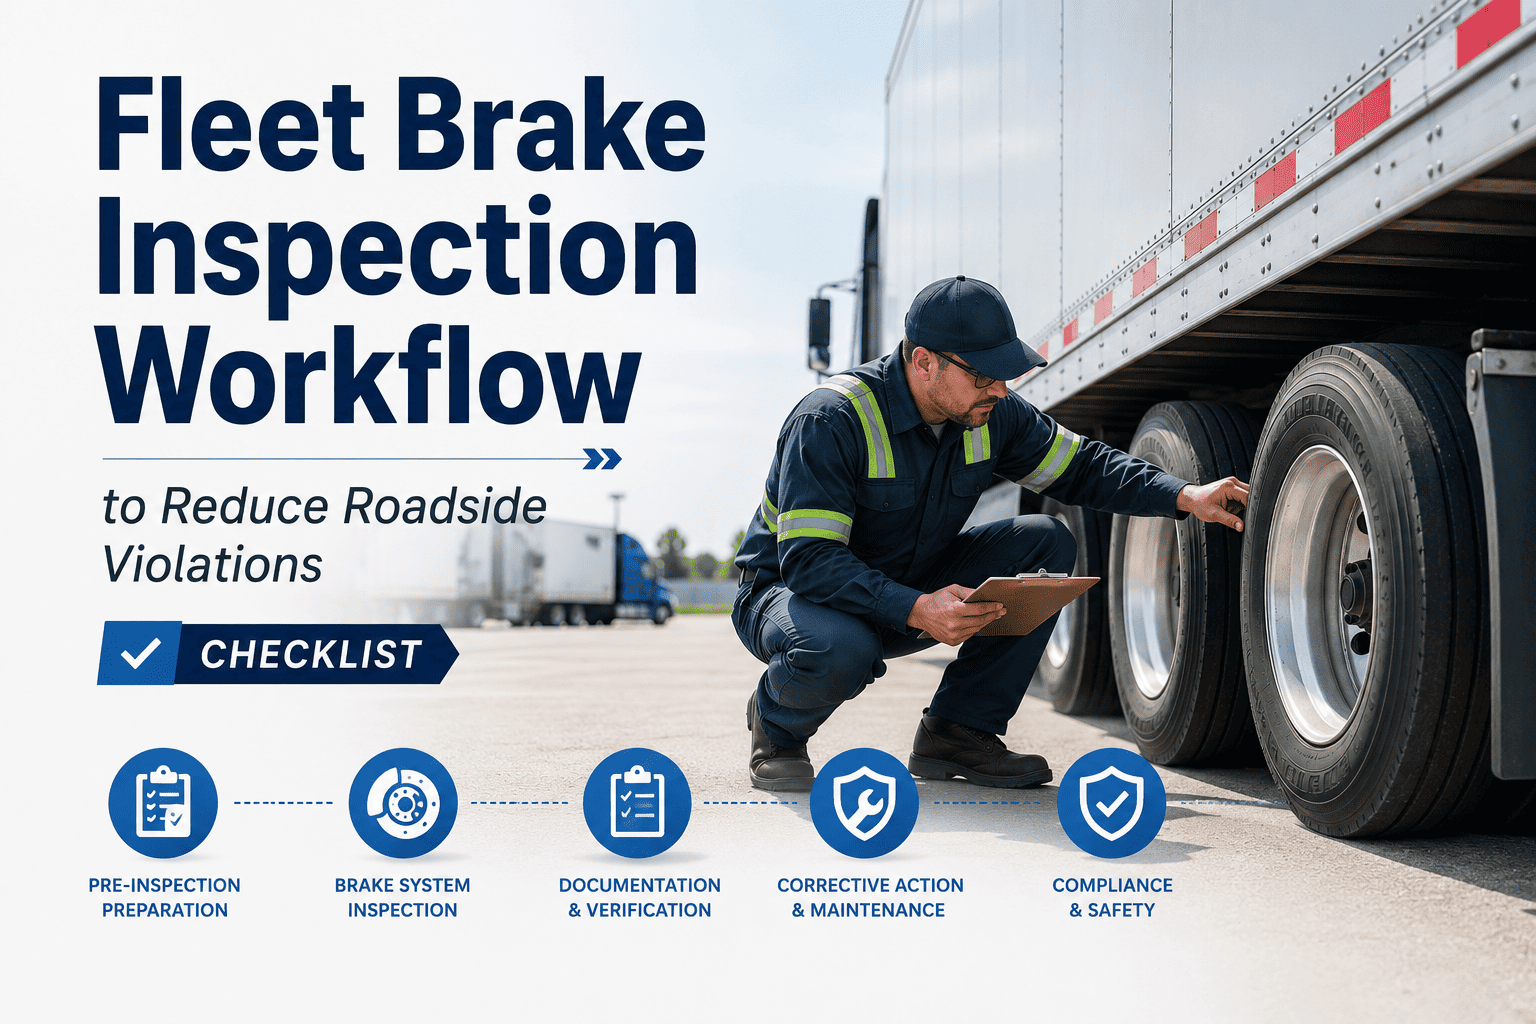
The 4-Stage Brake Inspection Program Framework
An effective brake inspection program is not a single inspection — it is four layered stages, each catching what the previous one cannot, each producing data the next one uses. Here is how to structure them.
Stage 1 · Daily
Driver Visual & Sensory Check
Who: Driver · Time: 5–8 min
The driver is the first sensor in your brake system. Properly trained drivers catch visible damage, air leaks, unusual pedal feel, and pulling during the pre-trip — often before any instrument would detect a problem. This stage catches roughly 40% of brake defects before they become failures.
Output: Timestamped mobile DVIR with photo documentation
Stage 2 · Weekly
Technician Measured Inspection
Who: Certified Technician · Time: 20–30 min
The measured inspection adds calibrated instrument checks: push rod stroke by chamber, lining thickness by axle position, air system leak rate. These readings, logged by position over time, are the foundation of your predictive replacement program and your DOT audit record.
Output: Position-by-position measurement log in CMMS
Stage 3 · 90-Day
Periodic System Inspection
Who: Senior Tech / Shop · Time: 2–3 hrs
Required under 49 CFR 396.17, this inspection covers every component the weekly check cannot reach without disassembly: chamber diaphragm condition, drum diameter measurement, anchor pin and camshaft lubrication, ABS sensor function, and full system brake balance testing.
Output: Signed periodic inspection certificate (retained minimum 1 year)
Stage 4 · Quarterly
Fleet Program Audit & Trend Review
Who: Fleet Manager · Time: 1–2 hrs
The program audit turns individual vehicle data into fleet intelligence. Review brake-related OOS rates, unplanned downtime events, CSA violation trends, lining wear rates by route and load profile, and technician inspection compliance. This is where the program improves itself.
Output: Program KPI report, corrective action items, updated PM intervals
OxMaint Manages All 4 Stages From One Mobile Platform — With Zero Paper
From driver DVIRs to technician measurement logs to quarterly trend reports, OxMaint gives every stage of your brake inspection program a digital backbone. Deploy in days, not months.
Build It Right
7 Elements Every Brake Inspection Program Needs to Reduce Downtime
Program design determines program results. These seven elements separate brake inspection programs that reduce downtime from those that just check compliance boxes.
A
Vehicle-Specific Inspection Standards
Push rod limits, lining thickness thresholds, and air leak allowances vary by vehicle type, chamber size, and axle configuration. One generic checklist for a mixed fleet is a compliance gap. Define standards per vehicle type and configure your inspection forms accordingly.
B
Position-Based Measurement Logging
Logging a single "brakes OK" is useless for trend analysis. Require readings by axle position — steer left, steer right, drive 1 left, drive 1 right — so wear rate analysis can flag the specific positions degrading faster than expected.
C
Early Warning Thresholds Above DOT Minimums
DOT minimums are the floor, not the target. Set your scheduling thresholds at lining 3/8" (vs. 1/4" DOT minimum) and push rod stroke at 80% of the allowable limit. This gives your shop a scheduling window before compliance pressure appears.
D
Automatic Work Order Generation from Defects
The largest cause of repair delay is the gap between defect detection and shop floor action. When a driver or technician flags a brake defect, an auto-generated work order with vehicle ID, defect type, photo, and priority reaches the assigned technician within minutes — not the next day.
E
Technician Accountability and Sign-Off
Every inspection record must include the inspector's name and employee ID. FMCSA requires this for periodic inspections — and it creates accountability that improves inspection quality. Unsigned or incomplete records are both a compliance gap and a signal that your process has a hole.
F
Mileage-Triggered PM Scheduling
Brake lining wear is driven by mileage and load cycles, not calendar days. Calendar-based PM intervals mean some vehicles are over-inspected and others under-inspected. Odometer-triggered scheduling in your CMMS ensures every vehicle reaches its inspection at the right interval regardless of how the fleet operates.
G
Fleet-Level KPI Tracking
A program without metrics cannot improve. Track: brake-related OOS rate per 100 inspections, unplanned brake events per month, average lining life by vehicle type and route, and cost-per-brake-event (scheduled PM vs. roadside repair). These four KPIs tell you if the program is working or needs adjustment.
Downtime-Reduction Checklist
The 20-Point Brake Program Setup Checklist
Use this checklist when building or auditing your brake inspection program. Each item closes a gap that causes unplanned downtime.
Program Foundation
Define inspection requirements per vehicle type and axle configuration
Set warning thresholds above DOT minimums for each brake measurement
Document required lube points and intervals for all brake pivot components
Establish mileage-based PM intervals for each vehicle class in your fleet
Identify which technicians are certified for each inspection tier
Driver Training
Train all drivers on correct air brake pre-trip procedure including leak test
Train drivers to identify early warning signs: pulling, extended stop distance, pedal changes
Configure mobile DVIR with guided brake inspection prompts and photo capture
Establish defect reporting protocol — who is notified, how fast, what action follows
Set vehicle hold policy — no dispatch on any vehicle with open brake defect work order
CMMS Configuration
Build inspection forms with position-level measurement fields for each vehicle type
Configure automatic work order creation on any below-threshold measurement
Set up PM schedule triggers by odometer for weekly, 90-day, and annual tiers
Create brake-specific KPI dashboard tracking OOS rate, unplanned events, lining life
Enable DOT audit export for all brake inspection records by vehicle and date range
Continuous Improvement
Review brake KPIs quarterly — adjust PM intervals based on actual wear data
Root cause any OOS violation — identify whether it reflects a process gap or an equipment issue
Compare lining life across vehicles on similar routes — outliers signal mechanical or driver issues
Review inspection completion rates — missed inspections are as dangerous as failed ones
Update training materials annually based on fleet's own violation and failure history
Program KPIs
4 Metrics That Tell You If Your Brake Program Is Working
Data without interpretation is noise. These four KPIs convert your inspection records into program performance signals that drive continuous improvement.
KPI 1
Brake OOS Rate per 100 Roadside Inspections
Tracks how often brake defects survive your internal inspection program and get caught by a roadside inspector instead. Industry top-performer target: below 3%. If your rate is above 8%, your internal inspection is missing defects that inspectors find — a training or process gap.
Target: Below 3%
KPI 2
Unplanned Brake Events per Month
Counts roadside failures, breakdown recoveries, and emergency shop repairs that were not scheduled. Every unplanned event costs 5–8x more than a scheduled replacement. Trend this monthly — any increase signals that your inspection intervals need shortening or your thresholds need tightening.
Target: Trending toward zero
KPI 3
Average Brake Lining Life by Vehicle Class
Measures how many miles your linings last before replacement, segmented by vehicle type and route. Significant variance within the same vehicle class points to driver behavior, loading patterns, or alignment issues — not just lining quality. This KPI turns component data into fleet behavior insight.
Benchmark and track variance
KPI 4
Inspection Completion Rate
The percentage of scheduled brake inspections completed on time across your fleet. A program with 90% excellent standards but 70% completion rate is a 70% program — the uncompleted 30% is where your failures will come from. Track this weekly and address it immediately when it drops below 95%.
Target: Above 95%
Frequently Asked Questions
Building a Brake Inspection Program — What Fleet Managers Ask
What is the minimum brake inspection program a commercial fleet must have to meet FMCSA requirements?
FMCSA requires: a driver-executed pre-trip inspection before every dispatch with documentation (DVIR retained 3 months), a periodic inspection every 12 months at minimum covering all brake components per Appendix G of 49 CFR Part 396, and a signed inspection record retained through the next periodic inspection. Many fleets interpret "minimum" as "sufficient" — but the minimum regulatory floor does not prevent roadside violations. A program that adds weekly technician measured checks and 90-day full inspections consistently achieves far lower OOS rates.
OxMaint templates meet all FMCSA documentation requirements.
How do I calculate the right PM interval for brake inspections on my specific fleet?
Start with your historical lining wear data — how many miles does lining typically last on your fleet? Set your weekly inspection trigger at 70% of that average lining life in miles, and your replacement threshold at 90%. For example, if average lining life is 50,000 miles, inspect weekly from 35,000 miles and schedule replacement by 45,000. Without historical data, start with manufacturer-recommended intervals and tighten them based on your first six months of measurement data. OxMaint's trend analysis accelerates this calibration significantly.
Book a demo to see how.
What should I do differently for air brakes vs. hydraulic brakes in a mixed fleet?
Air brake systems require push rod stroke measurement, air leak testing, and low-pressure warning system checks that hydraulic systems do not. Hydraulic systems require fluid level and condition checks, master cylinder inspection, and line integrity checks that air systems do not. In a mixed fleet, maintain separate inspection forms for each brake type, train technicians to proficiency on both, and configure your CMMS to present the correct checklist based on vehicle type. Mixing procedures or using a generic form for both creates compliance gaps on both types.
Sign up for OxMaint to configure vehicle-specific forms.
How does a CMMS like OxMaint specifically reduce brake-related downtime versus a spreadsheet or paper system?
A CMMS reduces downtime through three mechanisms that paper cannot replicate: automated scheduling ensures no vehicle misses its inspection interval due to a calendar oversight; trend-based alerts flag components before they reach the failure threshold rather than at or after it; and instant work order generation from defect reports eliminates the 24–48 hour lag between detection and repair that paper systems create. These three mechanisms together are the primary driver of the 60% reduction in unplanned brake events that structured digital programs consistently achieve.
See OxMaint in action.
How long does it take to implement a digital brake inspection program with OxMaint?
Most fleets are running their first digital brake inspections within 24–48 hours of signup. Vehicle setup, inspection form configuration, and technician onboarding can be completed in a single working day for fleets under 50 vehicles. Larger fleets typically take 3–5 days for full configuration. No hardware is required — inspections run on the mobile devices your team already uses. The first complete audit-ready inspection report is available immediately after the first inspection is completed.
Sign up free to get started today.
A Brake Program That Reduces Downtime Is Built Once and Runs Itself. OxMaint Is How You Build It.
Automated scheduling, mobile checklists, position-level measurement tracking, instant work orders, KPI dashboards, and DOT audit exports — everything your brake inspection program needs to eliminate unplanned downtime, in one platform.