Fleet managers who outperform in 2026 share one thing: they don't manage by gut feel. With fuel costs eating 30–40% of operating budgets, DOT compliance tightening, and unplanned breakdowns costing hundreds of dollars per idle hour, the difference between a profitable fleet and a struggling one almost always traces back to which metrics are being tracked — and how consistently. This guide covers the 10 fleet management KPIs that matter most right now, the benchmark numbers you should be hitting, and how OxMaint's real-time analytics dashboard makes every one of them visible without manual effort. Sign up free and see your fleet's real numbers within hours.
Fleet Analytics · 2026 Benchmarks · All Vehicle Types
Top 10 Fleet Management KPIs to Track in 2026
The fleet industry's cost-per-mile average hit $2.26 in 2024 — up $0.62 from 2020. Fuel volatility, tightening FMCSA rules, and rising repair costs mean every untracked metric is a silent profit leak. Here are the 10 KPIs that close the gap — with formulas, 2026 benchmarks, and OxMaint tools to track each one automatically.
$2.26Average cost per mile for medium-duty fleets in 2024 — up 38% since 2020
30–40%Of total fleet operating costs consumed by fuel alone — largest single expense
70%Reduction in unexpected failures when fleets use predictive KPI-driven maintenance
5–10%Of annual budgets wasted by average fleet through underutilized assets and poor PM compliance
Why KPIs Matter More in 2026
The Fleet Operations Environment Has Changed — Your Metrics Must Too
The fleet industry is under simultaneous pressure from four directions in 2026: rising operating costs, stricter FMCSA and DOT regulatory enforcement, ESG and emissions reporting requirements from enterprise customers, and driver shortages that make vehicle availability more critical than ever. A dashboard that tracks 40 metrics with equal visual weight is functionally useless — it creates "dashboard fatigue" where managers stop looking at reports entirely. The right approach is tiered: 3–4 "north star" KPIs visible at a glance, with diagnostic metrics one click beneath. OxMaint's Analytics Dashboard is built on exactly this principle.
01
Rising Costs
Cost-per-mile up $0.62 since 2020. Every unoptimized route, idle engine, and deferred PM compounds the loss.
02
Tighter Compliance
FMCSA ELD mandates, DOT inspection requirements, and OSHA vehicle safety standards tightened through 2025–2026.
03
ESG Reporting
Enterprise shippers and public sector clients increasingly require emissions data and sustainability KPIs alongside financial metrics.
04
Driver Shortages
With qualified drivers scarce, every vehicle day lost to avoidable breakdown or compliance failure carries amplified operational cost.
Stop managing your fleet from spreadsheets
OxMaint tracks all 10 of these KPIs automatically — real-time dashboards, no manual data entry, alerts when metrics drift outside your targets.
The 10 KPIs
Every KPI, Its Formula, 2026 Benchmark, and What It's Really Telling You
KPI 01
Cost Per Mile (CPM)
Financial Health · North Star Metric
The single most telling metric of fleet financial health. It aggregates fuel, maintenance, insurance, depreciation, and driver costs into one number that exposes whether your operation is running efficiently or bleeding money across multiple categories simultaneously.
When CPM trends upward without a corresponding revenue increase, something needs immediate attention — don't wait for the quarterly review. OxMaint calculates CPM automatically per vehicle, per route, and across the entire fleet in real time.
2026 Benchmark
$1.50–$2.10
Medium-duty fleets
Industry avg: $2.26
KPI 02
Vehicle Utilization Rate
Asset Efficiency · North Star Metric
Average fleets waste 5–10% of their annual budget through underutilized assets. If you have 50 vehicles and 8 are sitting underutilized in the lot, you're paying insurance, depreciation, and registration on assets that aren't generating revenue. This KPI identifies candidates for redeployment or disposal before they silently drain capital.
Review daily. Consistent under-utilization on specific vehicles triggers a redeployment or disposal decision. OxMaint's live fleet status dashboard surfaces this each morning before dispatch.
2026 Benchmark
85–95%
Target: 95%+
Below 80% = action needed
KPI 03
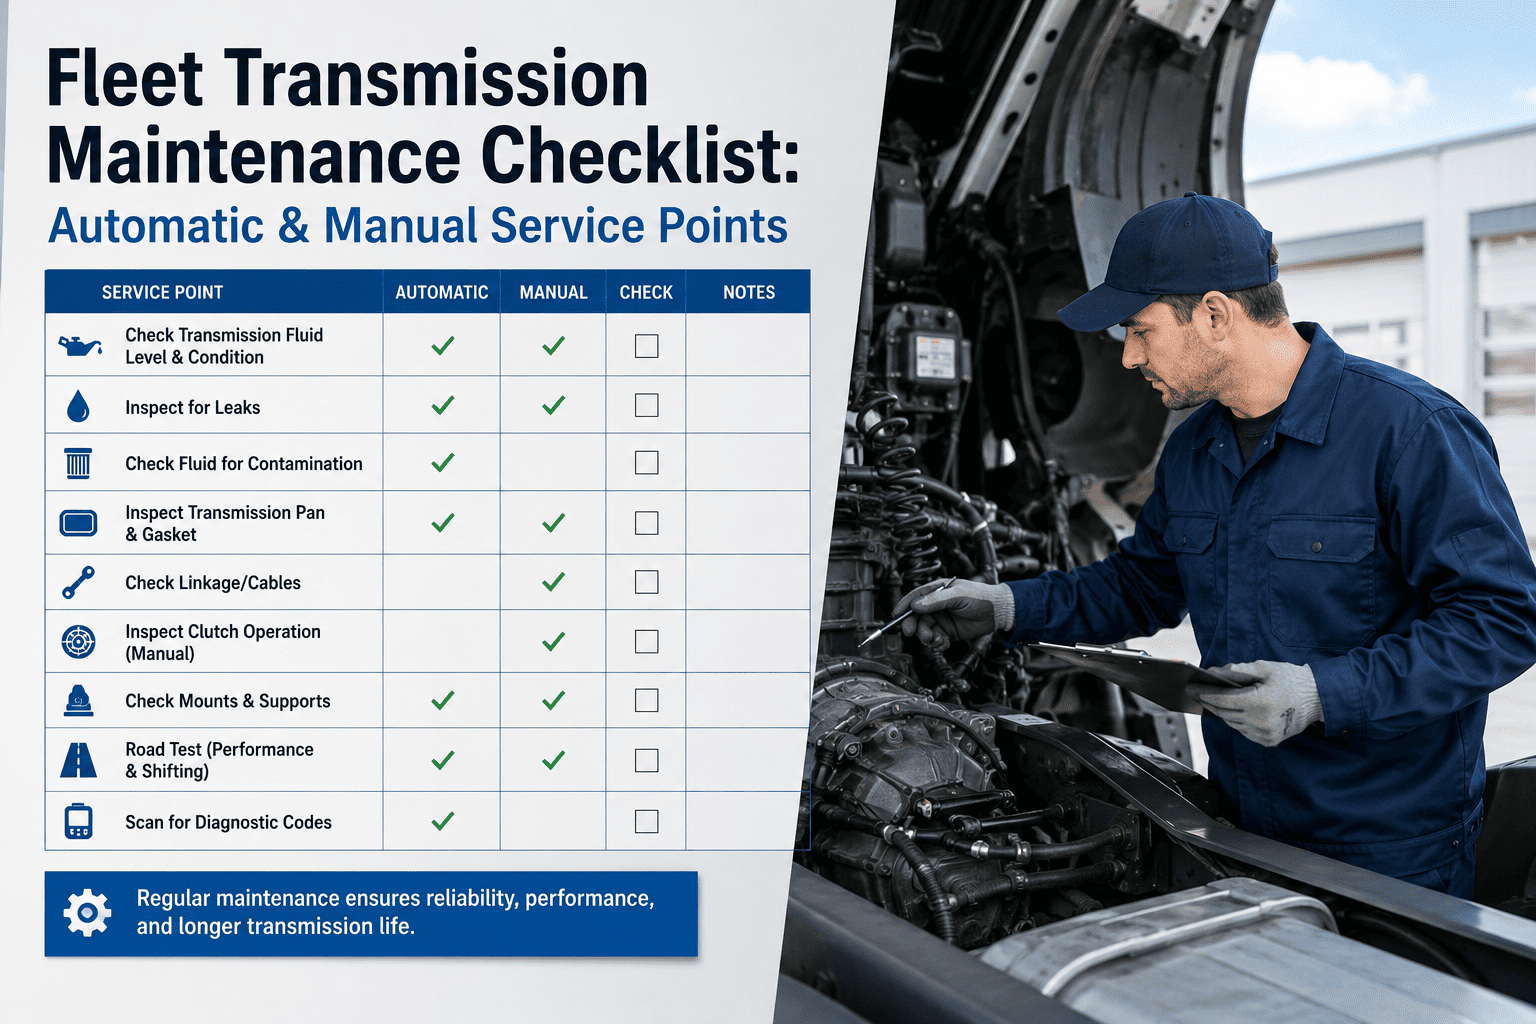
Preventive Maintenance Compliance Rate
Maintenance · North Star Metric
PM compliance is the upstream KPI that determines the quality of every downstream metric. Poor compliance means higher breakdowns, higher CPM, shorter asset lifespan, and compliance violations. Fleets operating below 85% PM compliance are statistically predictable candidates for expensive unplanned downtime within the next 90 days.
Set automated alerts at 95% threshold. When compliance dips, investigate whether it's a scheduling gap, technician capacity issue, or parts availability problem. OxMaint's preventive maintenance module triggers work orders automatically by mileage, hours, or calendar interval.
2026 Benchmark
95%+
Industry target
Below 85% = systemic problem
KPI 04
Fuel Efficiency (Miles Per Gallon by Vehicle & Driver)
Fuel Management · High Priority
Fuel is 30–40% of total fleet operating costs. The critical insight from tracking this KPI by driver — not just by vehicle — is that a driver averaging 6 MPG in a vehicle where other drivers average 8 MPG reveals a coaching opportunity, not a vehicle problem. Poorly maintained engines, underinflated tires, and clogged filters alone drop fuel efficiency 10–20%.
Compare fuel efficiency across vehicle classes, routes, and drivers to isolate root causes. OxMaint integrates with fuel card providers for automatic consumption tracking — no manual receipt entry.
Efficiency Loss Risk
10–20%
MPG lost from poor maintenance
30–40% of fleet costs = fuel
KPI 05
Mean Time Between Failures (MTBF)
Reliability · Predictive Metric
MTBF is the leading indicator that tells you how well your preventive maintenance program is actually working — weeks before a breakdown occurs. A declining MTBF on a specific vehicle is a reliable signal that maintenance frequency needs adjustment or a component is approaching end-of-life. Fleets using MTBF-driven predictive intervention reduce unexpected failures by 70%.
Track trend direction, not just absolute value. A declining MTBF over 3 consecutive periods on the same vehicle triggers an asset review. OxMaint calculates MTBF automatically from work order and inspection history data.
Tracking Direction
Higher = Better
Trend matters more than absolute
Declining = intervention needed
KPI 06
Mean Time To Repair (MTTR)
Workshop Efficiency · Operational
Every hour a vehicle spends in the workshop is an hour it's not generating revenue. MTTR measures workshop efficiency — from the moment a defect is reported to the moment the vehicle returns to service. High MTTR points to three root causes: diagnostic capability gaps, parts availability problems, or technician training needs. It's the KPI that exposes maintenance operation bottlenecks.
Benchmark MTTR by repair category. Electrical repairs have different acceptable ranges than mechanical. High MTTR on electrical faults often points to diagnostic tooling gaps. OxMaint tracks repair time from work order open to close automatically.
Target Direction
Lower = Better
Track by repair category
High MTTR = bottleneck signal
KPI 07
Driver Safety Score (Behavior Index)
Safety & Compliance · Risk Management
Driver behavior monitoring identifies risky habits before they cause accidents — not after. Hard braking, harsh acceleration, speeding, and sharp cornering correlate directly with both accident frequency and accelerated vehicle wear. A driver consistently triggering harsh braking events increases brake pad replacement frequency by an average of 40% and creates compounding insurance premium exposure.
Use as a coaching tool, not a punitive metric. Drivers aware of their scores improve behavior. OxMaint integrates with GPS telematics and OBD hardware for automatic driver behavior data capture.
Maintenance Link
40%
Higher brake wear from harsh
braking behavior patterns
Safety + Cost Impact
High
KPI 08
DOT / DVIR Inspection Compliance Rate
Regulatory Compliance · Mandatory
DOT pre-trip and post-trip Driver Vehicle Inspection Reports are legally mandatory for commercial fleets — not optional best practice. FMCSA enforcement actions in 2025–2026 have increased roadside inspection frequency, with out-of-service violations costing an average of $15,000+ per incident in fines, remediation, and lost revenue. A single uninspected vehicle leaving your yard is a compliance liability that dwarfs the cost of any inspection system.
Target: 100%. No acceptable variance for a mandatory regulatory requirement. OxMaint's mobile inspection app enforces DVIR completion before vehicle release — drivers cannot close an inspection without completing all checklist items.
Required Target
100%
Legally mandatory — no
acceptable variance level
KPI 09
Total Cost of Ownership (TCO) Per Vehicle
Financial Planning · Strategic
TCO is the strategic complement to CPM — it tells you not just what a vehicle costs to operate today, but whether it makes financial sense to keep it. A vehicle with a rising maintenance-to-revenue ratio and declining MTBF is often cheaper to replace than to continue repairing. Without TCO tracking, fleets routinely over-invest in aging assets that should have been replaced 18 months earlier.
Calculate TCO annually per vehicle. When TCO exceeds the cost of equivalent replacement capacity, initiate disposal. OxMaint tracks every cost component automatically, generating TCO reports on demand without spreadsheet assembly.
Decision Trigger
TCO > Replacement
When annual TCO exceeds new
vehicle equivalent cost — replace
KPI 10
First-Time Fix Rate (FTFR)
Workshop Quality · Efficiency
A vehicle that returns to the workshop for the same defect within 30 days represents wasted labor, wasted parts, and wasted vehicle availability. FTFR reveals the diagnostic and repair quality of your maintenance operation. Below 85% FTFR means your technicians are treating symptoms rather than root causes — a pattern that inflates MTTR, damages MTBF, and increases your CPM simultaneously.
Below 85% FTFR requires diagnostic capability review — tooling, parts quality, or technician training. OxMaint's work order history flags repeat repairs on the same defect category automatically, surfacing FTFR trends before they become expensive patterns.
2026 Benchmark
90%+
Industry target
Below 85% = diagnostic gap
Quality Impact
Medium-High
Quick Reference
All 10 KPIs at a Glance — 2026 Benchmarks Summary
#
KPI
Formula
2026 Target
Priority
01
Cost Per Mile
Total Costs ÷ Miles
$1.50–$2.10
Critical
02
Vehicle Utilization
Active Hrs ÷ Available Hrs
85–95%
High
03
PM Compliance Rate
PM Done ÷ PM Scheduled
95%+
Critical
04
Fuel Efficiency (MPG)
Miles ÷ Gallons
Improve vs. baseline
High
05
MTBF
Operating Hrs ÷ Failures
Higher & rising
High
06
MTTR
Repair Time ÷ Repair Events
Lower & declining
High
07
Driver Safety Score
Telematics behavior index
Improve vs. baseline
High
08
DVIR Compliance
DVIRs Done ÷ Required
100%
Critical
09
TCO Per Vehicle
All lifetime costs − resale
TCO < replacement cost
Strategic
10
First-Time Fix Rate
No-rework repairs ÷ Total
90%+
High
OxMaint Fleet Dashboard
How OxMaint Tracks All 10 KPIs Automatically — No Spreadsheets Required
A well-designed fleet dashboard puts your 3–4 north star KPIs at the top — Cost Per Mile, Utilization, PM Compliance, Downtime — then provides one-click drill-down to diagnostic metrics beneath. OxMaint's Analytics Dashboard is built on this tiered architecture, giving fleet managers clarity without noise.
Real-Time KPI Dashboard
Live CPM, utilization, PM compliance, and MTBF/MTTR across your entire fleet — updated continuously, not at end of month when it's too late to act.
Automated PM Scheduling
PM work orders triggered automatically by mileage, engine hours, or calendar interval. PM compliance rate tracked and reported without manual counting.
Mobile DVIR Enforcement
Drivers complete pre-trip and post-trip inspections on mobile — inspection completion tracked automatically, DVIR compliance reported in real time.
Fuel Card Integration
Fuel card data synced automatically — fuel efficiency calculated per vehicle and per driver without manual entry, fueling anomalies flagged instantly.
GPS & Telematics Integration
OBD and telematics data feeds driver safety scores, harsh event tracking, and live vehicle location — all surfaced in the same OxMaint dashboard.
TCO & Cost Reporting
Every maintenance cost, fuel expense, and repair event linked to the asset record — TCO and CPM calculated per vehicle on demand, without spreadsheet work.
FAQ
Fleet Management KPIs — Common Questions
How often should fleet KPIs be reviewed — daily, weekly, or monthly?
The review frequency should match the actionability of each metric. North star KPIs — vehicle utilization, DVIR compliance, and active breakdowns — should be reviewed daily because decisions made on today's data change today's dispatch. Operational KPIs like MTTR, fuel efficiency trends, and PM compliance rates are best reviewed weekly, allowing enough data accumulation to see patterns rather than reacting to single data points. Financial and strategic KPIs — CPM, TCO per vehicle, and FTFR — should be reviewed monthly and analyzed quarterly against prior periods and industry benchmarks. OxMaint's dashboard makes this tiering automatic: your daily operations view surfaces real-time status, while weekly and monthly report templates are pre-configured and delivered on schedule.
Sign up free to configure your KPI review schedule, or
book a demo to see the dashboard architecture.
What's the difference between MTBF and MTTR, and why do you need both?
MTBF (Mean Time Between Failures) and MTTR (Mean Time To Repair) measure completely different things, and you need both to diagnose maintenance problems accurately. MTBF tells you about the reliability of your assets — how long they operate before something breaks. High MTBF means your preventive maintenance program is working; declining MTBF means something is wrong upstream, either in your PM quality, component selection, or operating conditions. MTTR tells you about the efficiency of your repair operation — how quickly your team fixes things once they break. High MTTR means your workshop has bottlenecks: inadequate diagnostic tools, poor parts availability, or undertrained technicians. A fleet with high MTBF and low MTTR is operating well. A fleet with low MTBF and high MTTR has problems at both ends. OxMaint calculates both automatically from work order open and close timestamps combined with asset operating hours data.
Book a demo to see how these metrics appear in the OxMaint dashboard.
How do you track fleet KPIs without a telematics system or GPS hardware?
You can track a meaningful subset of KPIs without full telematics hardware — and OxMaint is designed to support both approaches. Without telematics, you can accurately track PM compliance rate (from scheduled vs. completed work orders), MTBF and MTTR (from work order timestamps and odometer readings), TCO per vehicle (from maintenance cost records), FTFR (from repeat repair history), and DVIR compliance (from mobile inspection completion records). Driver safety scores and fuel efficiency tracking benefit significantly from telematics integration, but fuel efficiency can be approximated through fuel card integration with mileage data even without OBD hardware. Cost per mile is fully calculable without telematics using fuel card data and odometer readings from mobile inspections. OxMaint supports a phased approach: start with the KPIs your current data supports, then add telematics integration as your program matures.
Sign up free to start tracking immediately with your current data sources.
What is a realistic PM compliance rate target, and what causes it to fall below 85%?
The industry benchmark for PM compliance is 95%+ for well-run fleets, with 100% as the aspirational target for critical assets. Below 85% is widely considered a systemic problem — not just a scheduling inconvenience — because at that level, enough vehicles are operating past their service intervals to statistically guarantee higher breakdown frequency within 60–90 days. The three most common root causes of low PM compliance are: (1) scheduling gaps — PM intervals are set in the system but work orders aren't being generated or prioritized correctly; (2) technician capacity constraints — the workshop doesn't have enough staffed hours to complete scheduled PM alongside reactive repairs; and (3) parts availability failures — the vehicle is due for service but a required part is on backorder, so the service is deferred without a rescheduled date. OxMaint addresses all three: automated PM scheduling ensures work orders are generated without manual intervention, capacity planning tools flag when PM backlog is building, and parts inventory alerts flag upcoming service requirements against current stock levels before service day.
Book a demo to see how OxMaint's PM compliance tracking works.
Can small fleets of 10–20 vehicles benefit from KPI tracking, or is this only for large operations?
KPI tracking is arguably more impactful for small fleets than large ones, because in a 15-vehicle fleet, a single vehicle running at 60% utilization or consuming 20% more fuel than average represents a proportionally larger budget leak than the same vehicle in a 500-unit fleet. The difference is that large fleet operators have historically had dedicated fleet analysts to build KPI reports. OxMaint makes the same analytics accessible to a solo fleet manager running 10 vehicles — automated dashboards, mobile inspection compliance tracking, and fuel card integration require no analyst and no IT department. Several OxMaint fleet customers managing under 20 vehicles have reduced their total maintenance spend by 15–25% within the first 6 months simply by gaining visibility into CPM, utilization, and PM compliance data they had never tracked before.
Sign up free — no minimum fleet size required.
Experience a Cloud-Native Fleet CMMS Built for Real Operations
OxMaint combines maintenance management, asset tracking, compliance automation, and fleet analytics in a single platform. Deploy in days. See results in weeks.
45%
Reduction in unplanned vehicle downtime
100%
DOT compliance — automated DVIR tracking
Real-Time
All 10 KPIs tracked automatically — no spreadsheets
Days
Typical deployment timeline — cloud-based, no IT project