A mid-size snack food manufacturer running six high-speed packaging lines across two shifts performed 22 changeovers per day — product changes, format switches, and flavor transitions that consumed an average of 47 minutes each. That totaled 17.2 hours of non-productive time daily across the plant floor, representing 36% of available production capacity lost entirely to changeover activities.
The operations team had attempted SMED workshops three times in five years, achieving temporary improvements that reverted to baseline within 8 weeks because no system tracked whether the optimized procedures were actually being followed.
After deploying AI-driven changeover analytics that monitored every transition in real time — measuring actual durations against optimized targets, identifying which specific activities were expanding, and auto-generating corrective work orders when equipment-related delays occurred — average changeover time dropped from 47 minutes to 19 minutes, changeover-related OEE losses fell by 58%, and the plant recovered the equivalent of 1.4 additional production shifts per week without adding a single operator. Schedule a consultation to see how Oxmaint tracks changeover performance and connects equipment delays to maintenance action.
Changeover time is the largest controllable loss in FMCG production.
AI analytics transform changeovers from unmeasured downtime into optimized, trackable processes — cutting transition times 40–60% while ensuring improvements actually sustain.
The Scale of Changeover Losses in FMCG Manufacturing
FMCG plants run more changeovers per shift than any other manufacturing sector. Consumer demand for product variety — multiple flavors, sizes, formats, and seasonal SKUs — means production lines switch constantly. Each changeover is a period of zero output, and the cumulative impact dwarfs most other OEE loss categories. Understanding the full cost structure is the first step toward justifying the AI systems that compress these transitions.
Direct Production Loss
Scale of impact: FMCG plants averaging 15–25 changeovers per day lose 25–40% of theoretical production capacity to transition activities — time during which lines produce nothing while operators, utilities, and overhead costs continue.
Hidden multiplier: Changeover losses compound with startup waste — the first 10–20 minutes of production after a changeover typically run at 60–80% quality yield as parameters stabilize, adding another 5–15% effective time loss per transition.
Annual exposure: $1.2M–$4.8M per line
Schedule Disruption
Cascading effect: Extended changeovers push subsequent production runs, creating schedule compression that forces overtime, delays shipments, or requires run cancellation — each generating costs beyond the changeover itself.
Customer impact: Retail customers penalize late deliveries $500–$5,000 per occurrence. A plant running 6 lines with 3–4 extended changeovers weekly accumulates $50K–$200K in annual chargebacks from schedule slippage alone.
Service level erosion: 3–8% OTIF reduction
Unmeasured Variation
The real problem: Most FMCG plants know their average changeover time but not the variation. A "45-minute average" often means a range from 28 to 82 minutes — and the causes of that 54-minute spread are invisible without real-time analytics.
Why it matters: Variation, not average, drives schedule unreliability. AI analytics expose the specific activities, equipment issues, and operator behaviors causing variation — turning unmeasured downtime into actionable improvement targets.
Typical variation range: 2–3× best-to-worst
Why Changeover Improvements Do Not Sustain (And How AI Fixes It)
Every FMCG plant has attempted changeover reduction. Most have run SMED workshops. Some have achieved dramatic short-term improvements. Almost none have sustained those improvements beyond 90 days — because the fundamental problem is not knowing how to do changeovers faster but ensuring that optimized procedures are actually followed, every time, on every line, on every shift. Sign up to build real-time changeover tracking dashboards in Oxmaint that hold every shift accountable to optimized targets.
Five Barriers to Sustained Changeover Improvement
Barrier 1: No Real-Time Measurement
What happens: Changeover duration recorded manually — if recorded at all. Operators estimate times on shift logs. Actual vs. target comparison happens weekly in a meeting, not in real time on the floor. By the time anyone notices degradation, the optimized procedure has already been abandoned for weeks.
AI solution: Automated changeover detection through line status signals (PLC integration) tracks every transition start, end, and duration without manual entry. Deviations from target trigger immediate alerts to shift supervisors.
Sustainability mechanism: You cannot revert to old habits when every changeover is measured, compared to target, and visible to management in real time.
Barrier 2: Equipment Delays Disguised as Changeover Time
What happens: Worn format parts that should take 3 minutes to swap now take 12 because they do not seat properly. Aging fill heads that need 15 minutes of adjustment after product change because seals have degraded. These equipment-related delays are absorbed into "changeover time" and never reach maintenance as actionable work orders.
AI solution: Activity-level tracking within changeovers identifies which specific steps are expanding. When "format part installation" consistently exceeds target on Line 4, the system generates a maintenance work order for part inspection or replacement — connecting changeover analytics directly to the CMMS.
Sustainability mechanism: Equipment-related changeover delays are routed to maintenance as work orders, not buried in production reports as accepted losses.
Barrier 3: Operator Variation Across Shifts
What happens: First shift achieves 22-minute changeovers using the optimized procedure. Second shift averages 41 minutes because two operators never attended the SMED training and revert to sequential methods. Third shift falls somewhere between. No one compares shift-to-shift performance systematically.
AI solution: Performance benchmarking by shift, operator team, and line identifies which crews are following optimized procedures and which are not. Targeted coaching directed at specific performance gaps rather than blanket retraining.
Sustainability mechanism: Shift-level accountability through visible, data-backed performance comparison — not subjective supervisor assessment.
Barrier 4: Changeover Sequence Not Optimized
What happens: Production scheduling treats changeovers as uniform — a switch from Product A to Product B takes the same time as B to C. In reality, certain transitions require full cleaning (allergen changeover), partial cleaning (flavor change within same allergen group), or only mechanical adjustment (size change within same product). Scheduling does not account for these differences.
AI solution: Transition matrix analysis maps actual changeover duration for every product-to-product combination on each line. AI scheduling optimization sequences production runs to minimize total changeover time — grouping similar products, ordering by increasing allergen risk, and avoiding unnecessary full-clean transitions.
Sustainability mechanism: Scheduling decisions driven by data, not habit — automatically selecting the sequence that minimizes total changeover burden.
Barrier 5: No Feedback Loop From Changeover to Engineering
What happens: Engineering designs new products and packaging formats without changeover impact data. A new SKU that requires a 15-minute additional adjustment on the filling line is launched without anyone quantifying the annual cost of that added complexity — which may exceed the product's margin contribution.
AI solution: Historical changeover data by product/format combination feeds into new product feasibility analysis. Engineering teams see the changeover time impact of design decisions before committing to production — enabling design-for-changeover optimization.
Sustainability mechanism: Product development decisions informed by actual changeover cost data, preventing future complexity from eroding hard-won improvements.
AI-Powered Changeover Optimization Capabilities
AI changeover analytics go beyond measurement to deliver prescriptive optimization — not just showing how long changeovers take, but identifying specifically what to fix, who to coach, and how to sequence production for minimum transition loss. Book a demo to see how Oxmaint connects changeover analytics to maintenance work orders and production scheduling.
Automated Changeover Detection & Timing
Without AI: Operators manually log changeover start and end times on paper or spreadsheet — often estimated, sometimes forgotten, always imprecise. Weekly reports aggregate inaccurate data into averages that hide variation.
With AI: PLC integration detects line stoppage, product change confirmation, and production restart automatically. Every changeover timed to the minute without manual entry. Duration, type (product, format, size, clean), and line automatically captured.
Impact: 100% changeover capture rate (vs. 60–75% with manual logging). True performance baseline established within 2 weeks. Variation visible for the first time.
Activity-Level Decomposition
Without AI: Changeover treated as a single block of time. No visibility into which activities (line clearance, part swap, adjustment, startup calibration, first-piece approval) consume the most time or vary the most.
With AI: Changeover decomposed into discrete activities through sensor checkpoints, operator confirmations, and vision system integration. Each activity timed independently. Pareto analysis identifies the 20% of activities causing 80% of total changeover duration and variation.
Impact: Improvement efforts focused on highest-impact activities. Equipment-related delays separated from procedural delays and routed to appropriate teams — maintenance for equipment issues, training for procedural gaps.
Transition Matrix & Production Sequencing
Without AI: Production sequence determined by ship dates and inventory levels alone. Changeover complexity not factored into scheduling. Full allergen cleans scheduled unnecessarily when product sequencing could have avoided cross-contact risk.
With AI: Historical changeover data builds a transition matrix mapping actual duration for every product-to-product combination on each line. AI scheduling optimizer sequences runs to minimize total daily changeover time while meeting all delivery commitments — reducing total transitions and selecting lowest-cost transition paths.
Impact: 15–30% reduction in total daily changeover time from sequencing optimization alone — before any procedural improvements. Allergen-driven full cleans reduced 40–60% through intelligent grouping.
Changeover Optimization Lifecycle: From Measurement to Sustained Improvement
Sustainable changeover reduction follows a five-stage lifecycle. Most FMCG plants stall at Stage 1 (measurement) or Stage 2 (initial improvement) because they lack the continuous monitoring infrastructure to enforce Stages 3–5. AI analytics provide that infrastructure.
Baseline: Automated Measurement
What happens: PLC-integrated changeover detection captures every transition on every line — type, duration, shift, crew, and product combination. No manual logging required.
Key outputs: True average changeover time per line, per changeover type, and per shift. Variation range (best to worst) quantified for the first time. Pareto of changeover types by frequency and total time consumed.
Analysis: Activity Decomposition & Root Cause
What happens: AI decomposes changeovers into discrete activities. Equipment-related delays separated from procedural delays. Operator variation quantified by shift and crew. Transition matrix built for all product-to-product combinations.
Key outputs: Pareto of activities by time contribution and variation. Equipment maintenance backlog items causing changeover expansion. Shift-level performance benchmarks identifying training gaps. Transition matrix revealing optimal production sequences.
Optimization: Targeted Interventions
What happens: Equipment-related delays addressed through CMMS work orders (format part replacement, seal refurbishment, calibration). Procedural improvements implemented with shift-specific coaching. Production sequencing optimized using transition matrix data.
Key outputs: Reduced changeover times on highest-impact lines and changeover types. Narrowed variation range as worst-case changeovers improve toward best-case performance. Maintenance backlog items resolved that were causing chronic changeover expansion.
Enforcement: Real-Time Monitoring & Alerting
What happens: Optimized targets set per line, per changeover type. Real-time monitoring compares every changeover against target. Deviations trigger immediate shift supervisor alerts. Equipment-related overruns auto-generate maintenance work orders in Oxmaint.
Key outputs: Sustained performance at optimized levels — no silent regression. Immediate visibility when any line or shift begins deviating from standard. Equipment issues escalated to maintenance before they become chronic changeover losses.
Continuous Improvement: Advanced Optimization
What happens: AI identifies second-order improvement opportunities: changeover scheduling patterns that reduce total daily transitions, predictive maintenance timing that prevents format part degradation from creating changeover delays, and new product changeover impact simulation before launch.
Key outputs: Year-over-year changeover time reduction. New product launches designed for changeover efficiency. Capital investment decisions informed by changeover impact data (e.g., quick-change tooling ROI validated by actual transition data).
Changeover Performance by FMCG Sector
Changeover characteristics vary significantly across FMCG categories. Snack food changeovers differ fundamentally from personal care or beverage transitions — in duration, complexity, cleaning requirements, and improvement potential. AI analytics must account for these differences to deliver relevant optimization. Sign up to configure line-specific changeover tracking and category-appropriate targets in Oxmaint.
The financial case for AI changeover analytics becomes undeniable when you quantify the gap between current changeover performance and achievable targets — and multiply that gap by production value per hour, shifts per week, and weeks per year. Request a changeover loss assessment to quantify your specific opportunity across all lines and changeover types.
Snack Food & Bakery
Typical changeover: 25–55 minutes. Format changes (bag size, case configuration) dominate. Flavor transitions require varying levels of line purge depending on allergen status. Seasoning changeovers are fastest; allergen transitions slowest.
AI opportunity: Transition matrix optimization grouping same-allergen products reduces full-clean frequency 40–60%. Equipment monitoring on bagmaking and sealing stations catches format part wear before it adds adjustment time. Target reduction: 35–50%.
Beverage & Dairy
Typical changeover: 30–90 minutes. CIP (clean-in-place) cycles dominate transition time — often mandatory between product types regardless of contamination risk. Filler head changeover and labeler adjustment add mechanical complexity.
AI opportunity: CIP optimization through AI-monitored rinse turbidity and conductivity sensors confirms cleaning completion faster than fixed-time cycles — reducing CIP duration 15–25% without compromising sanitation. Filler changeover analytics identify mechanical wear causing excessive adjustment. Target reduction: 25–40%.
Personal Care & Household
Typical changeover: 20–45 minutes. Color changes and fragrance transitions require thorough line purge to prevent cross-contamination. Format changes (bottle size, closure type) require mechanical adjustment at fill, cap, and label stations.
AI opportunity: Color sequence optimization (light to dark) eliminates unnecessary full purges. Fragrance grouping by chemical family reduces transition cleaning. Format part condition monitoring prevents mechanical adjustment creep. Target reduction: 30–45%.
Real Changeover Transformation: 58% Reduction in 14 Weeks
Multi-Line Snack Food Plant — 6 Packaging Lines, 22 Changeovers per Day, $6.8M Annual Changeover Cost
Starting Position: Average changeover time 47 minutes across all lines and types. Variation range 24–82 minutes for the same changeover type on the same line — indicating massive procedural and equipment inconsistency. Three previous SMED workshops had achieved temporary improvements (32 minutes best case) that reverted to baseline within 6–10 weeks. No real-time changeover tracking. Manual shift log entries estimated at ±15 minute accuracy. Production scheduling did not account for changeover duration differences between product transitions.
Implementation Approach:
- Weeks 1–3: Instrumentation & Baseline — PLC integration on all 6 lines for automated changeover detection. 847 changeovers captured in first 3 weeks establishing true baseline: 47.3-minute average, 24–82-minute range, with Line 2 and Line 5 consistently worst. Activity decomposition revealed 38% of total changeover time was equipment-related (format part adjustment, seal replacement, calibration) — not procedural.
- Weeks 4–6: Equipment Remediation — 23 maintenance work orders generated from changeover analytics: 8 format part replacements, 6 seal refurbishments, 4 calibration corrections, 5 quick-change tooling installations on highest-frequency changeover points. Maintenance investment: $34,000. Immediate impact: equipment-related changeover time dropped 52%.
- Weeks 7–10: Procedural Optimization — Shift-level performance data identified second shift averaging 56 minutes (vs. first shift 38 minutes) due to sequential changeover method on 3 of 6 lines. Targeted coaching for second shift operators on parallel activity execution. Real-time alerting activated — any changeover exceeding target by 10+ minutes triggers supervisor notification.
- Weeks 11–14: Scheduling Integration — Transition matrix completed for all 47 product-to-product combinations across 6 lines. Production scheduling optimized to group same-allergen products, sequence by format similarity, and minimize full-clean transitions. Total daily changeover count reduced from 22 to 18 through intelligent batching without affecting delivery commitments.
14-Week Results:
- Average changeover time: 47 minutes → 19 minutes (58% reduction). Variation range narrowed from 24–82 minutes to 15–28 minutes.
- Daily changeover count: 22 → 18 through scheduling optimization (18% fewer transitions).
- Total daily changeover time: 17.2 hours → 5.7 hours (67% reduction combining shorter changeovers and fewer transitions).
- Recovered capacity: 11.5 additional production hours per day — equivalent to 1.4 extra shifts per week at zero incremental labor cost.
- OEE improvement: Availability component improved from 64% to 83%. Overall OEE improved from 52% to 68%.
- Sustainability: Real-time monitoring maintained performance at 19-minute average for 6+ months post-implementation — zero regression toward pre-improvement baseline.
Annual Value: $3.9M (recovered production capacity $2.8M + eliminated overtime $480K + reduced schedule penalties $340K + maintenance savings from proactive format part management $280K)
Implementation Investment: $142,000 (instrumentation $48K + quick-change tooling $34K + analytics platform $36K + training $24K)
ROI: 2,746% | Payback: 19 days
Frequently Asked Questions
AI integrates with existing PLC and line control systems to detect changeover events through production state signals — line stoppage, product code change in the recipe management system, format change confirmation, and production restart with new product verification. No manual start/stop buttons or operator logging required. The system learns each line's changeover signature (sequence of state changes) within 1–2 weeks and achieves 98%+ automatic detection accuracy, including distinguishing changeovers from unplanned stops, breaks, and material shortages.
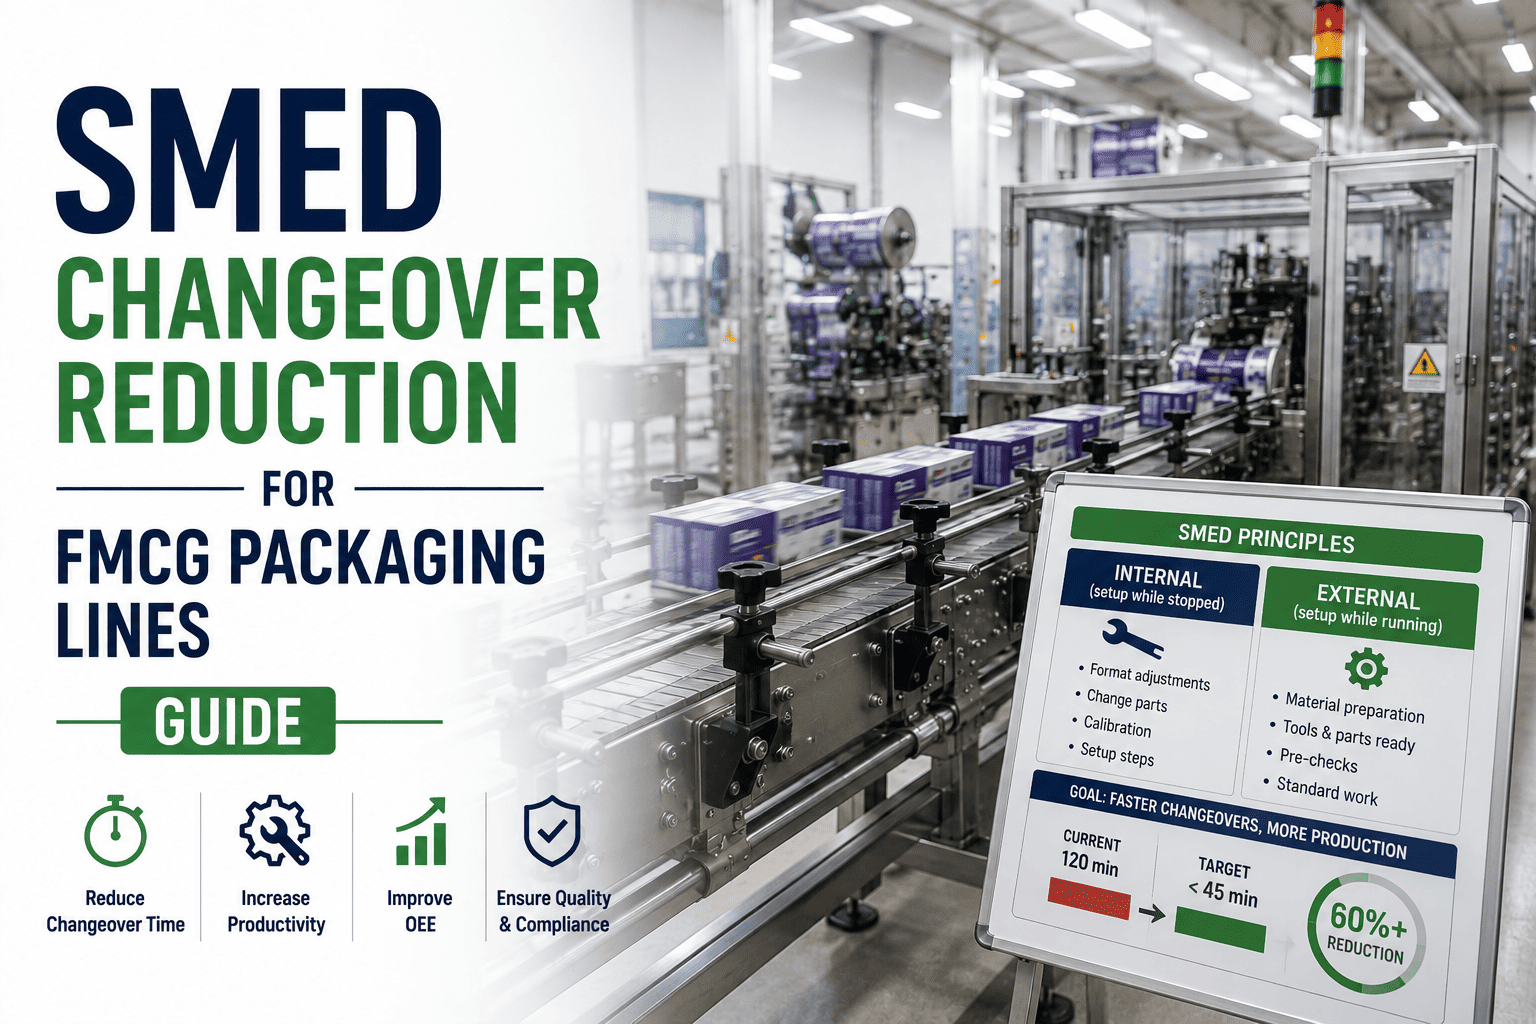
AI changeover analytics strengthen SMED — they do not replace it. SMED provides the methodology for separating internal and external activities, converting internal to external, and streamlining remaining internal activities. AI provides the continuous measurement infrastructure that SMED workshops lack: real-time tracking of whether SMED-optimized procedures are actually being followed, activity-level decomposition identifying which specific steps are expanding, and shift-to-shift performance comparison that directs coaching to where it is needed. Plants that combine SMED methodology with AI measurement sustain improvements that SMED-only implementations cannot maintain.
The AI builds a matrix of actual changeover durations for every product-to-product transition on each line — capturing not just average time but the specific cleaning requirements (full allergen clean, partial rinse, dry changeover). When generating production schedules, the optimizer sequences runs to minimize total changeover burden: grouping same-allergen products together, ordering by increasing allergen severity, and selecting transition paths that avoid unnecessary full cleans.
A plant running 8 allergen-driven full cleans per day might reduce to 3–4 through intelligent sequencing — saving 2–4 hours of productive time daily without any compromise to food safety.
Activity-level changeover decomposition identifies when specific steps consistently exceed their target duration — and distinguishes procedural causes (operator method) from equipment causes (worn format parts, degraded seals, miscalibrated components). When the root cause is equipment condition, the AI system auto-generates a maintenance work order in Oxmaint with the specific equipment, the observed symptom (e.g., "format part installation on Line 4 filler averaging 11 minutes vs. 3-minute target"), and the recommended action. This routes equipment-sourced changeover delays directly to maintenance instead of leaving production to absorb the loss indefinitely.
Baseline measurement is established within 2–3 weeks of PLC integration. Equipment-related improvements (format part replacement, seal refurbishment, calibration) typically deliver 20–30% changeover reduction within 4–6 weeks as the highest-impact maintenance items are resolved. Procedural improvements through shift-level coaching add another 15–25% over weeks 6–10. Scheduling optimization contributes an additional 10–20% reduction in total changeover burden by weeks 10–14. Cumulative improvement of 40–60% is typical within the first quarter, with sustainability maintained through continuous real-time monitoring.
Your changeover time is hiding recoverable production capacity worth millions annually.
Oxmaint connects changeover analytics to maintenance action — measuring every transition, identifying equipment-sourced delays, auto-generating work orders, and tracking improvement sustainability across every line and shift. Request a changeover loss assessment and our team will quantify your specific opportunity.