A personal care manufacturer in Malaysia was generating over 2.4 million work order records per year across seven production facilities — and making maintenance decisions based on a weekly summary email compiled manually by the maintenance manager. The email contained eight numbers: total work orders, PM compliance rate, and six equipment downtime totals. Everything else — which assets were trending toward failure, which technicians had the highest MTTR, which spare parts were being consumed faster than any model predicted, which production lines were being maintained reactively at four times planned cost — was buried in the CMMS, unseen. When the plant deployed Oxmaint's analytics layer, the first dashboard review identified three critical assets in progressive bearing degradation that had generated 47 corrective work orders over the previous 18 months without anyone noticing the pattern. Two of those assets failed within eight weeks of the analytics review. The third was scheduled for planned intervention. The data was always there. The intelligence to extract meaning from it was not. FMCG maintenance generates more actionable data per asset than almost any other manufacturing sector — sensor readings, work order histories, parts consumption, downtime codes, technician labour hours, and OEE contributions. Plants that build the analytics infrastructure to turn that data into decisions consistently achieve 35–45% reliability improvements within 12 months. Plants that do not continue to react to the same failures, in the same assets, at the same cost. Oxmaint's analytics dashboard surfaces patterns from your CMMS data that manual reporting cannot. Book a demo to see what your maintenance data is already telling you.
35%
Average Reliability Improvement in FMCG Plants That Deploy Structured Maintenance Analytics Within 12 Months
68%
Of FMCG Plants Generate Sufficient Maintenance Data for Predictive Analytics But Lack Reporting Infrastructure to Use It
4.8×
Higher Emergency Repair Cost vs Planned Maintenance — the Cost Differential That Analytics Identifies and Eliminates
$340K+
Average Annual Maintenance Cost Reduction in Mid-Size FMCG Plants After Analytics-Driven Programme Optimisation
Oxmaint's analytics dashboard surfaces work order trends, asset failure patterns, cost analytics, and PM compliance insights from your existing CMMS data — no separate BI tool, no data engineering team, no manual reporting.
Manual Reporting vs. Analytics-Driven Maintenance — What Changes
How FMCG maintenance decision quality transforms when data replaces intuition
Manual Reporting — Weekly Summary
Failure Pattern Detection
Invisible — patterns only visible in hindsight after catastrophic failure
Cost Visibility
Total spend known — cost per asset, per failure mode, per technician unknown
PM Effectiveness
Compliance tracked — whether PM tasks actually prevent failures unknown
Parts Demand
Historical reorder — stockouts and overstock both common
Technician Performance
Subjective — no objective MTTR or first-time fix rate data by individual
Analytics-Driven — Live Dashboard
Failure Pattern Detection
Real-time — repeat failures on same asset flagged automatically for root cause
Cost Visibility
Per asset, per failure mode, per line — cost per hour of downtime quantified
PM Effectiveness
Failure rate before and after PM measured — tasks that don't prevent failures removed
Parts Demand
Consumption-linked forecast — reorder triggered 14–21 days before stockout
Technician Performance
Objective MTTR, first-time fix rate, and work order completion rate by individual
Analytics-driven maintenance teams identify the same failure pattern 19× faster than manual reporting — and intervene before production impact
Six Maintenance Data Streams FMCG Plants Already Have — and How Analytics Transforms Each
Every FMCG plant operating a CMMS is generating these six streams. Most are only using 10–20% of their analytical value.
Work Order History
Pattern & Cost Intelligence
Every work order contains asset ID, failure code, labour hours, parts consumed, downtime duration, and technician ID. Analytics surfaces repeat-failure assets, calculates true cost per failure mode, and identifies the 20% of assets driving 80% of maintenance spend.
Sensor & IoT Data
Condition Trend Analysis
Vibration, temperature, pressure, and current draw readings generate thousands of data points per asset per day. Analytics identifies degradation trends invisible to threshold alerting — the gradual bearing temperature rise that precedes failure by 19 days is undetectable without cross-dataset trend analysis.
PM Compliance Records
Schedule Effectiveness
PM completion rates per asset, technician, shift, and week reveal the compliance gaps that predicate the next unplanned breakdown. Analytics also measures PM effectiveness — comparing failure rates on assets with high compliance vs. chronic deferrals to validate which tasks actually deliver protection.
Parts Consumption Data
Inventory & Demand Forecasting
Parts consumed per work order, per asset, and per failure mode build a demand signal that eliminates the over/understocking cycle. Analytics identifies parts being used faster than expected — a leading indicator of accelerating asset degradation — and optimises reorder quantities accordingly.
Technician Labour Records
Workforce Efficiency
Actual hours per work order vs. estimated, first-time fix rate, overtime frequency, and skill-to-task alignment expose workforce efficiency gaps. Analytics identifies technicians whose MTTR is 40% longer on specific failure types — directing targeted training that closes the gap without subjective performance management.
OEE & Downtime Codes
Production Impact Linkage
Downtime codes from MES/OEE systems linked to maintenance work orders quantify the production impact of every equipment failure. Analytics calculates cost per unplanned stoppage by asset and line, and proves maintenance investment ROI in production value terms rather than cost reduction alone.
Four-Layer Maintenance Analytics Architecture for FMCG Plants
From raw data to operational decisions — how each layer builds on the one below it
Layer 1
Descriptive AnalyticsWhat Happened
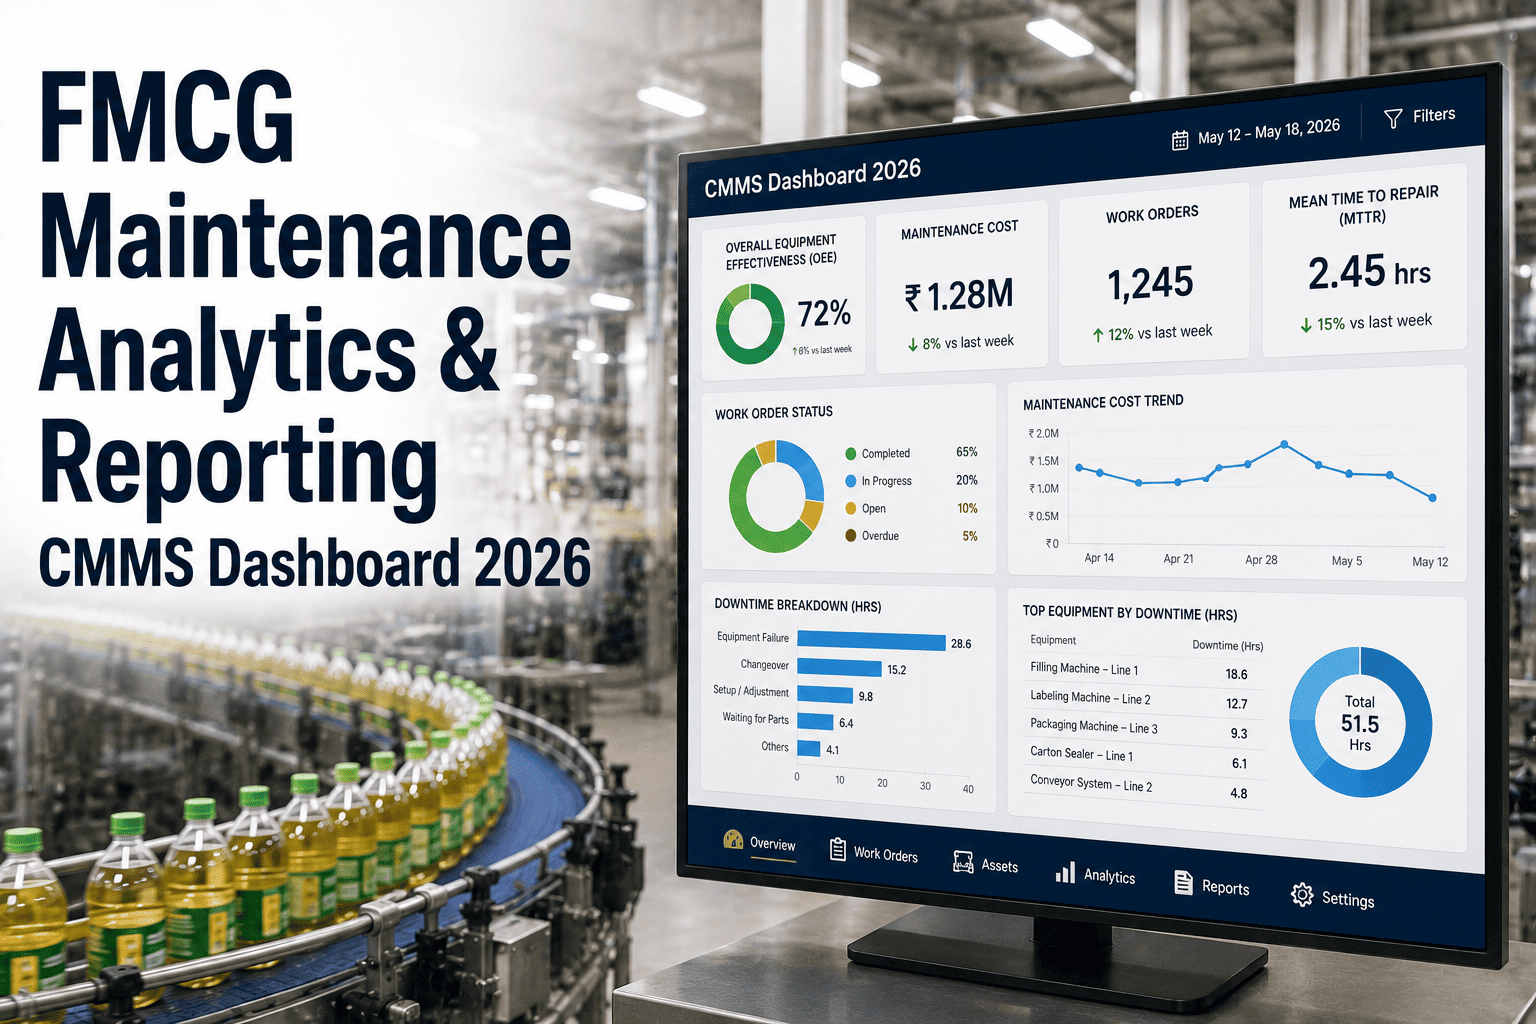
Work order counts, PM compliance rates, MTTR, MTBF, and parts spend per period — the operational scorecard that tells maintenance leadership where the programme stands today
Downtime frequency and duration by asset, line, and failure code — establishes the baseline that all improvement is measured against
Cost per work order type (corrective vs. PM vs. emergency) — quantifies the planned/unplanned cost ratio that drives the ROI case for improvement
Decisions enabled: Budget allocation, headcount planning, performance reporting
Layer 2
Diagnostic AnalyticsWhy It Happened
Root cause analysis across work order history — identifies failure modes that generate disproportionate downtime relative to their frequency, pointing to systemic rather than random failures
Asset-level failure clustering — detects when the same failure mode recurs on the same asset class, indicating a design, lubrication, or PM interval issue
PM gap analysis — correlates PM compliance deficits with subsequent failure events to quantify the actual cost of a skipped service
Decisions enabled: Root cause elimination, PM interval adjustment, parts specification changes
Layer 3
Predictive AnalyticsWhat Will Happen
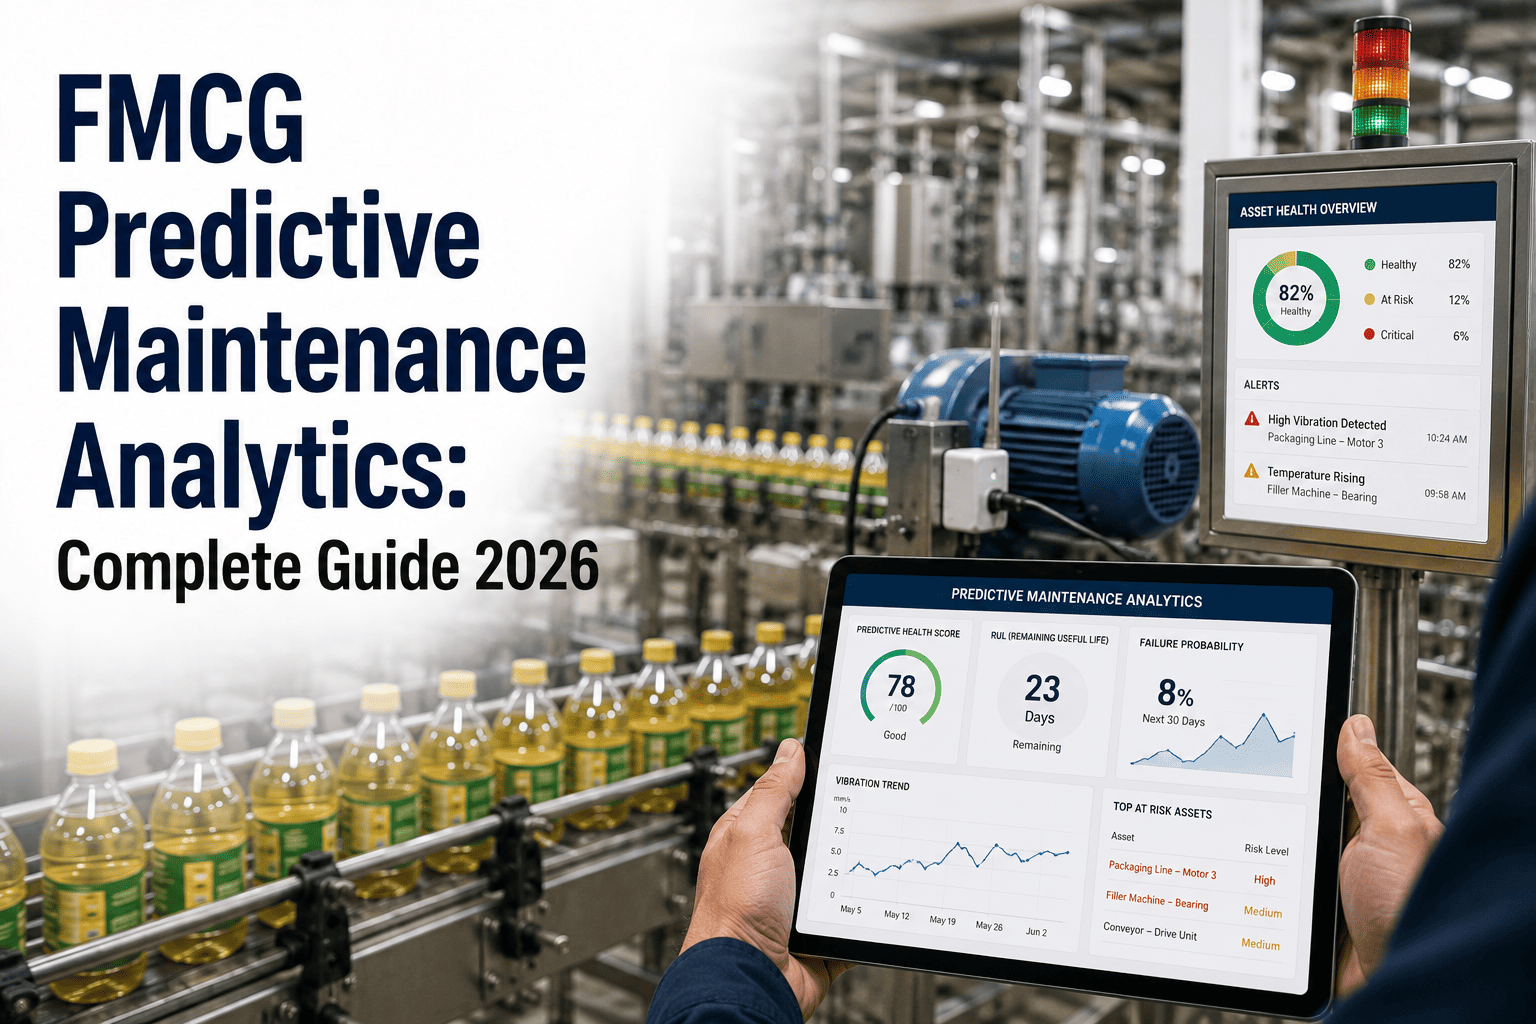
Failure probability scoring per asset based on age, recent work order frequency, sensor trend data, and historical failure patterns — ranked by production risk and repair cost
Parts demand forecasting 14–28 days ahead based on consumption velocity, upcoming PM schedule, and predictive failure alerts — eliminates emergency procurement
Condition-based PM timing — replaces fixed-interval schedules with data-driven triggers aligned to actual asset degradation rather than calendar
Decisions enabled: Proactive work order scheduling, inventory right-sizing, planned intervention timing
Layer 4
Prescriptive AnalyticsWhat to Do
AI-generated maintenance recommendations — specific work orders for specific assets at specific times, with recommended parts, technician skill requirements, and optimal production window
PM programme optimisation — automatic identification of over-maintained assets (PM frequency exceeds failure risk) and under-maintained assets (failure rate indicates intervals need tightening)
Resource allocation recommendations — daily workload distribution across technicians and shifts optimised for backlog, PM schedule, and incoming predictive alerts
Decisions enabled: Autonomous work order generation, programme optimisation, resource scheduling
Oxmaint's analytics platform delivers live descriptive KPIs, diagnostic root cause reports, predictive failure scoring, and AI-generated work order recommendations — all surfaced from your existing CMMS data without a separate BI tool.
Twelve Maintenance KPIs Every FMCG Analytics Dashboard Must Track
The metrics that connect maintenance programme performance to production and financial outcomes
KPI
What It Measures & Why It Matters
Target / Benchmark
MTBF
Mean time between failures per asset — the primary measure of equipment reliability improvement. Rising MTBF confirms PM and predictive interventions are preventing failures, not just responding to them.
Trending Up
MTTR
Mean time to repair — measures response and repair efficiency. Decreasing MTTR indicates improving diagnostic capability, better parts availability, and optimised work order execution.
Trending Down
PM Compliance Rate
Percentage of scheduled PM tasks completed on time. Below 85% is a leading indicator of increased unplanned failures within 60–90 days. Analytics links compliance gaps to subsequent failures to quantify the cost of each deferred PM.
> 90%
Planned vs. Reactive Ratio
Percentage of total maintenance work that is planned vs. reactive. Best-in-class FMCG plants achieve 80%+ planned work. Below 60% planned indicates a programme that is perpetually behind its own failures.
> 80% Planned
Cost per Asset per Year
Total maintenance spend (labour + parts + contractor) attributed per individual asset annually. Identifies chronic problem assets consuming disproportionate resource and enables asset replacement vs. continued repair decisions.
Trending Down
Emergency Repair Rate
Percentage of corrective work orders classified as emergency priority. Emergency repairs cost 4.8× planned repairs on average — every 1% reduction in emergency rate delivers measurable cost impact. Target below 5% of total work order volume.
< 5% of WOs
First-Time Fix Rate
Percentage of corrective work orders resolved in a single visit without return trips. Low rate indicates diagnostic gaps, parts availability issues, or skill-to-task mismatches. Analytics identifies which failure types have the lowest first-time fix rates.
> 85%
OEE Maintenance Contribution
Portion of OEE availability loss attributable to maintenance-related downtime. Connects maintenance performance directly to production output — allows investment to be justified in production value terms rather than cost reduction alone.
OEE > 85%
Parts Inventory Turnover
MRO inventory value consumed per period divided by average inventory holding. Low turnover indicates overstocking and capital lock-up. High turnover with frequent stockouts indicates under-stocking. Analytics finds the right-sizing point for each SKU.
4–8× per year
Work Order Backlog Age
Average age of open corrective work orders in days. Growing backlog age signals a team operating beyond capacity — the backlog represents deferred risk accumulating on the plant floor. Analytics surfaces highest-risk items for priority escalation.
< 14 Days
Repeat Failure Rate
Percentage of work orders where the same failure mode recurs on the same asset within 90 days. High repeat failure rate indicates repair quality issues, incorrect root cause identification, or inadequate PM coverage on the failure mode.
< 8%
Technician Utilisation Rate
Percentage of available technician hours spent on productive maintenance work — excluding travel, waiting for parts, and admin. Analytics identifies time lost to avoidable delays that inflate MTTR without adding repair value.
> 75%
Six High-Value Analytics Findings from FMCG Maintenance Data
What structured analytics consistently reveals when applied to FMCG CMMS datasets for the first time
Analytics for Robotic Systems and IoT Sensor Networks
How FMCG smart factory assets generate and consume analytics differently from traditional equipment
Cobot Joint Health Scoring
Torque deviation scores per joint per motion programme — analytics tracks the trajectory of each joint's health index over time and recommends regreasing or gearbox inspection at the optimal point before performance impact.
Continuous
AMR Fleet Utilisation Analytics
Mission completion rates, battery cycle consumption vs. predicted, route deviation frequency, and charging pattern analysis across the AMR fleet. Identifies units with degrading navigation performance before they cause route failures.
Fleet-Level
Sensor Network Data Quality
Connectivity uptime, calibration drift detection, and anomalous reading identification across the IoT sensor network. Flags sensors generating implausible readings before they corrupt predictive models — ensuring ML algorithm inputs are trustworthy.
Data Integrity
Cross-Asset Failure Correlation
Compares failure patterns across identical equipment models across multiple lines or sites. A bearing failing on Line 3 at 14,000 operating hours across six consecutive replacements predicts the failure timing for the same bearing type on Lines 1, 2, 4, and 5.
Fleet Intelligence
Energy Consumption Analytics
Motor current draw efficiency trending identifies equipment running above rated power consumption — a signal of mechanical degradation that predates failure. Quantifies energy waste from degraded equipment and the savings from planned maintenance intervention, adding sustainability metrics to the ROI case.
Efficiency & ESG
Maintenance Analytics ROI — FMCG Plant Value Model
Mid-size FMCG plant — 3–5 production lines — 800–1,200 assets — 15–25 maintenance staff
Failure Pattern Elimination
Chronic failure loops identified and root-cause resolved — each eliminated repeat-failure asset removes $12K–$28K in annual corrective spend. Typical FMCG plant resolves 8–14 chronic failure loops within first year of analytics deployment.
$96K–$390K/yr
PM Programme Right-Sizing
Eliminating over-maintained assets reduces PM labour hours by 15–20%. Tightening under-maintained intervals prevents failures worth 3–6× the additional PM cost. Net optimisation delivers 18–25% reduction in total PM spend with improved reliability.
$55K–$145K/yr
Emergency Repair Avoidance
Predictive analytics converting 30–40% of future unplanned failures to planned interventions at 4.8× cost differential. Each prevented emergency on a critical FMCG line saves $8K–$22K in repair cost plus $35K–$95K in production loss.
$215K–$580K/yr
Inventory Optimisation
Consumption analytics right-sizing MRO inventory — eliminating overstock on slow-moving parts and increasing safety stock on consumption-anomaly items. Typical 18–22% reduction in total MRO holding value while reducing stockout-related delays.
$42K–$110K/yr
Technician Efficiency Gains
Analytics-identified MTTR improvement opportunities reducing average repair time by 15–25% through parts staging, diagnostic information, and skill-to-task alignment. 15 technicians saving 30 minutes per shift on non-productive time delivers significant annual labour value recovery.
$38K–$95K/yr
Total Annual Analytics-Driven Maintenance Value
$446K–$1.3M/yr
Analytics platform investment typically $18K–$55K/year for a plant of this scale within Oxmaint. Net ROI: $428K–$1.24M/year. Return multiple: 8–24× in year one. The ROI compounds as the analytics model accumulates more historical data and the maintenance programme improves against its own baseline.
Frequently Asked Questions
The minimum viable dataset for maintenance analytics is 12 months of work order history with asset IDs, failure codes, labour hours, and parts consumed. This alone enables descriptive analytics (what happened, at what cost) and diagnostic analytics (which assets drive disproportionate spend and which failure modes recur). Sensor data is needed for predictive analytics but is not required to start — many FMCG plants achieve significant ROI from work order and PM analytics before deploying a single IoT sensor. The key is data completeness within the CMMS: work orders closed with failure codes, parts consumption logged at work order closure, and downtime duration recorded per event. Plants with six months of this data can begin their first analytics review; plants with 18+ months achieve full predictive capability faster.
Standard CMMS reports are descriptive summaries — work order counts, PM completion percentages, and cost totals for a defined period. They answer "how many" and "how much" but not "why," "what next," or "what should we do differently." Maintenance analytics adds three capabilities that standard reports do not provide: pattern detection across the full historical dataset (identifying that 47 corrective work orders on three assets over 18 months represent a systemic failure); predictive scoring that combines work order history, sensor trends, and failure patterns to estimate which assets will fail and when; and prescriptive recommendations that generate specific, prioritised actions from the analytical findings. Oxmaint's analytics layer delivers all four analytics layers without requiring export to a separate BI tool.
The three KPIs with the highest correlation to FMCG production and financial outcomes are: planned vs. reactive work ratio (the single strongest leading indicator of future unplanned downtime — plants below 60% planned work are statistically guaranteed to experience significant unplanned production losses within 90 days); repeat failure rate (chronic failure loops generate 3–5× the cost of equivalent one-time repairs and are the most direct target for cost reduction analytics); and PM compliance rate on critical assets (below 85% compliance on Tier 1 production equipment predicts a measurable increase in unplanned failures within 60 days). Secondary KPIs — MTTR, parts inventory turnover, and first-time fix rate — require 90+ days of data to show meaningful trend signals.
Single-site plants with 3–5 lines benefit most from asset-level analytics — identifying the specific assets that drive disproportionate cost, detecting failure patterns that manual reporting misses, and optimising PM intervals for their specific asset population. Multi-site operations gain an additional analytics layer: cross-site comparison. When the same asset type is deployed across four facilities and one site achieves 40% lower failure rates, analytics can identify the specific PM practices, operating parameters, or spare parts specifications that explain the performance gap — and standardise them across the network. This cross-fleet intelligence is the highest-value analytics capability in multi-site FMCG operations, and it delivers results proportional to the number of identical assets across the network.
The first actionable findings from descriptive and diagnostic analytics are typically visible within the first dashboard review — often within 30 days of deploying analytics on existing CMMS data. The Malaysia case study above identified three critical assets in progressive failure within the first review session. Measurable operational impact becomes statistically reliable at 60–90 days, as planned interventions derived from analytical findings begin displacing reactive breakdowns. Full ROI measurement incorporating downtime reduction, parts optimisation, and PM programme efficiency is achievable within 6 months of consistent analytics-driven decision-making. Plants that conduct weekly analytics reviews and translate findings into work orders within 48 hours consistently achieve results at the faster end of this range.
Analytics Dashboard + AI Insights — Built for FMCG Maintenance
Turn Your Maintenance Data Into Decisions That Improve Reliability 35%
Oxmaint's analytics platform surfaces the patterns, trends, and predictions buried in your CMMS data — and translates them into prioritised maintenance actions without a separate BI tool or data science team.
Live KPI Dashboard — 12 Maintenance Metrics Updated in Real Time
Failure Pattern Detection — Chronic Loops Surfaced Automatically
Predictive Failure Scoring — Asset Risk Ranked by Production Impact
PM Effectiveness Analytics — Tasks That Prevent Failures vs. Tasks That Don't
Parts Consumption Intelligence — Demand Forecast 14–28 Days Ahead
AI Work Order Recommendations — Prescriptive Actions From Analytical Findings
Works with your existing CMMS data. No separate BI infrastructure required. Used by FMCG maintenance teams across food, beverage, personal care, and household products.