In FMCG manufacturing, maintenance departments often operate in a silo — measured by wrench time, work order completion rates, or total maintenance spend. But none of these metrics answer the question that matters most to operations and finance leaders: how much does maintenance cost for every unit we produce? Maintenance cost per unit produced (MCPU) is the metric that closes this gap. It translates maintenance activity into the language of production economics, making it possible to compare plants, justify investments, and align maintenance strategy with business objectives. Start your free trial today and begin tracking MCPU in real time across every line, shift, and product. Schedule a 30-minute demo with our FMCG facilities specialists to see cost analytics in action for your plant.
Start Tracking Your Maintenance Cost Per Unit Today
OxMaint's Cost Analytics module calculates MCPU in real time — across every line, shift, and product. No spreadsheets. No guesswork.
Reactive / Calendar-Based
Maintenance Cost Visibility
Monthly Spreadsheet — 4–6 Week Lag
Cost Per Unit Awareness
Unknown — Never Calculated
Emergency Repair Cost Premium
3–5× Planned Maintenance Rate
Budget Accuracy
±35% Variance Year Over Year
MCPU-Driven / Predictive
Maintenance Cost Visibility
Real-Time Dashboard — Every Hour
Cost Per Unit Awareness
Tracked Per Line, Shift, and SKU
Emergency Repair Cost Premium
1× Planned Rate (70% Fewer Events)
Budget Accuracy
±8% Variance — Data-Driven Forecasts
Average Annual Savings for a 5-Line FMCG Plant: $180K – $420K
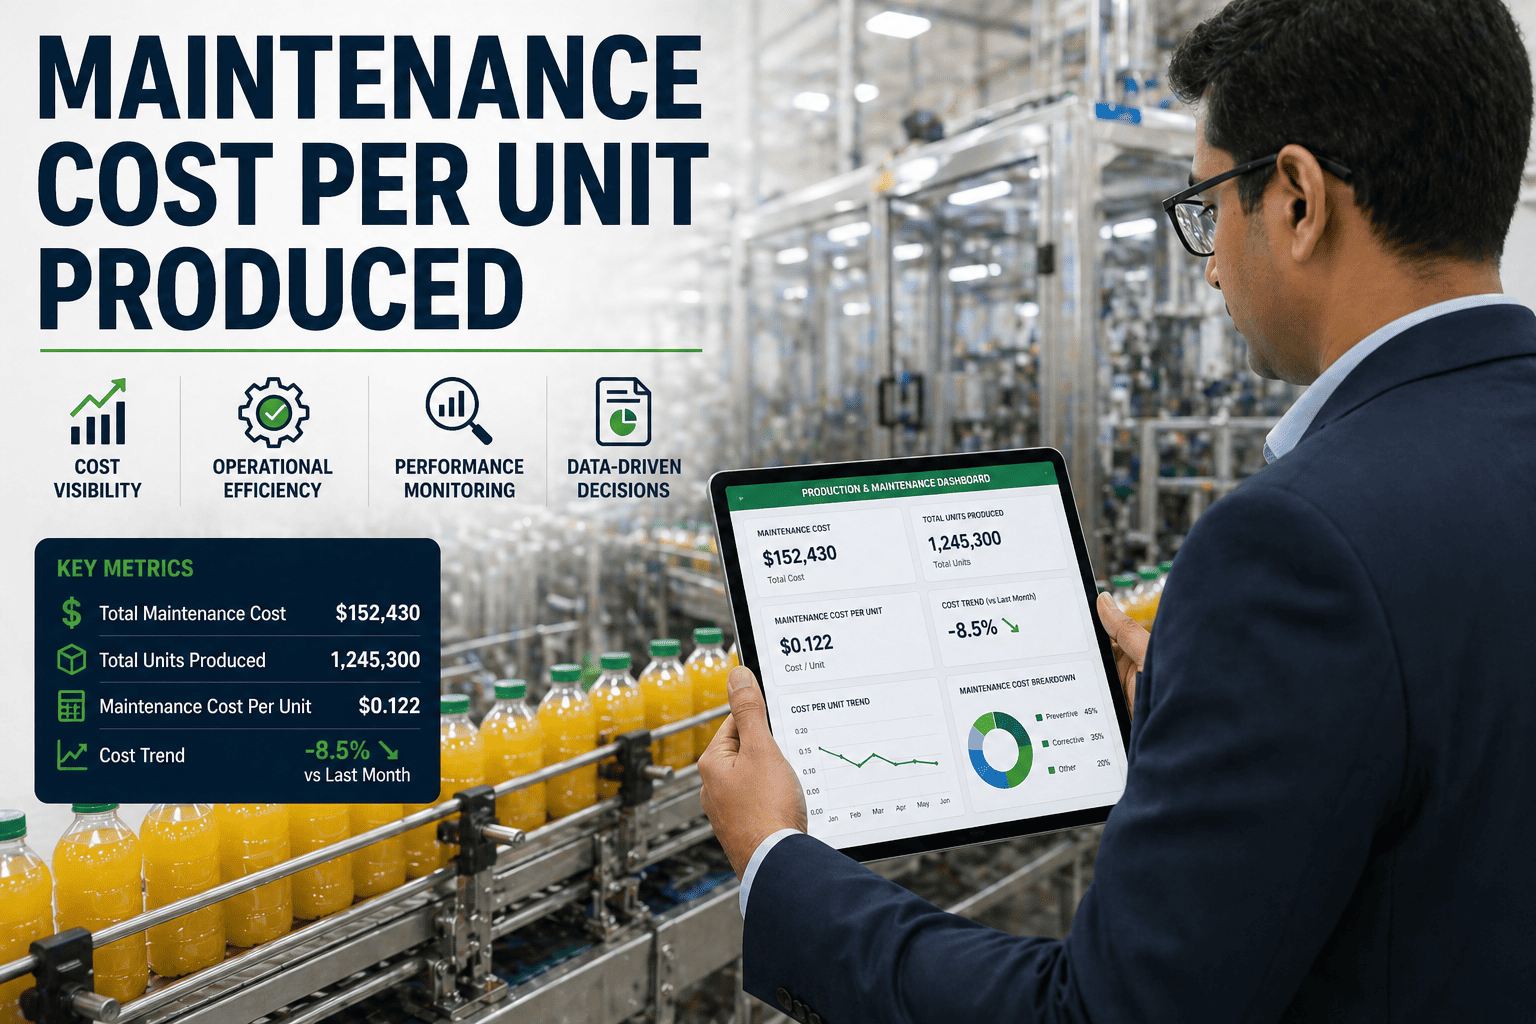
What Is Maintenance Cost Per Unit Produced?
Maintenance cost per unit produced is a ratio that divides total maintenance expenditure by the total number of units manufactured within the same period. It expresses the maintenance burden carried by every single product that leaves your production line. Unlike standalone maintenance KPIs that only tell you about the health of your maintenance function, MCPU tells you about the economic efficiency of maintenance relative to what the plant actually delivers. A plant spending $180,000 on maintenance sounds expensive — until you learn it produces 900,000 units monthly, resulting in an MCPU of just $0.20.
$
The Formula
MCPU = Total Maintenance Cost ÷ Total Units Produced
Example: $450,000 ÷ 900,000 units = $0.50/unit
Track monthly, weekly, or daily with CMMS integration
Output: $ Per Unit
↑
Numerator: Total Cost
Labour: wages, overtime, benefits, contractors
Parts: spares, consumables, lubricants, filters
Services: OEM contracts, calibration, tools, software
Include: All Maint. Spend
↓
Denominator: Units
Standard units: count per finished product
Equivalent units: weighted conversion for multi-SKU
Weight/volume: kg or litres for bulk manufacturing
Method: Match Your Plant
Why MCPU Matters Specifically for FMCG Plants
FMCG manufacturing operates under conditions that make MCPU uniquely valuable compared to other industries. High volumes, thin margins, frequent changeovers, and seasonal demand fluctuations create a perfect storm where small per-unit cost shifts translate into massive P&L impact. Plants deploying cost analytics through OxMaint see these dynamics clearly for the first time.
Production Economics
<10%
Typical FMCG margins — $0.05/unit shift erodes profits across millions of units monthly
Seasonal Normalization
±40%
Volume swings during promotions and seasons — MCPU normalizes spend vs actual output
Multi-Plant Comparison
1:1
Apples-to-apples benchmarking across plants regardless of size, product, or equipment age
SKU Complexity Impact
Hidden
Multiple changeovers per shift increase wear — MCPU captures product mix maintenance cost
Cost Components: What Goes Into the MCPU Numerator
A comprehensive maintenance cost figure must include every category of expenditure that keeps production equipment running. Missing even one category produces artificially low MCPU that misleads decision-making.
Labour Costs
Technician wages, overtime premiums, benefits, contractor fees during breakdown events
35–45%
Spare Parts & Materials
Replacement parts, consumables, lubricants, filters — including emergency stock usage
25–35%
External Services
OEM service contracts, specialist repairs, calibration — amortized correctly across periods
10–15%
Tools & Equipment
Specialized tools, testing instruments, safety equipment — depreciated within maintenance budgets
5–8%
Technology & Software
CMMS licenses, condition monitoring systems, IoT sensors — not classified under IT budgets
3–7%
Total Numerator Must Equal
100%
Common oversight: 23% of FMCG plants misclassify maintenance software under IT budgets, overtime under production labour, or emergency stock under general inventory — producing artificially low MCPU figures that hide the true maintenance cost burden.
Track Every Maintenance Cost Component Automatically
OxMaint's Cost Analytics module captures labour hours, parts consumed, and contractor invoices from every work order — tagged to specific assets and time periods without manual data entry. MCPU calculated in real time across every line, shift, and product.
FMCG Benchmarks: Where Should Your MCPU Stand?
Benchmarking MCPU requires context. A $0.30 per unit cost might be excellent for a complex personal care line but alarming for a simple bottling operation. These benchmarks assume plants operating at 70%+ OEE — plants below this threshold show inflated MCPU because the denominator is suppressed by downtime, not because maintenance is inherently inefficient. Schedule a demo to benchmark your plant against industry peers.
Packaged Beverages
$0.01–$0.03
Per litre equivalent — high-speed bottling, minimal changeover complexity
Dairy Processing
$0.02–$0.05
Per litre equivalent — CIP systems, temperature-critical, hygiene compliance
Snacks & Confectionery
$0.02–$0.05
Per kg equivalent — extruders, fryers, seasoning drums, packaging lines
Personal Care
$0.03–$0.08
Per standard unit — filling lines, labelling, complex product formulations
Home Care & Detergents
$0.01–$0.03
Per kg equivalent — bulk processing, simpler equipment, fewer changeovers
Baked Goods
$0.01–$0.04
Per kg equivalent — ovens, proofers, cooling conveyors, wrapping machines
Five Strategies to Reduce MCPU in FMCG Operations
Reducing MCPU is not simply about cutting maintenance budgets. In fact, underspending on maintenance often increases MCPU by causing breakdowns that crush production volume. The most effective strategies work on both sides of the equation simultaneously — reducing the numerator while protecting or increasing the denominator.
01
Shift Reactive → Preventive
Reactive costs 3–5× more per intervention
Every unplanned stop reduces units produced
Shift 20% of reactive to preventive schedules
Impact: 8–15% MCPU Drop
02
Condition-Based Monitoring
Vibration, thermal, and oil analysis on critical assets
Maintain exactly when needed — not too early or late
Optimizes both cost and output simultaneously
Impact: Both Sides Optimized
03
Spare Parts Optimization
ABC analysis combined with lead time data
Eliminate excess stock tying up capital
Prevent downtime from missing critical spares
Impact: Cost + Downtime Cut
04
Autonomous Maintenance
Operators handle cleaning, lubrication, inspection
Catch problems before they escalate to breakdowns
Mature programmes proven across FMCG plants
Impact: 10–20% MCPU Drop
What CMMS Data Reveals
Asset-Level Cost Concentration
20% of machines drive 60–80% of total spend
Failure Mode Patterns
Recurring failures on same components — root cause fixable
Parts Category Analysis
Top 10 parts by spend — negotiate or substitute
Targeted Improvement
Specific actions on highest-cost assets — not broad cuts
Result: Targeted Savings Without Undermining Reliability
How MCPU Connects to Other Maintenance KPIs
MCPU does not exist in isolation. It serves as a capstone metric that reflects the performance of underlying maintenance processes. Understanding these connections helps diagnose why MCPU might be trending in a particular direction — and which lever to pull to change it.
OEE
Higher OEE increases units produced, directly lowering MCPU even if maintenance spend stays flat
↓ MCPU
MTBF
Longer mean time between failures means fewer repair events — reducing emergency costs and production losses
↓ MCPU
PM Compliance
Higher compliance prevents costly breakdowns, keeping the cost numerator controlled and predictable
↓ MCPU
Planned vs Unplanned
Higher planned percentage means more cost-efficient interventions and fewer production disruptions
↓ MCPU
All Roads Lead To
Lower MCPU
See Your MCPU Dashboard in Action
OxMaint's Production Integration module automatically pulls production counts and maps maintenance costs to every unit. Get plant-wide, line-level, and asset-level MCPU breakdowns — with trend analysis, rolling averages, and export-ready reports for leadership review.
Common Pitfalls When Tracking MCPU
Many FMCG plants begin tracking MCPU with enthusiasm but produce unreliable numbers due to avoidable mistakes. Understanding these pitfalls — and their proven solutions — ensures your MCPU data drives accurate decisions from day one.
Inconsistent Cost Capture
Critical
Costs booked under production or IT budgets make MCPU appear artificially low — audit monthly
Ignoring Capital Maintenance
Critical
Major overhauls excluded as "capital projects" — if it keeps equipment running, include it in MCPU
Mismatched Time Periods
Operational
Monthly MCPU without accounting for shutdowns or seasonal ramps — use rolling averages instead
Chasing Low MCPU Blindly
Downstream
Cutting maintenance to lower MCPU causes catastrophic failures that spike both costs and lost production
Building a MCPU Reporting Framework
For MCPU to drive decisions, it must be reported at multiple levels of granularity and reviewed at appropriate frequencies. The framework below ensures every stakeholder — from line supervisors to plant directors — gets the MCPU view they need at the cadence that enables action.
L1
Plant Level
Aggregate MCPU across all lines
Executive reporting and budget planning
Inter-plant benchmarking comparisons
Cadence: Monthly
L2
Line Level
MCPU per production line
Identify cost-efficient vs problem lines
Rapid response to emerging issues
Cadence: Weekly
L3
Asset Level
Individual machine MCPU drill-down
Repair-or-replace decision support
Capital planning with condition data
Cadence: As Needed
L4
Product / SKU Level
Allocate maintenance cost to specific products
True product profitability analysis
SKU rationalisation decision support
Cadence: Quarterly
The Role of CMMS in Accurate MCPU Tracking
Manual MCPU calculation using spreadsheets is feasible but fragile. A modern CMMS transforms MCPU from a quarterly report exercise into a live operational metric by automating three critical functions. Plants implementing this through OxMaint connect their existing production systems to maintenance cost data without replacing any current infrastructure.
01
Auto Cost Accumulation
Every work order captures labour, parts, invoices
Costs tagged to specific assets and periods
Eliminates manual classification errors
Result: 100% Capture
02
Production Integration
MES, ERP, SCADA data pulled automatically
Unit counts synced without manual collection
Eliminates delay and data entry errors
Result: Real-Time Data
03
Multi-Dimensional Analysis
Slice MCPU by asset, line, shift, product
Failure type and maintenance category views
Diagnostic tool — not just a single number
Result: Actionable Insight
Your Plant's MCPU Optimization Starts Here.
Whether you're tracking MCPU for the first time or optimizing an existing programme, OxMaint's Cost Analytics and Production Integration modules are built for exactly this transformation — in FMCG plants, with food safety compliance built in from day one. Real-time dashboards, automated cost capture, multi-plant benchmarking, and line-level drill-down — all from one platform.
Frequently Asked Questions
What is a good maintenance cost per unit for FMCG?
It varies significantly by sub-sector and product complexity. Beverage bottling operations typically achieve $0.01–$0.03 per litre equivalent, while personal care manufacturing ranges from $0.03–$0.08 per standard unit. The most meaningful benchmark is your own MCPU trend over time rather than cross-industry comparisons.
Sign up free to start benchmarking your plant's MCPU.
How often should MCPU be calculated?
Monthly calculation is the standard for reporting and trend analysis. However, plants using a CMMS with production integration can track MCPU weekly or even daily at the line level, enabling faster response to cost deviations. The key is choosing a frequency that matches your ability to act on the data — daily tracking is pointless if reviews only happen monthly.
Should maintenance cost per unit include downtime losses?
The standard MCPU formula uses direct maintenance costs only. However, some organisations calculate an "extended MCPU" that includes the production value lost during maintenance-related downtime. This provides a fuller picture of the true cost of maintenance activities but requires accurate downtime valuation — which many plants lack until they implement a CMMS with integrated production tracking.
How does MCPU differ from maintenance cost as a percentage of RAV?
Maintenance cost as a percentage of Replacement Asset Value (RAV) measures maintenance spend relative to the value of installed assets. MCPU measures maintenance spend relative to actual production output. Both are useful but answer different questions — RAV-based metrics assess capital stewardship while MCPU assesses production economics.
Book a demo and we'll model both metrics using your plant's actual data.
Can MCPU be applied to non-FMCG manufacturing?
Absolutely. MCPU is valuable in any manufacturing environment with measurable output units. However, it is particularly powerful in FMCG due to the combination of high volumes, thin margins, and the critical importance of uptime in meeting daily distribution demands. Pharmaceutical, automotive, and electronics manufacturers also use MCPU effectively — the formula is universal, only the benchmarks change by industry.
Every Unit You Produce Carries a Maintenance Cost. Know What It Is.
OxMaint connects your existing production systems, work order data, and parts inventory into a single MCPU intelligence platform that shows exactly where your maintenance money goes — per unit, per line, per shift. Stop guessing. Start measuring. Transform your maintenance team from a cost center to a production efficiency driver.