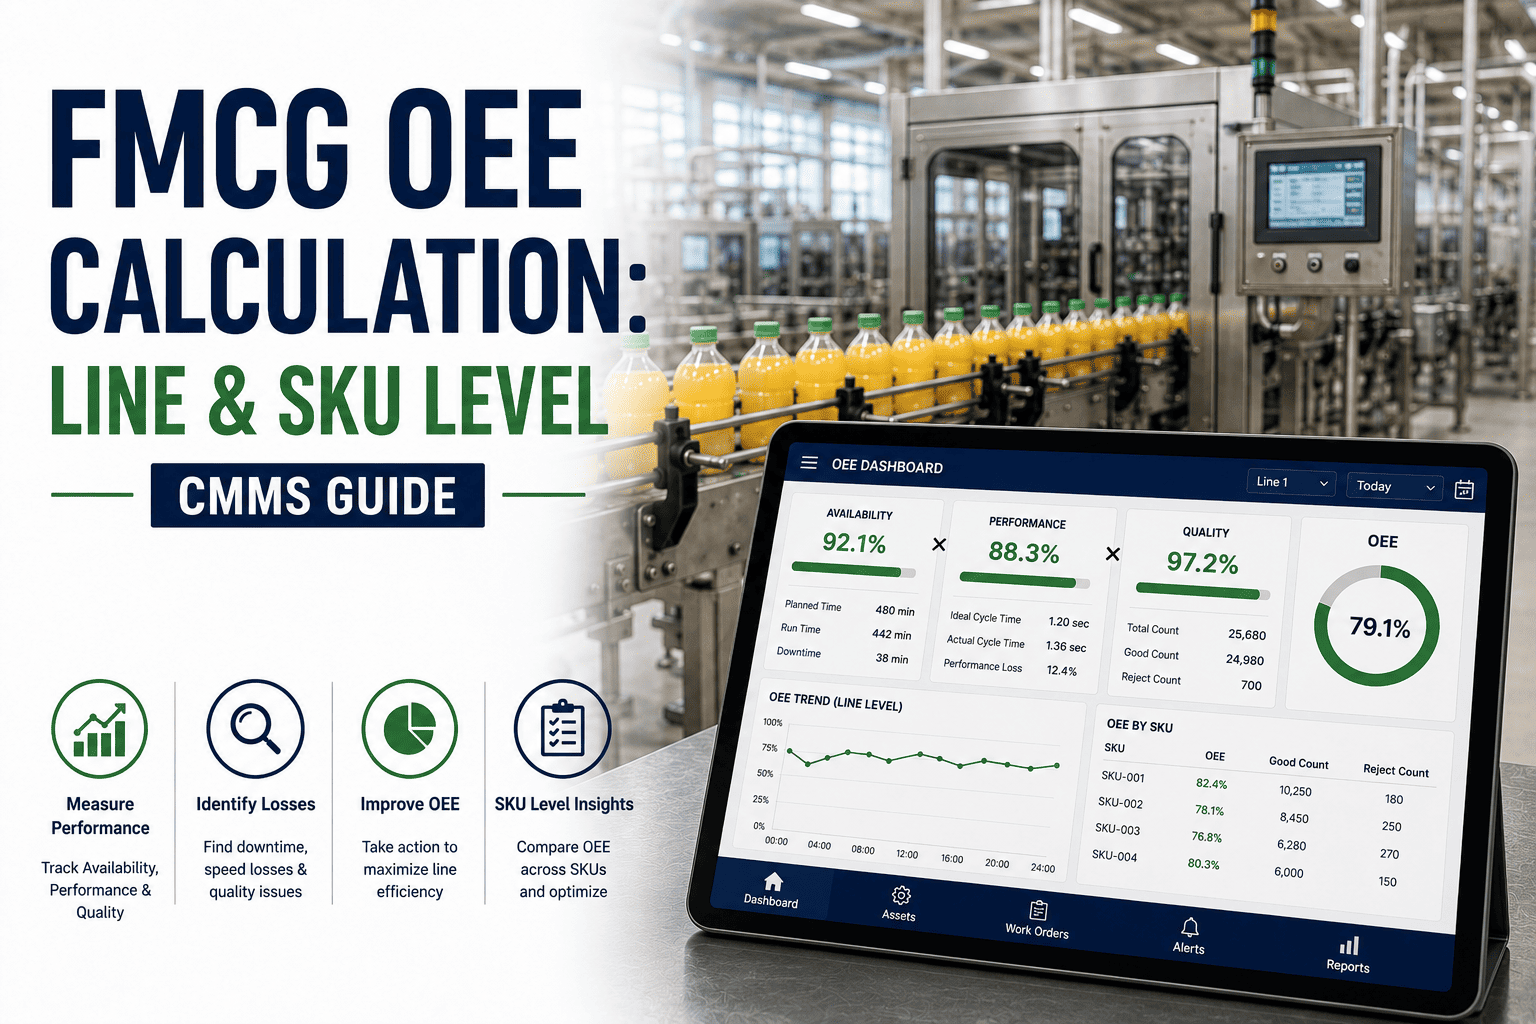
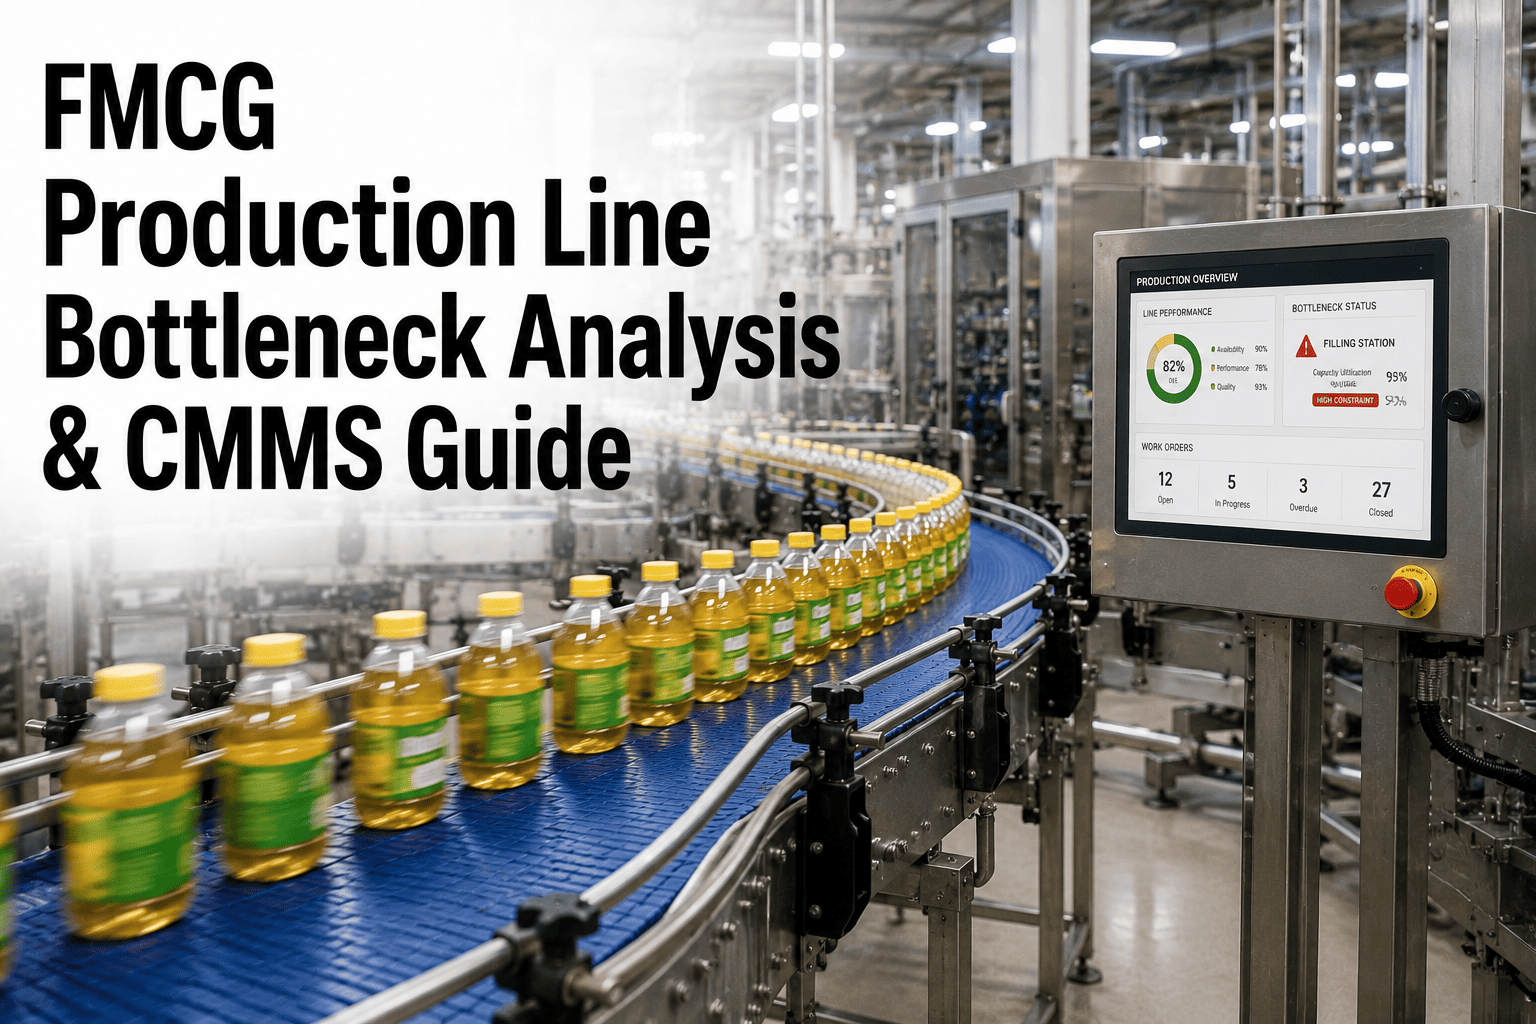
A plant-wide OEE number can say 68% and still hide the real story. One SKU on that line might be running at 85%, another dragging the average down to 40% because of a changeover nobody's fixed in years. Aggregated OEE tells you there's a problem. Line and SKU-level OEE tells you exactly where. Sign up to start calculating OEE at the level where it's actually actionable.
The Formula, In Plain Terms
OEE = Availability x Performance x Quality. Availability is run time divided by planned production time. Performance is actual output against ideal cycle time. Quality is good units divided by total units. Multiply all three, and a solid 90% score in each component still only nets a 73% OEE, which is exactly why every point in every component matters.
Where FMCG Plants Actually Sit
| Tier |
Typical OEE Range |
| Industry average |
Most FMCG plants sit around 55-70% |
| Strong performer |
75-80% with active continuous improvement |
| World-class |
85%+, achieved by only the top tier of manufacturers globally |
Stop Averaging Your Way Past The Real Problem
OxMaint calculates Availability, Performance, and Quality automatically at both the line and SKU level, so a chronic changeover issue on one product doesn't hide behind a healthy plant-wide number. Sign up for a free trial to start tracking OEE where it matters, or book a demo to see SKU-level breakdowns on your own data.
Why SKU-Level Breaks Down What Line-Level Hides
Changeover Losses Blend Together
Frequent SKU changes are one of the biggest availability drains in FMCG, but a line-wide average can't tell you which specific product transition is the slow one
Startup Waste Hides Inside The Total
Scrap and rework during post-changeover stabilization is costliest on high-value SKUs, but only shows up as a line-level quality dip unless broken out
Speed Losses Vary By Product
A denser or stickier SKU can quietly run below rated speed while a lighter one hits target, and a blended average masks the difference
Pareto Analysis Needs The Detail
In most plants, a small share of SKUs or machines drives most of the loss, and that's only visible once data is segmented, not averaged
Setting Up The Calculation Correctly
Define
Planned Production Time
Use total shift time minus scheduled breaks as the denominator, and set it per line, not per SKU, to keep the math consistent
Tag
Every Run By SKU
Track changeovers as their own availability loss category at the SKU level so each transition can be analyzed on its own
Automate
Data Capture
Manual logs systematically miss micro-stops under 5-10 minutes, which are often the largest hidden loss category in high-speed lines
A Fair Denominator Matters
FMCG plants face structural pressures that automotive lines don't: mandatory sanitation cycles, frequent SKU changeovers, and variable raw material quality. Comparing a beverage line's OEE straight against an automotive benchmark isn't fair, so the right comparison is against similar SKUs, similar line types, and the plant's own historical trend.
Frequently Asked Questions
Q
Why does SKU-level OEE matter if the line-level number looks fine?
A healthy line average can average out one badly underperforming SKU against several strong ones. Breaking OEE out by SKU is what surfaces the specific product or changeover that's actually costing the most.
Q
What's the most common mistake in setting up OEE?
Setting ideal cycle time to the average speed the line actually runs at, rather than its true rated maximum. That inflates the score and hides real performance loss behind an artificially generous denominator.
Q
How long before line and SKU-level OEE gives a reliable picture?
A minimum of about three months of shift-by-shift, automated data collection is enough to smooth out normal variation and reveal which SKUs and machines are the consistent, repeatable drag on performance.
See Exactly Where Your OEE Is Really Being Lost
OxMaint calculates Availability, Performance, and Quality automatically at the line and SKU level, so hidden losses stop hiding behind a plant-wide average. Sign up for a free trial to start tracking your real numbers, or book a demo to see SKU-level OEE mapped to your own production lines.