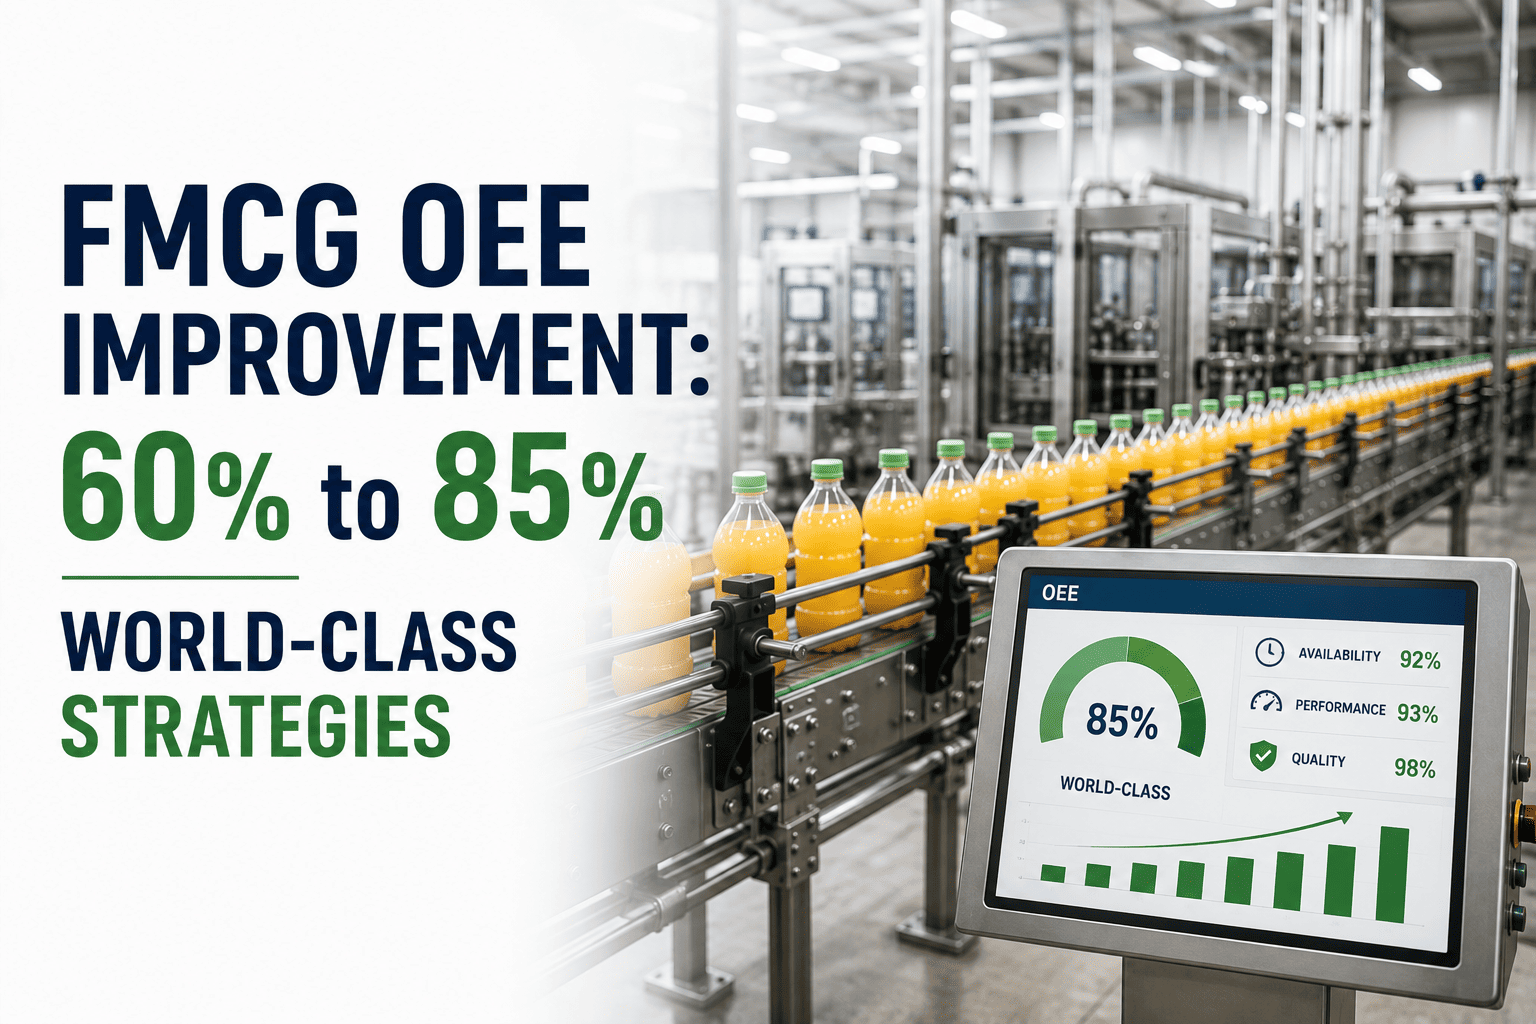
Most FMCG plants get stuck at the same number. Not because 60% OEE is a ceiling, but because the losses that hold a line there are scattered across a dozen small habits nobody has mapped. Moving from a 60% average to an 85% world-class score isn't one big fix, it's a sequence of specific, documented moves. Sign up to start tracking the exact losses standing between your line and world-class.
The 25-Point Gap, Broken Down
OEE = Availability x Performance x Quality. A plant sitting at 60% is usually losing points in all three at once, not just one. Getting to 85% rarely means fixing one giant problem, it means closing a five to ten point gap in each component, and those gaps respond to very different fixes.
The Roadmap From 60% To 85%
1
Months 0-6: Stop The Bleeding
Eliminate the top three recurring stoppages and standardize changeover steps. This phase alone typically moves a plant from the 55-65% range into the low 70s.
2
Months 6-12: Fix The Machine, Not The Symptom
Shift from reactive repairs to condition-based maintenance on the constraint line. Micro-stops and speed loss start closing here, pushing performance toward mid-70s.
3
Months 12-24: Compound The Gains
Operator-driven autonomous checks, tighter quality control at the source, and continuous SKU-level review carry the plant from the high-70s into world-class 85%+ territory.
Know Which Phase Your Plant Is Actually In
OxMaint tracks availability, performance, and quality losses in real time, so you know exactly which phase of the roadmap you're in and what to fix next. Sign up for a free trial to see your current numbers, or book a demo to walk through your loss data with our team.
Where The Biggest Wins Come From
Changeover Standardization
A documented, timed sequence for the top three recurring product changeovers usually recovers more availability than any single equipment upgrade
Micro-Stop Elimination
Stops under five minutes rarely get logged manually, yet they often add up to more lost time than the two or three big breakdowns everyone remembers
Speed Loss Recovery
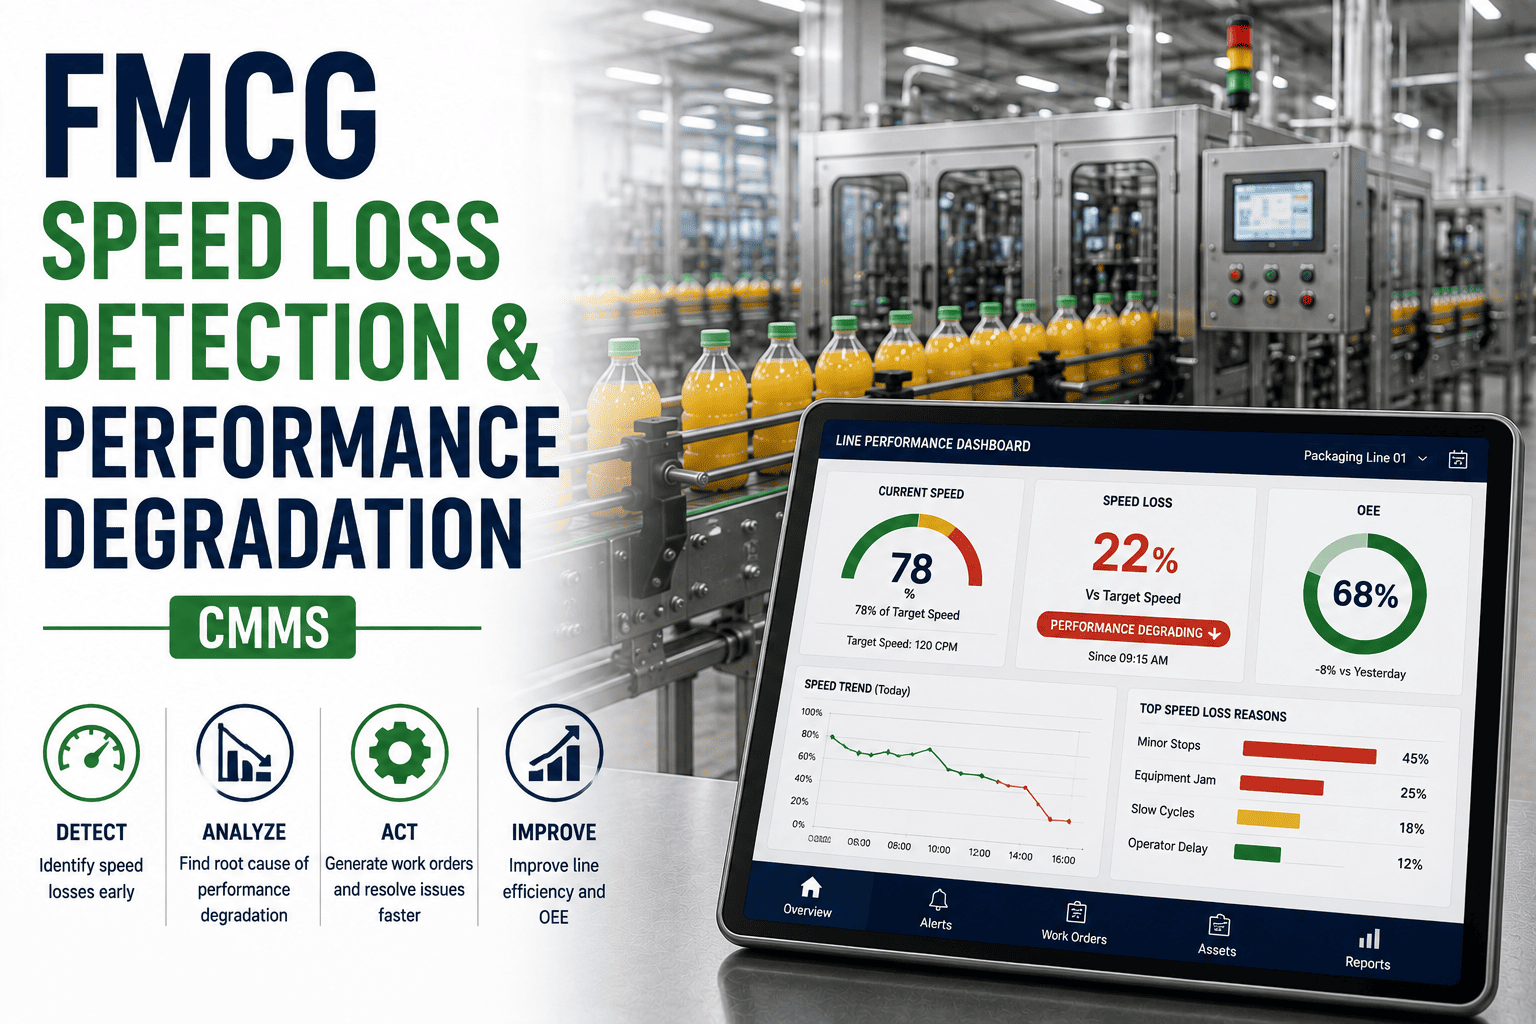
Running below rated speed to "protect" a temperamental line becomes a habit long after the original problem was fixed, and it quietly caps performance
Startup Scrap Reduction
Tightening the first few minutes after a changeover, before the line stabilizes, closes quality gaps that a full-shift average never reveals
A Different Playbook For Each Component
Availability
Reduce Stoppages
Attack changeovers and breakdowns first, since they're the fastest points to recover and the easiest to prove with before-and-after data
Performance
Close The Speed Gap
Re-baseline ideal cycle time to true rated speed, then use condition-based maintenance so operators stop running conservatively out of habit
Quality
Catch Defects Earlier
Move inspection closer to the point of changeover and raw material intake, since late-stage detection is the most expensive place to find a defect
Why A CMMS Is The Backbone Of This
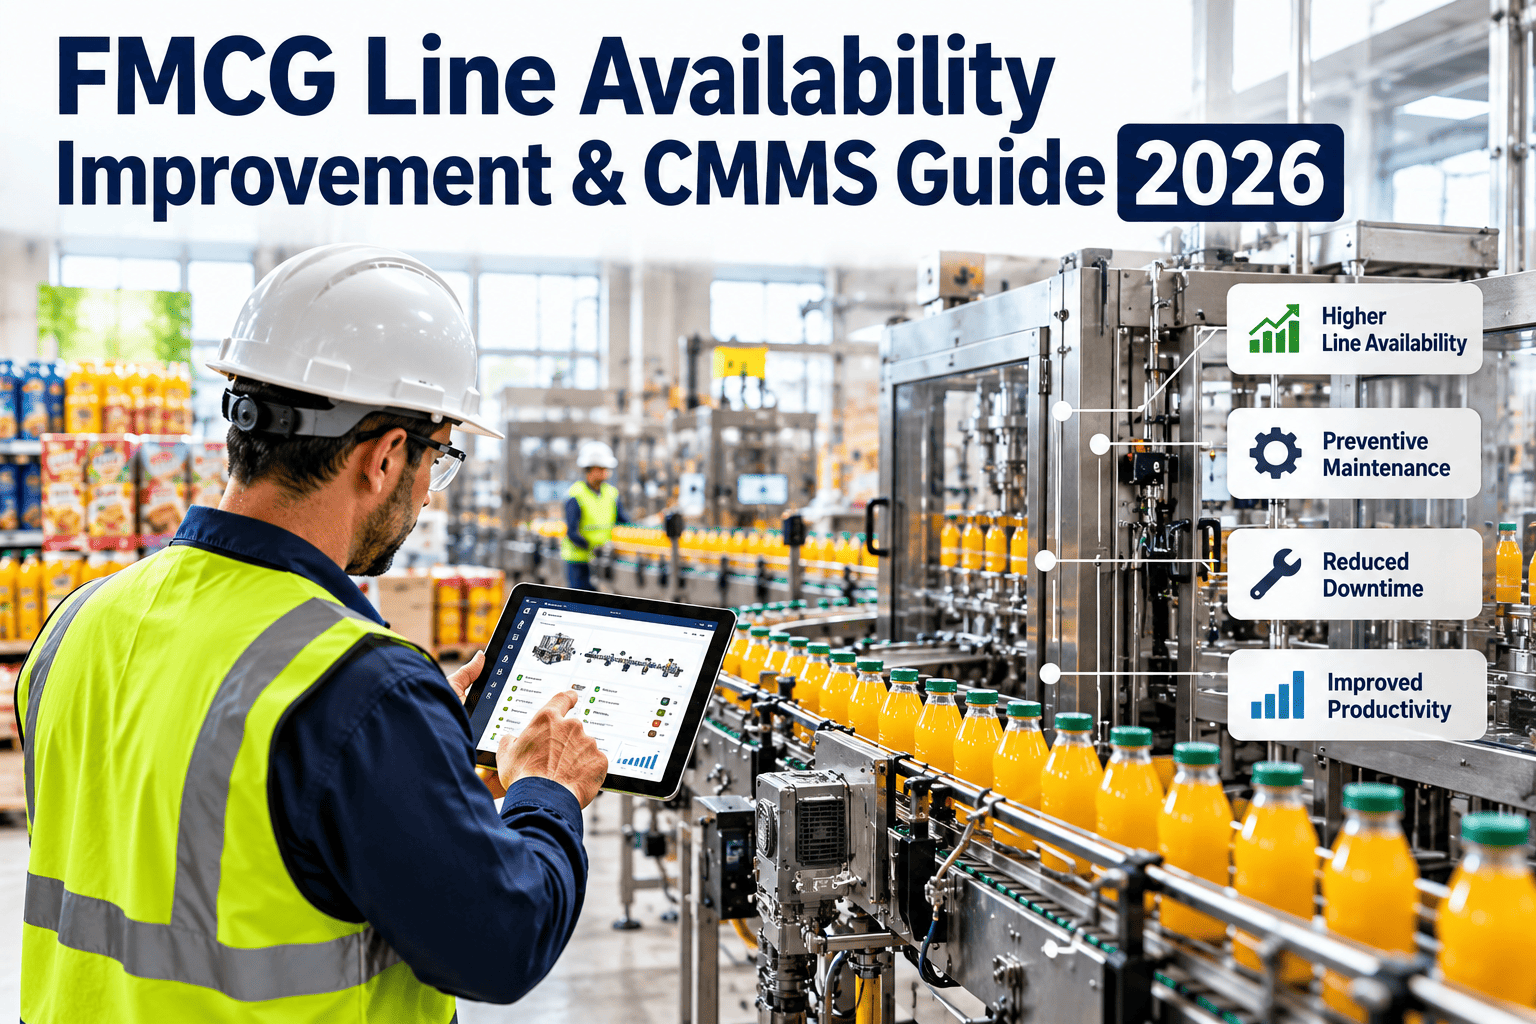
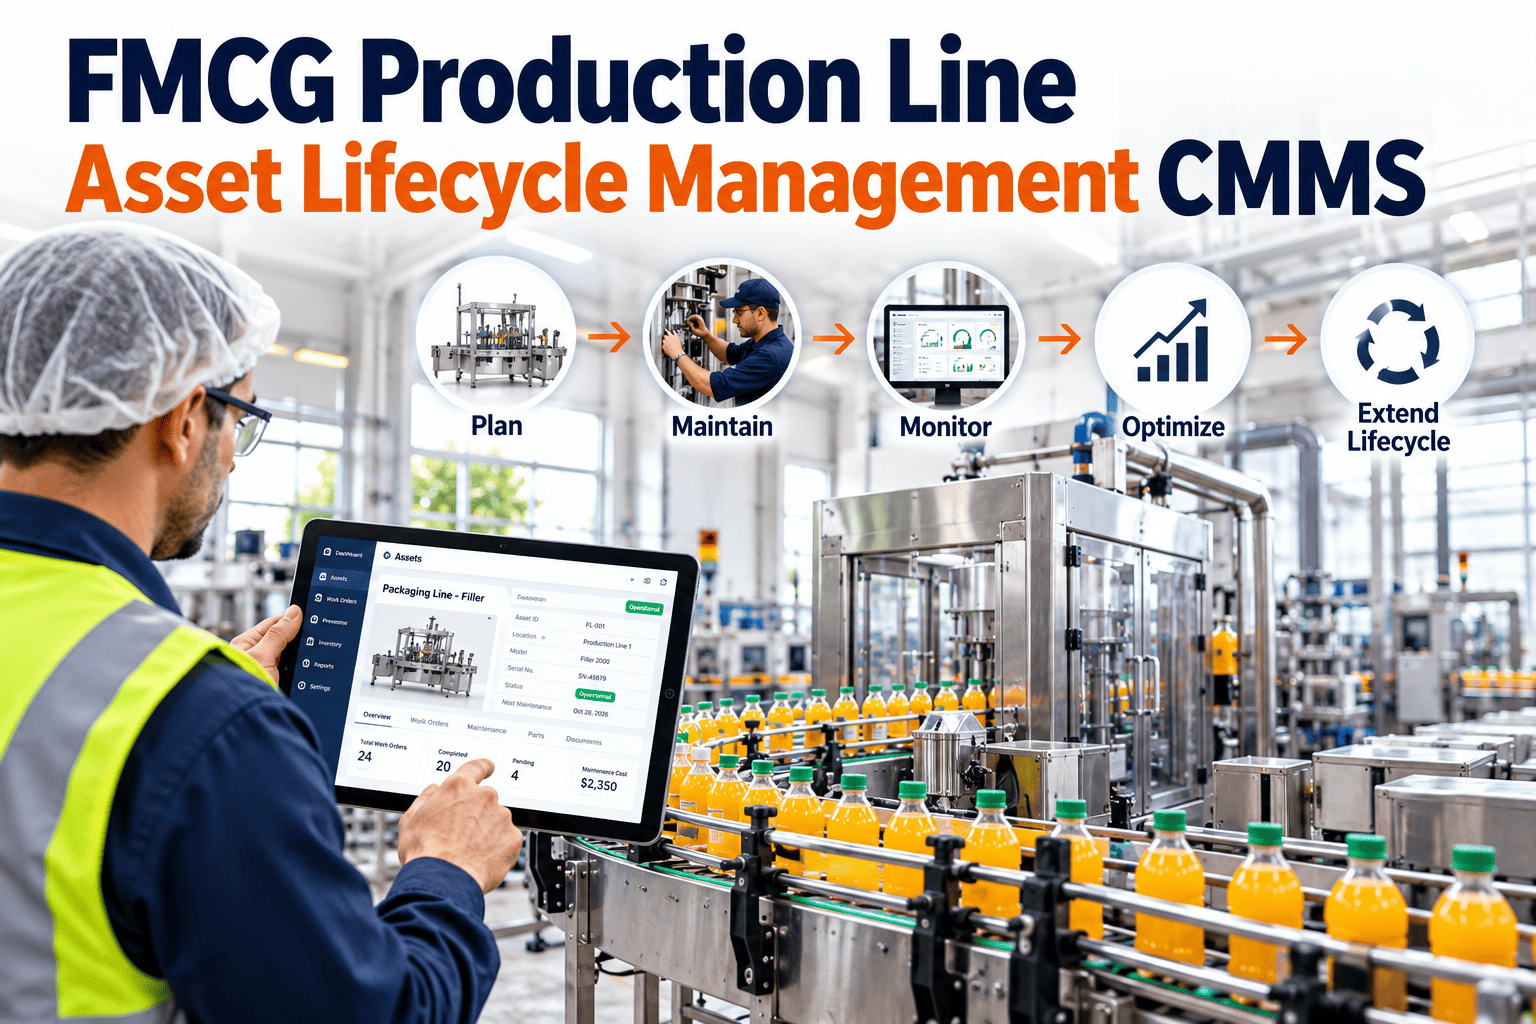
Every phase of this roadmap depends on data that manual logs can't capture consistently: exact changeover durations, micro-stop frequency, and maintenance history tied to specific failure modes. A CMMS-driven program keeps that data automated and trustworthy over the full 18-24 month climb, instead of relying on whoever remembered to write it down that shift.
Frequently Asked Questions
Q
Is 85% OEE realistic for an FMCG plant, or is that more of an automotive number?
It's realistic, but it's earned in stages over roughly 18-24 months rather than achieved through one project. Plants that hit it treat availability, performance, and quality as three separate improvement tracks running at the same time.
Q
What's the fastest win when a plant is starting near 60%?
Standardizing the changeover procedure for the highest-frequency SKU transitions. It requires no capital spend and typically shows measurable availability gains within a few weeks.
Q
Where does a CMMS fit into an OEE improvement program?
It's the system that keeps stoppage, changeover, and defect data accurate and automated across every shift, which is what makes each phase of the roadmap measurable rather than anecdotal.
Start Your Climb From 60% To World-Class
OxMaint automates availability, performance, and quality tracking so every phase of your OEE roadmap is backed by real data, not guesswork. Sign up for a free trial to start measuring your current baseline, or book a demo to build your improvement roadmap with our team.