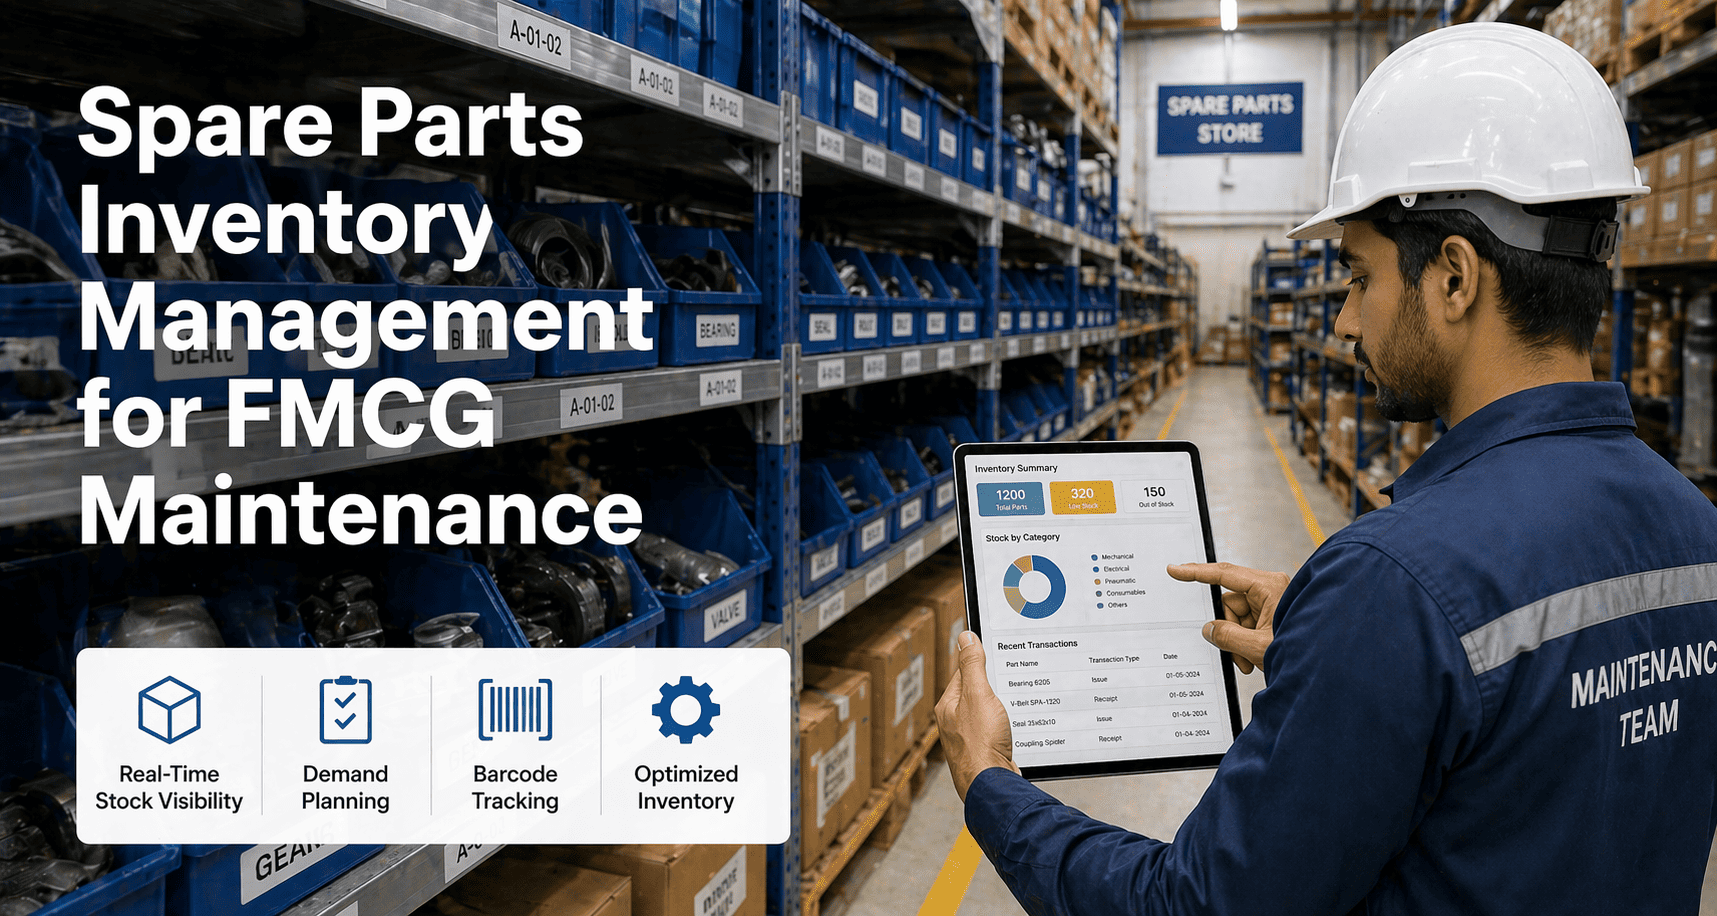
Spare Parts Inventory Management for FMCG Maintenance: Stop the Stockout-Overstock Cycle
By Jonas on March 7, 2026
FMCG plants that rely on reactive spare parts purchasing pay 15–20% more in maintenance costs annually — a preventable penalty driven by stockouts, emergency orders, and bloated MRO inventories sitting idle in storerooms. Every missing bearing that stops a packaging line, every emergency freight charge for an expedited motor, every technician searching 20 minutes for a seal that should be on the shelf — these are not bad luck events. They are data failures. This guide covers the frameworks, strategies, and CMMS capabilities that eliminate the stockout-overstock cycle and replace reactive purchasing with structured, asset-linked inventory intelligence. Start your free trial to build optimised MRO inventory structures from day one, or book a demo to see how Oxmaint connects spare parts data to asset records, work orders, and predictive demand forecasting.
Reactive MRO Management vs. Oxmaint-Optimised Inventory
The operational and financial difference between unstructured parts purchasing and asset-linked CMMS inventory management
Reactive / Unstructured
Parts Availability
Discovered missing at point of failure
Purchase Cost
3–6x emergency premium on every reactive order
Inventory Health
25–35% of stock untouched for 2+ years
Technician Time
17–22% of shift spent searching for parts
Oxmaint Optimised
Parts Availability
Reorder triggers fire before stock runs out
Purchase Cost
Planned rate — zero emergency premium
Inventory Health
Dead stock flagged and actioned quarterly
Technician Time
Parts staged to work order — zero search time
MRO Cost Gap: 15–20% Overspend Eliminated with Structured Inventory Management
What Spare Parts Inventory Management Actually Means for FMCG
Spare parts inventory management is the structured process of identifying, classifying, stocking, and replenishing the components required to maintain production equipment — without overspending on excess stock or risking production stoppages from shortages. For FMCG operations, where throughput margins are tight and line stoppages compound rapidly, the gap between good and poor parts management is measured in production hours lost and emergency budgets burned.
Four Core Concepts That Drive Optimised MRO Inventory
MRO
MRO Inventory Scope
Maintenance, Repair and Operations stock — every consumable, spare part, lubricant, and tool that keeps lines running but does not enter the finished product. The majority of FMCG maintenance spend flows through MRO categories.
BOM
Asset-Linked Bill of Materials
Mapping every spare part to the specific asset and component it services. When a work order is created, required parts are identified automatically — eliminating manual lookups and reducing parts search time by up to 40%.
ROP
Reorder Point Automation
The stock threshold that triggers a purchase order automatically — calculated from supplier lead time, usage rate, and asset criticality. Eliminates manual tracking and prevents the stockouts that cause emergency purchasing premiums.
EOQ
Economic Order Quantity
The optimal order size that balances purchasing costs against holding costs — reducing both emergency premium exposure and warehouse carrying expenses. Calculated per SKU based on consumption rate and lead time variance.
Six Pain Points Destroying FMCG Maintenance Budgets
FMCG plants operate on thin margins and high throughput. Spare parts chaos hits both cost lines simultaneously — inflating purchase costs while reducing available production time. These six failure modes account for the majority of the 15–20% MRO cost premium that reactive-mode facilities pay versus optimised operations.
Six Spare Parts Management Failures — Root Cause and Financial Impact
Stockout at Point of Failure
42% of Downtime
42% of unplanned downtime events are caused by parts unavailability — not equipment failure itself. A missing $40 bearing stops a $2M packaging line. No visibility into stock levels before failure means no ability to prevent the stoppage.
Emergency Purchase Premium
3–6x Cost Multiplier
Reactive parts orders carry 3–6x price premiums plus expedited freight costs. Plants running reactive maintenance spend up to 20% more per part than planned purchasers over a 12-month period — a compounding budget leak invisible until year-end.
Dead Stock Capital Lock-Up
25–35% Untouched Stock
Over-purchasing locks capital in slow-moving parts. Industry average: 25–35% of MRO inventory untouched for two or more years — holding costs and obsolescence risk accumulating with no offsetting value delivered to production lines.
No Asset-to-Parts Linkage
17–22% Shift Wasted
Technicians spend an average of 17–22% of their shift searching for tools and parts. Without BOM-linked work orders staging required components automatically, every job starts with an unproductive storeroom search instead of productive maintenance.
Spreadsheet-Based Tracking
Phantom Inventory
Manual tracking in spreadsheets creates phantom inventory — parts appearing to be in stock that have already been consumed — duplicate orders across sites, and no connection between parts data and the actual asset records determining what is needed.
No Audit Trail for GMP or ISO
Compliance Risk
Food-grade and pharmaceutical FMCG lines need full parts traceability — lot numbers, material classifications, and disposal records. Manual systems fail audits. Consequences extend beyond fines to line shutdowns and supply chain penalties from retail customers.
MRO Inventory — Oxmaint CMMS
Stop Losing $40K Bearings to Stockouts. Start Before the Next Breakdown.
42% of unplanned downtime is caused by parts unavailability — not equipment failure. Oxmaint's asset-linked BOM staging and automated reorder triggers eliminate the stockout before it stops your line.
ABC Analysis: The Foundation of Smart Parts Classification
Not all spare parts deserve equal management attention. ABC analysis stratifies your MRO inventory by criticality and consumption value — ensuring that the 10–15% of parts accounting for 70–80% of your maintenance risk receive the stocking rigour they require, while low-value consumables are managed efficiently without over-engineering the process.
ABC Classification Framework for FMCG MRO Inventory
Criticality tier, SKU percentage, value percentage, and recommended management approach per classification
A — Critical Single point of failure · long lead time · high production impact
Dedicated safety stock with criticality weighting. Weekly review cycle. Supplier SLA with lead time guarantee. Condition-based reorder triggered by PM schedule and asset health data — not just consumption history alone.
10–15% of SKUs 70–80% of MRO Value
B — Moderate Regular usage · predictable consumption · multiple suppliers available
Min-max threshold bands with automated reorder triggers. Monthly review cycle. Standard supplier terms. Consumption-based forecasting with seasonal adjustment for production volume variability across SKU ranges.
20–30% of SKUs 15–25% of MRO Value
C — Consumable Low unit cost · widely available · short supplier lead times
Two-bin visual replenishment system. Periodic bulk ordering to reduce transaction cost. Vendor-managed inventory where supplier volume justifies the arrangement. Minimal CMMS management overhead required per SKU.
55–70% of SKUs 5–10% of MRO Value
The majority of emergency purchasing events originate from A-tier parts managed with C-tier discipline — no dedicated safety stock, no reorder automation, no supplier SLA. ABC classification is the first and highest-impact intervention in any MRO optimisation programme.
Four Strategies to Break the Stockout-Overstock Cycle
Structural MRO cost reduction requires four overlapping strategies applied simultaneously. Each one addresses a distinct failure mode — together they close the gap between the 15–20% cost premium reactive facilities pay and the optimised baseline achievable with structured CMMS inventory management.
Four-Strategy MRO Optimisation Framework
01
Min-Max Inventory Bands
Set min and max stock levels per part based on lead time and consumption rate
Automatic reorder fires when stock hits the minimum threshold
Maximum cap prevents overstock accumulation and carrying cost waste
28% fewer emergency orders within 90 days of deployment
Eliminates: Emergency Purchase Premium
02
Criticality-Weighted Safety Stock
Safety stock weighted by production downtime cost — not unit cost
Lead time variability factored into buffer calculation per supplier
Recalculated automatically as asset condition and PM frequency change
Eliminates: Critical Part Stockout Events
03
Asset-Linked BOM Mapping
Every spare part linked to specific asset and component in the CMMS
Work orders automatically surface required parts at job creation
Parts staged to job before technician arrives at the asset
40% reduction in parts search time from day one of deployment
Eliminates: Technician Parts Search Waste
04
AI-Driven Demand Forecasting
PM schedules and asset runtime hours feed rolling parts demand models
90-day forward consumption forecast per SKU from equipment condition data
Seasonal production volume adjustments applied automatically
30–40% MRO holding cost reduction within 12 months of full deployment
Eliminates: Demand Guesswork and Overstock
How Oxmaint Connects Parts Inventory to Assets, Work Orders, and Forecasting
Oxmaint's inventory management module is not a standalone storeroom tool — it is integrated into the same platform that manages assets, PM schedules, work orders, and condition data. That integration is what enables the transition from reactive purchasing to predictive parts management across every production facility.
Six Oxmaint Inventory Capabilities — Built for FMCG Maintenance Operations
Asset Link
Full BOM Integration Per Asset
Every asset carries a linked parts list. Work orders automatically surface required components — technicians arrive at the job with everything they need, with no manual lookup and no storeroom search time lost before starting.
Auto Reorder
Min-Max Reorder Automation
Set reorder thresholds per SKU. When stock hits the minimum, Oxmaint generates a purchase request automatically — linked to the preferred supplier with pre-populated quantities and delivery requirements.
Forecast
PM-Driven Demand Models
Preventive maintenance schedules feed forward-looking parts consumption projections. Know three months ahead what bearings, seals, and filters each production line will consume — before the need becomes urgent.
Classify
Automated ABC Tier Assignment
Oxmaint classifies inventory by production impact, supplier lead time, and unit cost — applying the correct management rules to each tier automatically without manual configuration or periodic re-sorting exercises.
Compliance
Full Traceability and Audit Logs
Every parts transaction is logged with timestamp, technician ID, asset reference, and work order number. GMP, ISO, and ESG audits pass on first request — no records reconstruction or gap-filling under audit pressure.
Multi-Site
Portfolio-Wide Stock Visibility
Real-time stock levels across every facility in one dashboard. Transfer parts between sites before triggering an external emergency order — reducing inter-site emergency purchases by up to 35% in the first year of operation.
ROI: What Optimised Parts Management Delivers to FMCG Operations
The financial case for CMMS-managed MRO inventory is arithmetic, not theory. The cost premium from reactive purchasing is quantifiable, the reduction from structured management is documented, and the platform investment is recovered from emergency order savings alone — typically within the first quarter of deployment.
65% reduction in emergency purchases × average $3,200 premium per reactive order × 140 orders per year — premium eliminated through min-max automation and supplier reorder triggers
$291,200
Dead Stock Recovery
25% of $1.8M MRO spend identified as dead stock in first inventory audit — liquidated, transferred, or returned to supplier in months 1–3 to recover locked capital
$450,000
Technician Productivity Gains
40% reduction in parts search time × 18 technicians × 420 annual maintenance hours each — converted from search time to wrench time delivering maintenance value
$136,000
Downtime Reduction
42% of unplanned events caused by parts unavailability — eliminating 60% of those events reduces downtime by 25% overall × $22,000 average hourly production loss value
$238,000
Oxmaint Platform Investment
Multi-site CMMS with inventory management, BOM linking, demand forecasting, and compliance audit trail — both production sites included in licence
$95K–$140K/yr
Net Annual Value of Optimised MRO Management
$1.0M+ 7–10x ROI
Dead stock recovery in the first audit typically exceeds the annual platform cost — meaning the programme is self-funding before ongoing savings from emergency order elimination and downtime reduction are counted. ROI compounds as AI forecasting models mature with additional asset history.
Dead Stock Audit — Oxmaint CMMS
25% of Your MRO Inventory Is Sitting Idle. Find It in the First Audit.
The first storeroom audit with Oxmaint typically identifies $400K–$500K in dead stock — capital locked in parts that have not moved in two or more years. Recover it before ordering anything new.
Four-Phase Implementation: From Storeroom Chaos to Optimised MRO
Deploying structured MRO inventory management follows a phased path that delivers measurable financial value at each stage. Start with the 15–20% of parts that cause 60–70% of your emergency purchasing cost. Prove value fast. Expand with the data the platform generates.
Phased MRO Optimisation Roadmap — From Audit to Full Predictive Inventory
01
Month 1–2: Audit and Classify
Full storeroom audit — physical count against CMMS records
ABC classification applied to every SKU in current inventory
Dead stock identified — typically 25–30% of current holdings
BOM mapping begun for A-tier critical production assets
Output: Classified Inventory + Dead Stock Recovery
02
Month 3–4: Link and Automate
Full BOM library built — all assets linked to required parts
Min-max thresholds configured per SKU by criticality tier
Automated reorder triggers connected to preferred suppliers
Two-bin system deployed for C-tier consumable categories
Output: Zero Manual Tracking — Full Reorder Automation
03
Month 5–8: Forecast and Optimise
PM schedule data feeding 90-day demand forecast per SKU
Safety stock levels adjusted based on actual lead time data
First quarterly dead stock review — further inventory right-sizing
Cross-site stock visibility activated for multi-site operations
Output: $200K–$400K Year-One Value Delivered
04
Month 9+: Predict and Scale
AI forecasting models maturing with 6–12 months of history
Predictive maintenance data refining forward demand projections
Full audit trail operational — GMP and ISO compliance assured
Board-level ROI reporting from CMMS data — expansion funded
Output: 30–40% MRO Cost Reduction Sustained
Frequently Asked Questions
Obsolete equipment demands a distinct strategy from active production assets. First, flag the asset in Oxmaint as end-of-life with a projected replacement date and remaining useful life estimate. Second, run a last-time-buy analysis: calculate remaining run hours, estimate component failure probability per PM interval, and purchase a calculated strategic stock — not infinite just-in-case inventory. Third, identify cross-compatible parts from newer equipment specifications where possible to avoid sole-source dependency. Oxmaint's asset condition scoring and remaining useful life tracking provides the data needed to make defensible stocking decisions for legacy equipment and to time capital replacement before parts become completely unavailable from the supply chain.
The standard safety stock formula — Z-score multiplied by standard deviation of lead time demand — provides a statistical foundation but is insufficient for FMCG maintenance without production criticality weighting. A part that stops an entire production line needs 2–3x the safety stock suggested by pure consumption statistics. The four factors that must weight the calculation are: supplier lead time variability (not just average lead time), mean time between failure for the specific component on the specific asset, production line hourly value at standard margin, and substitution availability from alternative suppliers or internal cross-site stock. Oxmaint applies criticality weighting automatically based on the asset's ABC classification — A-tier critical assets carry appropriately weighted buffers without requiring manual recalculation every quarter.
Min-max is reactive — it responds when stock falls below a threshold. AI demand forecasting is proactive — it predicts when parts will be needed based on actual asset runtime hours, PM schedule data, and historical component failure patterns rather than waiting for consumption to trigger an alert. Min-max works well for stable, predictable consumption patterns with consistent production volumes. AI forecasting adds significant value for variable demand scenarios: seasonal production surges where line utilisation jumps 40–60%, ageing equipment with accelerating wear rates, and multi-SKU plants where different product runs use different tooling and consumable sets. The optimal approach combines both: min-max as the safety net, AI forecasting as the strategic layer. Plants using both achieve 30–40% MRO cost reductions versus 15–20% from min-max alone.
Most FMCG plants see measurable, quantifiable ROI within 60–90 days of deploying structured inventory management through a CMMS. The three fastest wins are: emergency order elimination (immediate savings from automated reorder triggers firing before stock depletes), dead stock identification (typically 25–30% of current inventory value flagged and actioned in the first storeroom audit), and parts search time reduction (technician efficiency gains visible within weeks of BOM linking to work orders). Full ROI — including the 30–40% MRO cost reduction from AI demand forecasting — typically materialises within 6–12 months as the system builds sufficient asset and consumption history to optimise its forecasts. Oxmaint users in FMCG operations typically recover the full annual platform investment from emergency order savings alone within the first quarter of operation.
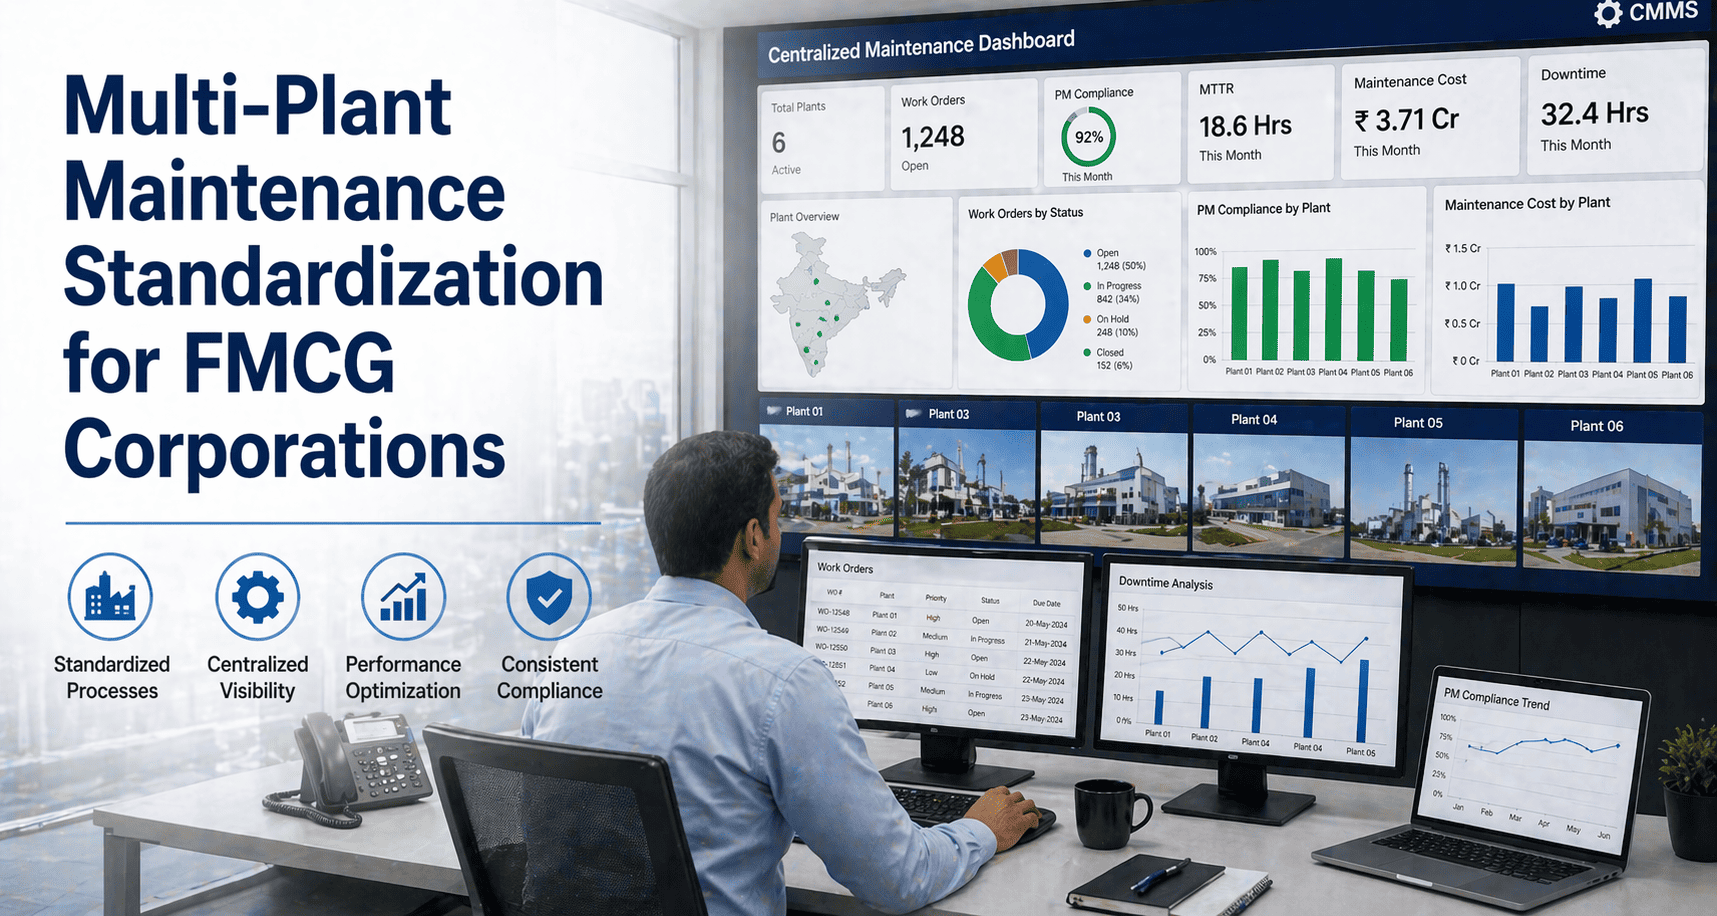
Yes — and for multi-site FMCG manufacturers, cross-site inventory visibility is one of the highest-value capabilities in the platform. Oxmaint provides real-time stock level visibility across all facilities in a single dashboard, enabling maintenance managers to identify when an A-tier critical part is available at a nearby site before triggering an external emergency purchase order. In practice, FMCG manufacturers with two or more production sites using the same or similar equipment families reduce emergency external orders by 35% within the first year through internal stock transfers. The platform also enables portfolio-level purchasing — aggregating demand across sites to qualify for volume pricing with key suppliers rather than each facility purchasing independently at lower volumes and higher unit costs.
MRO Inventory Optimisation for FMCG Maintenance
Stop Paying the Reactive Premium. Your Parts Data Should Work as Hard as Your Team Does.
Every emergency order, every stockout, every hour a technician spends searching for parts is a direct and preventable cost. Oxmaint connects your asset records, PM schedules, work orders, and storeroom inventory into one unified platform — automating reorder triggers, staging parts to work orders before jobs begin, and forecasting demand from actual equipment condition rather than historical guesswork.
Asset-Linked BOM — Parts Staged to Work Orders Automatically
Min-Max Automation — Reorder Triggers Before Stock Depletes
AI Demand Forecasting from PM Schedules and Asset Runtime Data
ABC Classification Applied Automatically — No Manual Tier Management
Full Traceability — GMP, ISO, and ESG Audit-Ready from Day One
Multi-Site Visibility — Cross-Facility Stock Transfer Before Emergency Orders