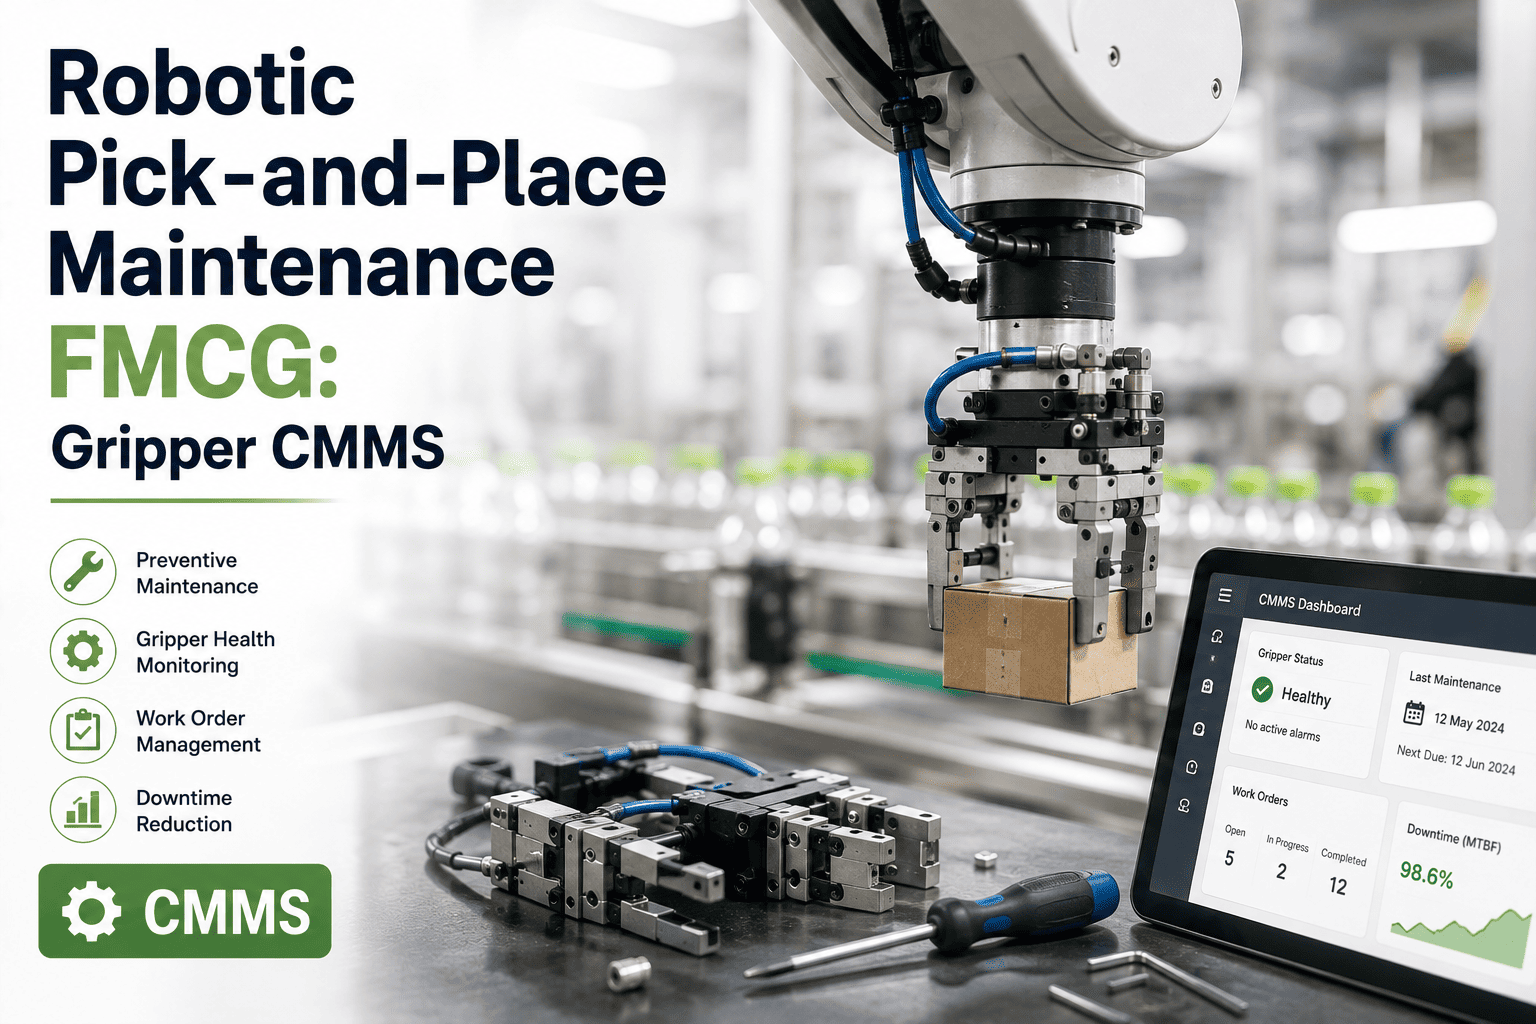
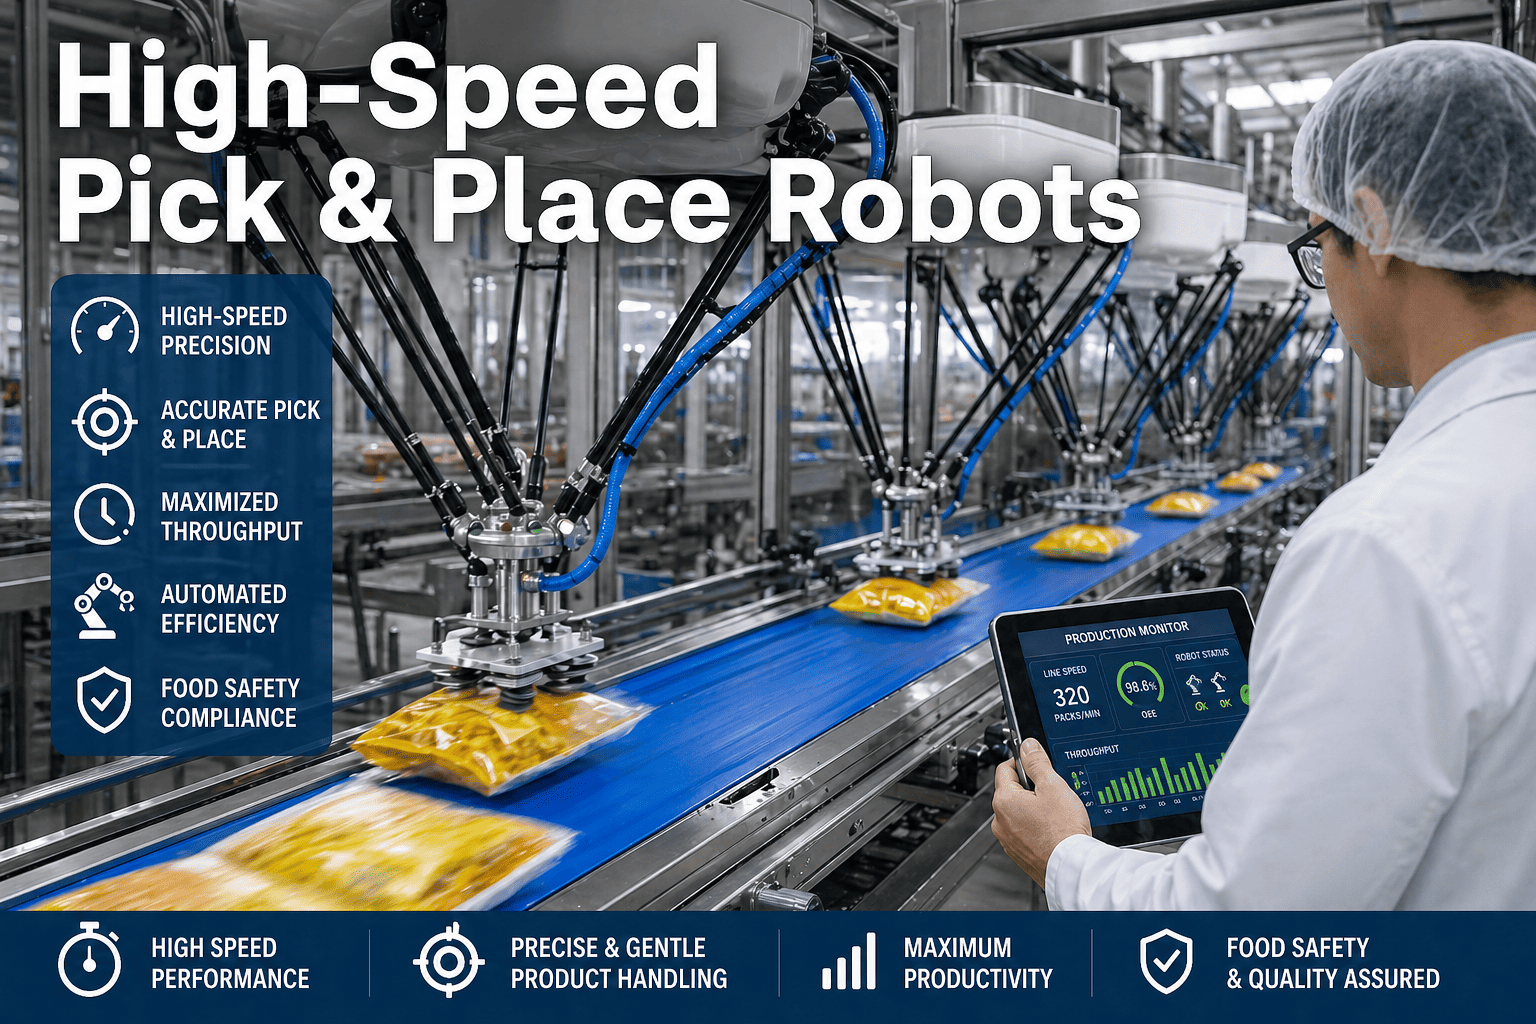
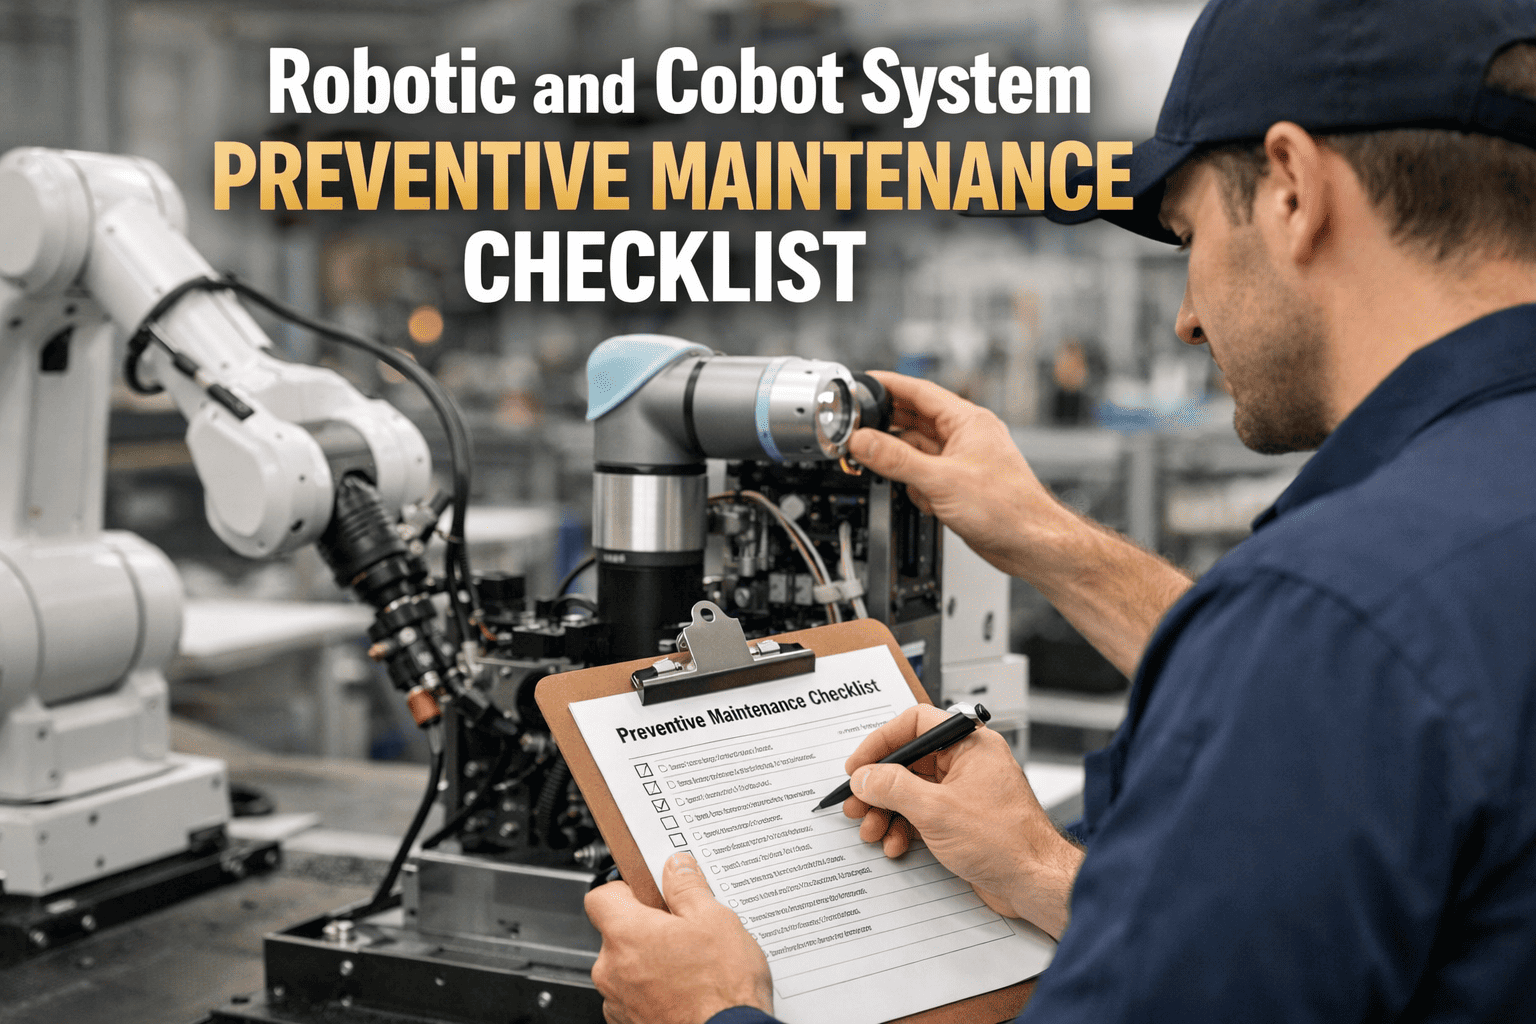
When a pick-and-place robot jams mid-cycle on a high-speed FMCG sorting line, the cascade is immediate: product backs up on the infeed conveyor within seconds, upstream processes halt within minutes, and your warehouse throughput drops by thousands of units per hour until the cell is cleared, diagnosed, and restarted. The difference between a 12-minute recovery and a 90-minute recovery comes down to one thing—how well you maintain these machines before they fail. Pick place robot maintenance in FMCG environments isn't optional; it's the single highest-leverage activity your warehouse team performs. This guide delivers the specific maintenance protocols, spare parts strategies, and workflow insights that keep high-speed sorting and pick-and-place systems running above 95% availability in consumer goods automation environments heading into 2026.
What This Guide Delivers
This is not a generic robotics overview—it's a maintenance-first playbook built for the punishing duty cycles of FMCG warehousing. You'll learn component-level inspection intervals calibrated to actual FMCG cycle rates, robotic gripper maintenance procedures tied to wear patterns rather than calendar dates, CMMS spare parts tracking strategies that prevent stockout-driven downtime, and the operational frameworks that top-quartile consumer goods warehouses use to sustain 96%+ uptime on their pick-and-place fleets.
Why Pick-and-Place Robot Maintenance Is Different in FMCG
FMCG warehouses push pick-and-place robots harder than any other industry. A delta robot in an automotive assembly cell might execute 40 picks per minute with generous cycle margins. The same robot class in an FMCG sorting application runs at 120-200 picks per minute, 20 hours per day, 6-7 days per week, handling products that vary in size, weight, and fragility across dozens of SKU changeovers per shift. This extreme duty cycle compresses component lifecycles, accelerates wear on grippers and vacuum systems, and demands maintenance strategies calibrated to FMCG-specific failure modes—not generic OEM recommendations designed for lighter-duty applications.
Throughput Loss per Hour
A single pick-and-place cell handling 150 picks/minute loses 9,000 unit-movements per hour of downtime—multiplied across downstream packing and palletizing.
Annual Impact: Even 2% unplanned downtime costs 35,000+ lost picks per robot per year
Emergency Repair Premium
Reactive gripper rebuilds and servo replacements cost 3-5x planned maintenance due to overtime labor, expedited shipping, and secondary damage from running degraded.
Annual Impact: $40,000-$75,000 per robot in preventable emergency expenses
Product Damage & Waste
Worn vacuum cups and misaligned grippers don't just slow down—they drop, crush, and misplace product. Quality losses from degraded end-of-arm tooling are invisible until they're catastrophic.
Annual Impact: 0.3-1.2% product damage rate from deferred EOAT maintenance
Cascade Downtime
Pick-and-place cells feed downstream packing, labeling, and palletizing. One robot failure doesn't stop one cell—it starves every process downstream of product flow.
Annual Impact: 3-5x multiplier on actual downtime when cascade effects are measured
FMCG warehouses with structured pick place robot maintenance programs report 95-97% robot availability versus 82-87% for facilities using reactive or calendar-only maintenance. That 10-15 point gap represents hundreds of thousands of additional picks per robot per year. Sign up for OXmaint to start tracking your robot maintenance and close the availability gap.
Component-Level Maintenance: What Fails and When
Effective pick place robot maintenance in FMCG requires understanding which components degrade fastest under high-speed, high-cycle warehouse duty. Generic OEM maintenance intervals assume moderate duty—FMCG operations need accelerated schedules calibrated to actual operating conditions. Here are the critical wear components, their FMCG-specific failure signatures, and the inspection intervals that prevent unplanned stops.
The Three Fastest-Wearing Systems
End-of-Arm Tooling
Components: Vacuum cups, mechanical grippers, suction manifolds, quick-change plates
FMCG Failure Mode: Vacuum cups harden, crack, and lose seal integrity after 500K-1M cycles—causing dropped products, missed picks, and rising reject rates
Maintenance Interval: Daily visual inspection; replacement every 500K-750K cycles or when leak-down rate exceeds 15% of baseline
Timing Belts & Drives
Components: Timing belts, pulleys, tensioners, drive links (delta robots)
FMCG Failure Mode: Belt stretch causes positional drift—robot places product 1-3mm off target, triggering downstream jams and quality rejects before belt actually breaks
Maintenance Interval: Tension check every 1,500 operating hours; replacement every 3,000-4,000 hours in FMCG duty
Servo Motors & Encoders
Components: Servo motors, absolute encoders, drive amplifiers, power cables
FMCG Failure Mode: Rising motor current indicates bearing wear or mechanical binding; encoder drift causes positional errors that compound across millions of cycles
Maintenance Interval: Continuous current monitoring via PLC; bearing replacement at OEM hour threshold or when current exceeds 110% of baseline
Vacuum & Pneumatic Systems
Components:
- Vacuum generators (venturi or pump)
- Air lines, fittings, and manifolds
- Solenoid valves and regulators
- Vacuum sensors and pressure switches
FMCG Failure Signatures:
- Gradual vacuum level decline (contamination in venturi)
- Intermittent drops during high-speed cycles (solenoid fatigue)
- Air leaks at fittings (vibration-induced loosening)
- Sensor false readings (dust contamination on sensor face)
PM Protocol: Weekly vacuum level baseline test; monthly fitting torque check; quarterly solenoid valve rebuild/replacement; daily sensor face cleaning in dusty environments
Vision Systems & Sensors
Components:
- Machine vision cameras and lenses
- Lighting arrays (LED bars, backlights)
- Photoeye triggers and proximity sensors
- Conveyor encoders for tracking
FMCG Failure Signatures:
- Rising miss-pick rate (lens contamination or lighting degradation)
- Inconsistent product detection (photoeye misalignment from vibration)
- Tracking errors on moving conveyor (encoder calibration drift)
- Intermittent vision faults (cable connection fatigue)
PM Protocol: Daily lens cleaning; weekly lighting output measurement; monthly photoeye alignment verification; quarterly encoder calibration against physical measurement
Cable Management & Dress Packs
Components:
- Internal cable bundles (power + signal)
- External cable dress packs and carriers
- Connectors, terminals, and junction boxes
- Cable support systems and strain reliefs
FMCG Failure Signatures:
- Intermittent robot faults (cable fatigue causing signal interruption)
- Unpredictable stops that clear on restart (connector micro-fractures)
- Visible cable wear, chafing, or exposed conductors
- Unusual sounds during high-speed motion (cable catching)
PM Protocol: Monthly visual inspection under motion; cable replacement at OEM cycle count (typically 5-10M cycles); connector re-seat quarterly; cable carrier rail lubrication per OEM spec
Safety Systems & Guarding
Components:
- Light curtains and safety scanners
- Safety-rated door interlocks
- E-stop circuits and safety relays
- Safety PLC monitoring functions
FMCG Failure Signatures:
- Nuisance safety trips (dirty light curtain lenses)
- Door interlock failures forcing line stop until verified
- E-stop circuit degradation (contact oxidation)
- Safety relay failure requiring full shutdown per ISO 10218
PM Protocol: Daily light curtain lens cleaning; monthly functional test of all safety devices; quarterly interlock mechanism inspection; annual safety system validation per ANSI/RIA 15.06
Consumer Goods Automation 2026 Trend
Leading FMCG warehouses are shifting from calendar-based to cycle-count-based maintenance intervals for pick-and-place robots. A robot running 150 picks/minute for 20 hours/day accumulates 180,000 cycles per day—reaching a 500,000-cycle vacuum cup replacement threshold in under 3 days, not the 30-day calendar interval many facilities still use. Schedule a demo to see how OXmaint tracks cycle-count-based PM triggers that match actual equipment wear rather than arbitrary calendar dates.
Robotic Gripper Maintenance: The #1 Uptime Driver
Robotic gripper maintenance is the single most impactful maintenance activity for FMCG pick-and-place operations. End-of-arm tooling interfaces directly with product—every degradation in gripper performance immediately translates to throughput loss, quality defects, or both. Yet gripper maintenance is the most frequently deferred activity in warehouse robotics because "it's still working" right up until it catastrophically isn't.
The Gripper Degradation Timeline: From Subtle to Catastrophic
The Optimal Maintenance Intervention Point
Replace vacuum cups at 500K cycles—before performance degradation becomes visible. This planned 8-minute cup swap during a scheduled break prevents the 45-90 minute emergency stop that occurs at 750K+ cycles. The math is unambiguous: 8 minutes of planned maintenance prevents 45-90 minutes of unplanned downtime plus product damage, jam clearance, and restart time.
Key Metric: Track vacuum leak-down rate weekly. When it exceeds 15% above baseline, replace cups regardless of cycle count—environmental factors (dust, moisture, product residue) can accelerate degradation below the 500K threshold.
See How Leading FMCG Warehouses Manage Gripper Maintenance
OXmaint connects cycle-count triggers to automated maintenance tasks—so your team replaces vacuum cups at 500K cycles, not when they catastrophically fail at 750K+. See the complete gripper maintenance workflow in a live demo.
CMMS Spare Parts Tracking: Preventing Stockout Downtime
The fastest maintenance team in the world can't fix a robot if the replacement part isn't on the shelf. CMMS spare parts tracking is the invisible infrastructure that determines whether a gripper rebuild takes 12 minutes (part in stock, procedure documented) or 6 hours (emergency order, overnight shipping, technician improvising). For pick-and-place robots in FMCG warehouses, spare parts strategy directly determines whether you hit your availability targets or spend your budget on expedited freight.
Critical Spares (Must Stock On-Site)
Components that cause immediate cell stoppage when they fail and cannot be field-repaired. Stock minimum 2x quantity needed for a single robot, plus 1x per additional robot of same type.
Items: Vacuum cup sets, timing belts, servo motor assemblies, cable dress packs, solenoid valve kits, vision camera modules, safety relay modules
Consumable Spares (Replenishment Stock)
Components consumed at predictable rates based on cycle counts or operating hours. Track usage rate and set automatic reorder points to prevent stockouts.
Items: Vacuum cups (individual), air fittings, filter elements, lubricants, cable ties and strain reliefs, photoeye lenses, cleaning supplies
Insurance Spares (Low Probability, High Impact)
Expensive components with long lead times that rarely fail but cause extended downtime when they do. Cost of carrying inventory is far less than cost of 2-4 week wait for replacement.
Items: Controller boards, teach pendants, power supply modules, complete EOAT assemblies, specialty sensors, safety PLC modules
Vendor-Managed Inventory (Consignment)
Negotiate consignment arrangements with robot OEMs and gripper manufacturers for high-value components. You don't pay until you use it, but it's on your shelf when you need it.
Strategy: Consignment works best for servo motors ($2K-$8K each), controller components, and specialty EOAT assemblies with 4-8 week lead times
FMCG warehouses tracking spare parts through CMMS software report 78% faster mean-time-to-repair versus facilities using manual inventory methods. The difference: knowing exactly where the part is, whether it fits this robot model, and when to reorder—before you need it at 2 AM on a Saturday. Sign up for OXmaint to automate your spare parts tracking and eliminate stockout-driven downtime.
High-Speed Sorting Robot Service: The Layered PM Approach
High-speed sorting robot service in FMCG requires a layered maintenance approach—daily operator checks, weekly technician inspections, monthly deep maintenance, and quarterly overhauls. Each layer catches different failure modes at different stages of development. Missing any layer creates gaps where failures develop undetected until they cause production stops.
Daily: Operator-Level Checks (5-8 minutes per robot)
Performed by line operators at shift start. No tools required. Catches obvious degradation before it causes failure during production.
- Visual inspection of vacuum cups for cracks, tears, deformation
- Listen for unusual sounds during first 2-3 minutes of operation
- Verify pick success rate on HMI dashboard (flag if below 99%)
- Check for product debris accumulation on EOAT and vision cameras
- Clean vision camera lenses and photoeye sensors
- Verify safety light curtain indicator lights (green = operational)
- Report any changes in robot speed, sound, or behavior via mobile app
Weekly: Technician Inspection (30-45 minutes per robot)
Performed by maintenance technician during scheduled break or shift change. Basic tools required. Catches developing issues before they reach failure threshold.
- Vacuum leak-down test: measure and record against baseline
- Timing belt tension measurement with tension gauge
- Air fitting torque check on all pneumatic connections
- Vision system calibration verification (run test pattern)
- Servo motor current draw reading (compare to baseline trend)
- Cable dress pack visual inspection during robot motion
- Safety device functional spot-check (1-2 devices per week, rotating)
- Update maintenance records with all readings and observations
Digital PM workflows auto-populate baseline values and flag readings that exceed thresholds—technicians know immediately when a measurement indicates developing problems instead of reviewing spreadsheets after the shift
Monthly: Deep Maintenance (2-3 hours per robot)
Performed by senior technician during scheduled maintenance window. Full toolset and spare parts access required. Addresses wear items approaching cycle-count thresholds.
- Replace vacuum cups if cycle count exceeds 500K since last replacement
- Full pneumatic system leak test (pressurize and soap-test all joints)
- Timing belt replacement if tension check shows >5% stretch from new
- Complete safety system functional test (all devices, all functions)
- Vision system full calibration with dimensional verification
- Servo motor temperature scan with thermal camera
- Controller backup (program, parameters, configuration)
- Lubrication service per OEM specification
- Conveyor tracking encoder calibration verification
Quarterly: Comprehensive Overhaul (4-6 hours per robot)
Performed by robotics specialist or OEM technician. Major wear items replaced proactively. System-level performance verification ensures robot operates at rated capacity.
- Complete EOAT rebuild (all cups, manifolds, quick-change mechanism)
- Cable dress pack inspection and replacement if approaching cycle limit
- Servo motor bearing assessment (vibration analysis or current signature)
- Controller firmware update to latest stable version
- Full kinematic calibration (verify all axis positions against master)
- Solenoid valve replacement (rebuild kits on all pneumatic valves)
- Safety system annual validation (if aligns with quarterly schedule)
- Performance benchmark: verify robot achieves rated cycle time and accuracy
- Review RCA findings from previous quarter; implement pending corrective actions
Scheduling Strategy: Stagger quarterly overhauls across your robot fleet so only 1-2 robots are down simultaneously. Never schedule all overhauls in the same week—capacity loss will be unacceptable.
Warehouse Automation Uptime: Measuring What Matters
You can't improve what you don't measure. Warehouse automation uptime requires tracking specific KPIs that reveal the health of your pick-and-place fleet—not vanity metrics that make reports look good but don't drive maintenance decisions. Here are the metrics that matter and the targets that separate leaders from laggards in consumer goods automation.
Robot Availability Rate
Percentage of scheduled production time the robot is available and operational. Includes all downtime: planned PM, unplanned failures, changeovers, and waiting-for-parts time.
Target: 95-97% for top-quartile FMCG operations
Calculation: (Scheduled Time – All Downtime) / Scheduled Time × 100
Mean Time Between Failures (MTBF)
Average operating time between unplanned stops. Rising MTBF means your PM program is working; falling MTBF signals emerging issues or deferred maintenance catching up.
Target: 400+ operating hours between unplanned failures
Alert Threshold: Investigate any robot with MTBF below 200 hours
Mean Time to Repair (MTTR)
Average time from failure detection to full production restart. MTTR is determined by spare parts availability, technician skill, and diagnostic tool access—all manageable factors.
Target: Under 25 minutes for routine failures
Key Driver: Spare parts on-shelf + documented repair procedures = fast MTTR
Pick Success Rate
Percentage of pick attempts that successfully grip and place product. Declining pick success rate is the earliest indicator of EOAT degradation—visible before dropped products cause jams.
Target: 99.5%+ sustained across all operating shifts
Alert Threshold: Investigate when rate drops below 99.0% on any robot
Data-Driven Maintenance Decision Making
Track these metrics per robot, per shift, and per product type. A robot showing 99.8% pick success on rigid cartons but 97.2% on flexible pouches doesn't have a robot problem—it has a gripper-to-product match problem that requires EOAT adjustment, not component replacement. Context-specific data prevents wasted maintenance effort and focuses your team on interventions that actually improve throughput. OXmaint dashboards display these metrics in real time with automatic threshold alerts that trigger maintenance actions before performance degrades further.
Root Cause Analysis: Stopping Recurring Robot Failures
When the same pick-and-place robot fails repeatedly—or when the same failure type appears across multiple robots—it's a signal that you're treating symptoms instead of root causes. The 5-Why method adapted for FMCG robotics reveals the systemic issues hiding behind individual failures and turns recurring expenses into one-time process fixes.
Real Example: Recurring Vacuum Failures Across Multiple Robots
Corrective Actions Implemented:
- Immediate: Replaced all air filters and cleaned all venturi generators across the fleet
- Short-term: Reduced filter replacement interval from 90 to 30 days for current product mix
- Long-term: Created "operating condition change review" process—any new product line, new operating schedule, or environmental change triggers a PM interval reassessment across all affected equipment
- Monitoring: Added differential pressure gauges on air filter housings to provide visual indication of filter loading between PM intervals
Result: Zero vacuum-related failures in the 12 months following implementation. The process change also caught two other PM intervals that needed adjustment for the new operating conditions—preventing additional failure modes before they manifested.
Stop Fixing the Same Failures Repeatedly
OXmaint captures failure patterns across your entire robot fleet, identifies recurring issues automatically, and links root cause findings to updated maintenance procedures so the same problem never costs you twice. See how it works in your environment.
Consumer Goods Automation 2026: Maintenance Trends Reshaping FMCG Warehouses
The best pick-and-place robot maintenance strategies for 2026 reflect broader consumer goods automation trends that are changing how warehouses approach equipment reliability. Understanding these trends helps maintenance leaders invest in capabilities that deliver results today while building readiness for tomorrow's operating requirements.
Cycle-Count-Based PM Replaces Calendar Intervals
Leading warehouses are abandoning fixed calendar intervals in favor of cycle-count triggers that reflect actual equipment wear. A robot running 180,000 cycles per day needs vacuum cups every 3 days—not every 30. CMMS platforms that track cycle counts from PLC data are enabling this shift at scale.
Predictive Analytics Identify Failures 2-6 Weeks Out
Machine learning models trained on servo motor current signatures, vibration patterns, and pick success rate trends predict component failures weeks before they occur—shifting maintenance from scheduled replacement to condition-based intervention that maximizes component life without risking unplanned stops.
Digital Twin Simulation Optimizes PM Scheduling
Virtual replicas of production lines model how different PM scheduling strategies affect cumulative throughput—identifying the optimal balance between maintenance frequency and production availability. Digital twins reveal that the lowest-cost PM schedule isn't always the highest-throughput schedule.
Hygienic Robot Design Reduces Cleaning Downtime
New-generation IP69K-rated robots with stainless steel surfaces and sealed joints eliminate protective enclosures, reduce cleaning time by 40%, and allow robots to operate closer to open food products without contamination risk—changing the maintenance equation for food and beverage FMCG applications.
Edge Computing Enables Real-Time Performance Monitoring
Processing pick success rates and cycle time data at the edge delivers sub-second latency for real-time dashboards, immediate fault detection, and faster automated responses. Edge architecture also ensures monitoring continues during network outages, protecting data integrity during critical production shifts.
Operator-Led Daily Inspections Expand Maintenance Capacity
Training line operators to perform 5-8 minute daily robot inspections effectively multiplies maintenance capacity without headcount. When operators feel ownership of equipment health, early detection of developing issues improves dramatically—catching problems at the "unusual sound" stage rather than the "cell stopped" stage.
Building a Maintenance Culture That Sustains Results
Technology and procedures are necessary but not sufficient. The warehouses that achieve 96%+ robot availability share a common trait: they've built a culture where maintenance is valued as a throughput strategy, not tolerated as a production interruption. Here's what separates facilities that sustain world-class availability from those that spike and regress.
Celebrate Prevented Failures, Not Just Fast Fixes
Every vacuum cup replaced at 500K cycles instead of 750K is a prevented production stop worth $2,000-$8,000 in avoided downtime, product waste, and cascade effects. Track and communicate cost avoidance from planned maintenance—make the invisible value visible to leadership and to the technicians who created it.
Share Performance Data Transparently
Post weekly MTBF, availability, and pick success rate data where everyone can see it—operators, technicians, supervisors, and warehouse leadership. When the team sees how their maintenance efforts connect to production numbers, engagement increases. When they see a robot's MTBF climbing month over month because of their work, pride follows.
Make Root Cause Analysis a Routine, Not a Project
Investigate every unplanned stop over 15 minutes. When investigation is routine rather than exceptional, root causes surface faster, corrective actions stick, and the same failures don't keep consuming your team's time and your operation's capacity. The 30 minutes spent investigating a failure prevents the 30 hours spent re-fixing it over the next year.
Invest in Technician Development Continuously
Send technicians to robot OEM training annually. Certified technicians diagnose 3x faster, repair correctly the first time (eliminating comeback work orders), and identify improvement opportunities that untrained staff miss entirely. The $3,000-$5,000 annual training investment per technician pays back in a single prevented major failure.
Measure PM Quality, Not Just PM Completion
Completing 100% of PM work orders means nothing if technicians are rushing through inspections without recording measurements, taking photos, or escalating out-of-spec findings. Audit PM quality monthly: are baseline readings recorded? Are trends being identified? Are threshold exceedances generating follow-up actions? Quality of maintenance execution determines quality of reliability outcomes.
Ready to Transform Your Pick-and-Place Robot Reliability?
The FMCG warehouses achieving 96%+ robot availability aren't using magic—they're using structured maintenance programs, cycle-count-based PM triggers, automated spare parts tracking, and root cause analysis that prevents recurring failures. OXmaint provides the platform that connects all of these elements into a single workflow your team can execute consistently, shift after shift.
See OXmaint applied to your specific robot fleet in a 30-minute personalized walkthrough.
Prefer to explore on your own first? Sign up for a free account and start building your maintenance program today.
Frequently Asked Questions
How often should vacuum cups be replaced on FMCG pick-and-place robots?
In high-speed FMCG applications running 120-200 picks per minute, vacuum cups should be replaced every 500,000-750,000 cycles—which translates to every 2-5 days of continuous operation, not the 30-90 day calendar intervals many facilities still use. The optimal strategy is to track cycle counts through your maintenance platform and set automatic replacement triggers at 500K cycles. Additionally, perform weekly vacuum leak-down tests and replace cups immediately when leak-down exceeds 15% above baseline, regardless of cycle count. Environmental factors like product dust, moisture, and temperature can accelerate degradation below the cycle-count threshold.
What spare parts should we stock on-site for pick-and-place robots?
Stock three tiers: Critical spares (vacuum cup sets, timing belts, servo motors, cable dress packs, solenoid valve kits, vision cameras, safety relays)—these cause immediate cell stoppage and must be on-shelf. Consumable spares (individual vacuum cups, air fittings, filter elements, lubricants, photoeye lenses)—set automatic reorder points based on usage rates. Insurance spares (controller boards, teach pendants, power supplies, complete EOAT assemblies)—expensive but essential for components with 4-8 week lead times. Consider consignment arrangements with OEMs for high-value items so parts are on your shelf without capital commitment until used. OXmaint's CMMS spare parts tracking automates reorder points across all three tiers.
What robot availability rate should FMCG warehouses target?
Top-quartile FMCG operations sustain 95-97% robot availability. Average operations run 82-87%. The gap is almost entirely attributable to maintenance practices: structured PM programs with cycle-count-based intervals, spare parts on-shelf, technician training, and root cause analysis for recurring failures. Start by measuring your current availability accurately (include all downtime sources), then target 2-3 percentage point improvement per quarter. Most facilities can reach 93-95% within 12 months of implementing structured maintenance programs with digital tracking.
How does CMMS software improve pick-and-place robot maintenance?
CMMS transforms robot maintenance from memory-dependent and inconsistent to systematic and auditable. Specific benefits for FMCG robotics: cycle-count-based PM triggers that match actual wear instead of calendar guesses; digital inspection workflows with baseline values and threshold alerts ensuring consistent quality across all technicians and shifts; spare parts tracking with automatic reorder points preventing stockout downtime; failure trending that identifies patterns requiring root cause analysis before they become chronic; and complete maintenance history linked to each robot enabling faster diagnosis when failures occur.
What's the difference between maintaining pick-and-place robots in FMCG versus other industries?
FMCG duty cycles are 3-5x more demanding than most industrial applications. Key differences: cycle rates of 120-200+ picks/minute versus 30-60 in typical manufacturing; operating hours of 18-22 hours/day, 6-7 days/week versus single-shift operations; product variability requiring multiple changeovers per shift versus fixed-product runs; environmental factors including food dust, moisture, and temperature extremes in cold-chain facilities; and zero-tolerance for contamination in food and personal care applications. All of these factors compress component lifecycles and require maintenance intervals 2-4x more frequent than standard OEM recommendations designed for moderate-duty applications.
How do we justify the cost of preventive maintenance when robots are "running fine"?
Track and present the total cost of reactive maintenance: emergency repair labor (overtime rates), expedited parts shipping, secondary damage from running degraded components, product waste from drops and misplacement, cascade downtime affecting downstream processes, and the hidden cost of throughput loss during each unplanned stop. In most FMCG operations, reactive maintenance costs 3-5x more than equivalent planned work. A vacuum cup set costs $45 and takes 8 minutes to replace proactively. The same failure addressed reactively costs $45 in parts plus $200+ in overtime labor, $300+ in lost throughput, and $100+ in product waste and jam clearance—a 15:1 cost ratio that makes the business case unambiguous. Request a demo to see how OXmaint quantifies cost avoidance from your preventive maintenance program.