Robotic End-of-Line Inspection: How to Reduce FMCG Recalls with Automated Quality Gates

By Jacob Gogins on March 14, 2026

robotic-end-of-line-inspection-reduce-fmcg-recalls

Every FMCG product that leaves your plant with a defect — a mislabeled allergen, a faulty seal, a wrong SKU in the case, a damaged package — passed through every quality checkpoint you built and still escaped. The industry calls it "defect escape rate," and the average FMCG plant runs at 2–5% escape on manual end-of-line inspection. On a line producing 40,000 units per shift, that means 800–2,000 defective units ship to retailers every single day. One of those defects will eventually trigger a recall costing $10M–$30M, a retailer chargeback costing $50K–$200K, or a consumer complaint that goes viral. Robotic end-of-line inspection eliminates this gap — combining AI vision with automated reject systems to inspect every unit at full production speed, catching 99.5%+ of defects before they reach the loading dock. This guide shows how robotic EOL inspection works, what it catches, and how to deploy it on existing FMCG packaging lines in under 8 weeks. Start your free trial to integrate robotic inspection data with your CMMS. Book a demo to see OxMaint's AI Vision Inspection Integration on a live FMCG line.

AI Vision Inspection Integration
Your Last Line of Defense Before the Loading Dock
OxMaint connects robotic EOL inspection data to maintenance workflows — every defect pattern triggers root cause analysis, equipment health alerts, and corrective work orders automatically.
99.5%+
defect detection at full line speed — vs 60–80% for manual EOL inspection

2–5%
defect escape rate with human inspection — 800–2,000 bad units shipped per shift

<8 Weeks
from camera placement to full automated inspection on existing lines

What Robotic End-of-Line Inspection Actually Does

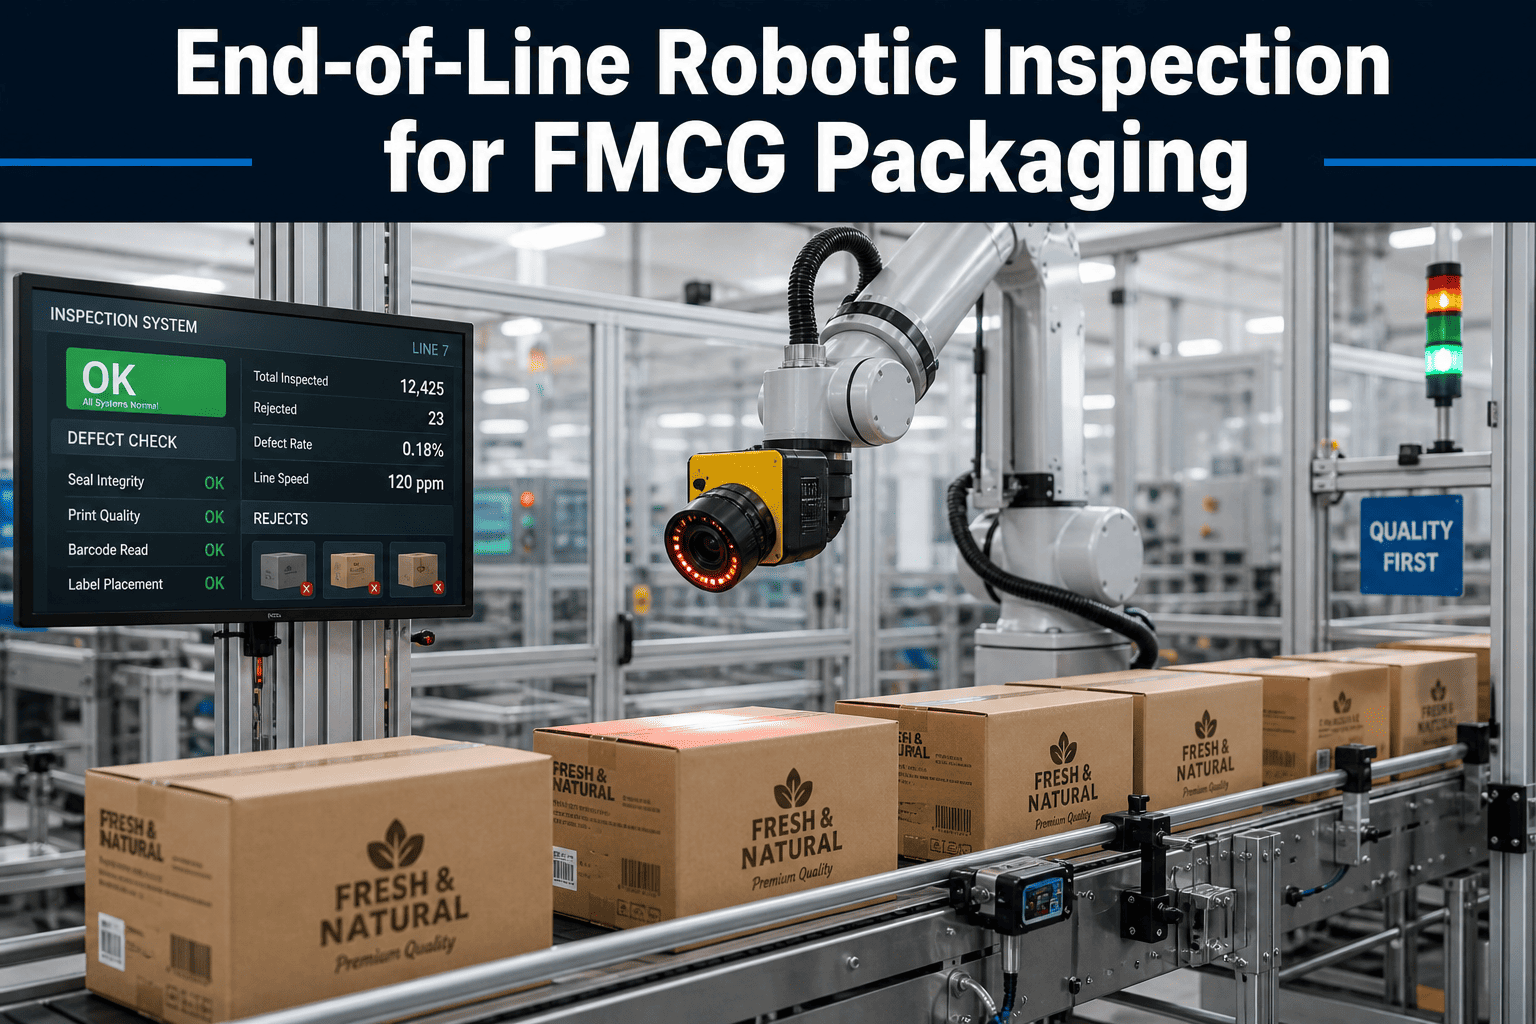
A robotic EOL inspection station is the final quality gate before product enters the shipping area. It combines three technologies into a single automated checkpoint that inspects every unit — not samples, not spot-checks, every single unit — at full production speed without slowing the line.

A
AI Vision Cameras
3–5 cameras per station covering top, sides, and bottom of each case or unit. Multi-angle inspection catches defects invisible from a single viewpoint. Typical configurations include RGB for label and print quality, infrared for seal integrity, and X-ray for contents verification.
+
B
Edge AI Processing
GPU-accelerated inference running 7+ detection algorithms simultaneously per unit in under 15ms. Processes 1,200+ units per minute without queuing. Models trained on your specific products, packaging, and known defect types.
+
C
Robotic Reject & Divert
Pneumatic pushers, robotic arms, or air-blast diverters that physically remove defective units from the line in under 50ms. Rejected units are segregated, imaged, and logged with full traceability for root cause analysis.

The critical difference between robotic EOL and traditional quality gates is 100% inspection coverage. Manual inspection checks 1 in 50–100 units on a good day. Automated SPC samples 1 in 500. Robotic EOL inspects every single unit — meaning the probability of a defective unit reaching a customer drops from 2–5% to under 0.05%. That 100x improvement in escape rate is what makes the difference between "occasional customer complaints" and "zero recalls."

The Seven Defect Types EOL Inspection Catches

Each defect type requires specific imaging technology and AI models. A properly configured EOL station runs all seven detection algorithms on every unit simultaneously — nothing is traded off because the AI has no attention limit.

Defect Type
Detection Method
Catch Rate
Wrong SKU / mislabel
OCR reads every barcode, allergen panel, and expiry date against master database
99.9%
Seal integrity failure
Infrared imaging measures seal width to ±0.3mm across full perimeter
99.7%
Foreign object in package
X-ray detects metal, glass, stone, bone down to 0.5mm inside sealed packaging
99.5%
Fill level deviation
X-ray volumetric measurement through opaque packaging — catches density variations
99.3%
Package damage
RGB cameras detect dents, crushes, tears, and deformation from all angles
99.6%
Print quality failure
Spectrophotometric analysis verifies color Delta-E <2.0 and registration ±0.5mm
99.4%
Missing components
X-ray confirms inserts, scoops, desiccants, promo items are present in every unit
99.8%

The combined effect of running all seven algorithms on every unit produces a composite defect escape rate below 0.05% — meaning fewer than 1 in 2,000 defective units passes the EOL gate. Compare that to manual inspection's 2–5% escape rate (1 in 20–50 defective units passing) and the quality improvement is not incremental — it is transformational.

Manual vs. Robotic EOL: The Full Comparison

The performance gap between manual and robotic end-of-line inspection is not marginal on any metric. Here is how they compare across the dimensions that matter for FMCG quality, cost, and compliance.

Manual EOL Inspection


Catch rate: 60–80%
Coverage: 1–2% sampled
Night shift: 38–50%
800–2,000
defective units shipped per shift
VS
Robotic EOL Inspection


Catch rate: 99.5%+
Coverage: 100% inspected
Night shift: 99.5%+
<20
defective units shipped per shift

The night shift comparison is the most revealing metric. Manual inspection drops to 38–50% effectiveness on night shifts due to fatigue, reduced supervision, and higher absenteeism — precisely when FMCG plants produce 30–40% of total output. Robotic inspection maintains 99.5%+ at 3 AM exactly as it does at 10 AM. For plants running 24/7, this single factor can justify the entire investment.

24/7 Quality Assurance
Same Detection Rate at 3 AM as 10 AM — Every Shift, Every Day
OxMaint tracks robotic inspection system health, camera calibration, and reject mechanism performance alongside all your production equipment — ensuring the quality gate never degrades.

From Defect Detection to Equipment Intelligence

The most valuable capability of robotic EOL inspection is not catching defects — it is preventing them. When the AI analyzes defect patterns over time, it identifies equipment degradation trends that predict future failures weeks before they produce recall-worthy escapes. Every defect image is a diagnostic signal about upstream equipment health.

Seal width drifting
Seal jaw temperature dropping — heating element degradation
Replace seal jaw — 4 hr lead time
Label position shifting
Labeler registration sensor drifting — calibration needed
Recalibrate labeler — 15 min task
Fill level inconsistency
Filler nozzle #4 partially blocked — flow restriction
Clean nozzle set — next changeover
Print color deviation
Ink viscosity changing — temperature or batch variation
Adjust ink system — real-time correction

This is why robotic EOL inspection data should feed directly into your CMMS — not just your quality management system. When OxMaint receives a spike in seal-width rejects, it does not just flag a quality event. It correlates with the seal jaw's temperature profile, cycle count, and maintenance history, then auto-generates a predictive work order: "Replace seal jaw on Wrapper Line 2 — projected failure in 6 hours based on defect trend." The quality system catches the symptom. The CMMS fixes the cause.

The Economics: What Robotic EOL Saves

FMCG quality managers often compare the cost of robotic inspection against the cost of manual inspectors. The correct comparison is against the total cost of quality failures — recalls, chargebacks, complaints, waste, and the brand damage that no insurance policy covers.

Recall risk reduction

$7.5M/yr
Retailer chargeback avoidance

$185K/yr
Waste/scrap reduction

$290K/yr
Inspector labor reallocation

$196K/yr
Complaint handling reduction

$120K/yr
Robotic EOL system (5 lines, installed)$220,000
Year 1 value delivered$8.3M+
38x ROI — Operational Savings Alone Pay Back in Under 4 Months

Even excluding recall risk and counting only the certain operational savings (chargebacks + waste + labor + complaints = $791K/yr), the system pays for itself in 3.3 months. The recall prevention value is the strategic justification — but the operational savings are what make the investment decision easy because they are measurable from week one.

Maintaining the Quality Gate: Robotic EOL PM Requirements

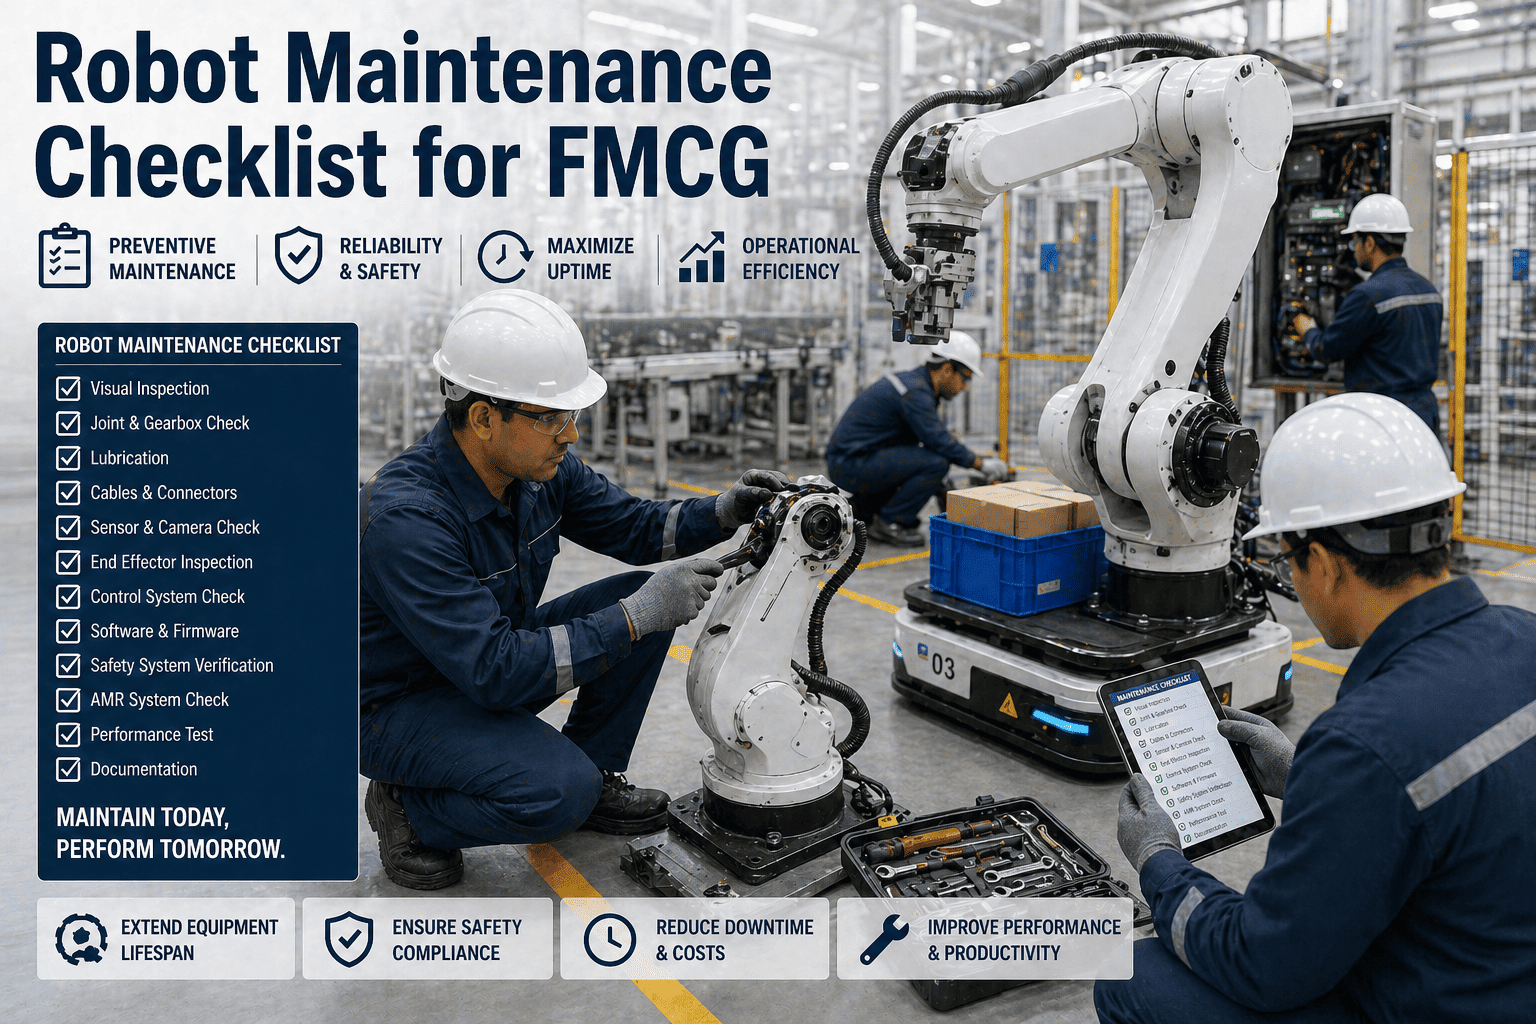
Robotic inspection stations are highly reliable but not maintenance-free. Keeping the quality gate at peak performance requires specific PM tasks integrated into your CMMS alongside all other production equipment.

Component
PM Task
Frequency
Camera Lenses
Clean with lint-free wipes, check for scratches or contamination buildup
Daily
LED Lighting Arrays
Verify lux output with meter, clean diffusers, check for flicker or hot spots
Weekly
Calibration Targets
Run certified test targets through system, verify detection rates meet spec
Weekly
Reject Mechanism
Test pneumatic pushers/air blasts with known-defective samples, verify response time
Daily
Edge Processing Unit
Check GPU temperature, fan operation, processing latency, storage capacity
Monthly
AI Model Performance
Review false positive/negative rates, retrain on new defect types, update firmware
Quarterly

Total annual PM investment per EOL station: approximately 80 hours — delivering 99.5%+ inspection accuracy on 8,760 hours of production. That is a 109:1 ratio of inspected production hours to PM hours. Compare that to manual inspection, where you invest 4,160 labor hours per year (2 inspectors x 2,080 hrs) for 60–80% accuracy that degrades with every passing hour of the shift.
Implementation: 8 Weeks to Automated Quality Gate

Week 1–2
Line Assessment & System Design
Audit current defect escape data, identify highest-risk line, design camera positions and imaging technology per defect type. Select reject mechanism based on product and line speed. No production disruption.
Week 3–4
Hardware Installation & AI Training
Mount cameras, lighting, processing unit, and reject mechanism during a planned changeover. Train AI models on your SKUs — 500–2,000 images per product. System runs in shadow mode alongside existing inspection.
Week 5–6
Shadow Validation & CMMS Integration
Compare robotic vs manual catch rates — typical result: robotic catches 25–40% more defects. Connect defect data feed to OxMaint for equipment health correlation and automated work order triggers.
Week 7–8
Go Live & Continuous Improvement
Activate automated reject. Train operators on override procedures and quarantine protocols. AI accuracy improves continuously from 99.0% to 99.5%+ as models learn your specific failure modes.

Frequently Asked Questions

Yes — AI models are stored per SKU in a recipe database. At changeover, the system loads the new SKU recipe in under 30 seconds — compared to 15–30 minutes to retrain human inspectors on a new product. Most FMCG plants run 10–50 SKUs through the same EOL station without hardware changes. Only the AI recipe switches. Sign up free to see how OxMaint manages multi-SKU inspection recipes.
Well-designed systems include dual cameras per station with automatic failover. If the entire station fails, product diverts to a quarantine lane for manual inspection until the system is restored. Most failures resolve in under 15 minutes via hot-swap camera or processing unit replacement. System uptime averages 99.5%+ with proper PM.
Initial false positive rates run 1–3% during the first week. Within 2–4 weeks they drop below 0.5% as models learn your packaging materials and conditions. Rejected units are segregated and reviewed — good product is returned to the line, true defects are scrapped with full traceability. Net waste reduction is 40–60% compared to manual inspection because robotic systems catch defects in units, not pallets.
No — it replaces the repetitive visual inspection task and redeploys inspectors to higher-value quality engineering roles: root cause analysis, CAPA management, supplier quality, and process improvement. Plants deploying robotic EOL report zero involuntary headcount reductions. Inspectors are redeployed, retrained, and retained. Book a demo to see how plants manage the transition.
At three levels: real-time reject signals go to the line PLC for immediate diversion, defect data feeds into the CMMS (like OxMaint) for maintenance correlation and predictive work orders, and summary reports feed into QMS platforms (SAP QM, TrackWise, MasterControl) via APIs. Every defect image and timestamp is stored for regulatory traceability and audit readiness.
AI Vision Inspection Integration
Every Unit Inspected. Every Defect Caught. Every Root Cause Traced.
99.5%+
defect detection

38x
return on investment

8 Weeks
to full deployment
Trusted by FMCG quality and maintenance teams across food, beverage, and personal care manufacturing. No credit card required.

Share This Story, Choose Your Platform!