The plant runs three shifts across 340,000 square feet on the outskirts of Indianapolis, freezing roughly 84,000 pounds of breaded protein, vegetable mixes, and ready-meal components per shift. In the eighteen months before they replaced their paper-and-spreadsheet maintenance system with OxMaint, they logged 1,847 hours of unplanned downtime — 71% of it concentrated on six pieces of equipment that nobody had a structured PM history for. Eighteen months after going live, the same plant logged 887 hours of unplanned downtime against the same baseline output. A 52% reduction, no equipment replaced, no team headcount added, no new capital project. What changed was that every refrigeration compressor, blast freezer, conveyor drive, and packaging line was tracked as an individual asset with its own failure history, sensor telemetry feeding work orders, and PM intervals built around production cycles instead of the calendar. This case study walks through what they did, in the order they did it, and what the numbers looked like at month 6, month 12, and month 18. To explore the same platform on your assets, start a free trial — or if you want a guided walkthrough on your own equipment list, book a demo.
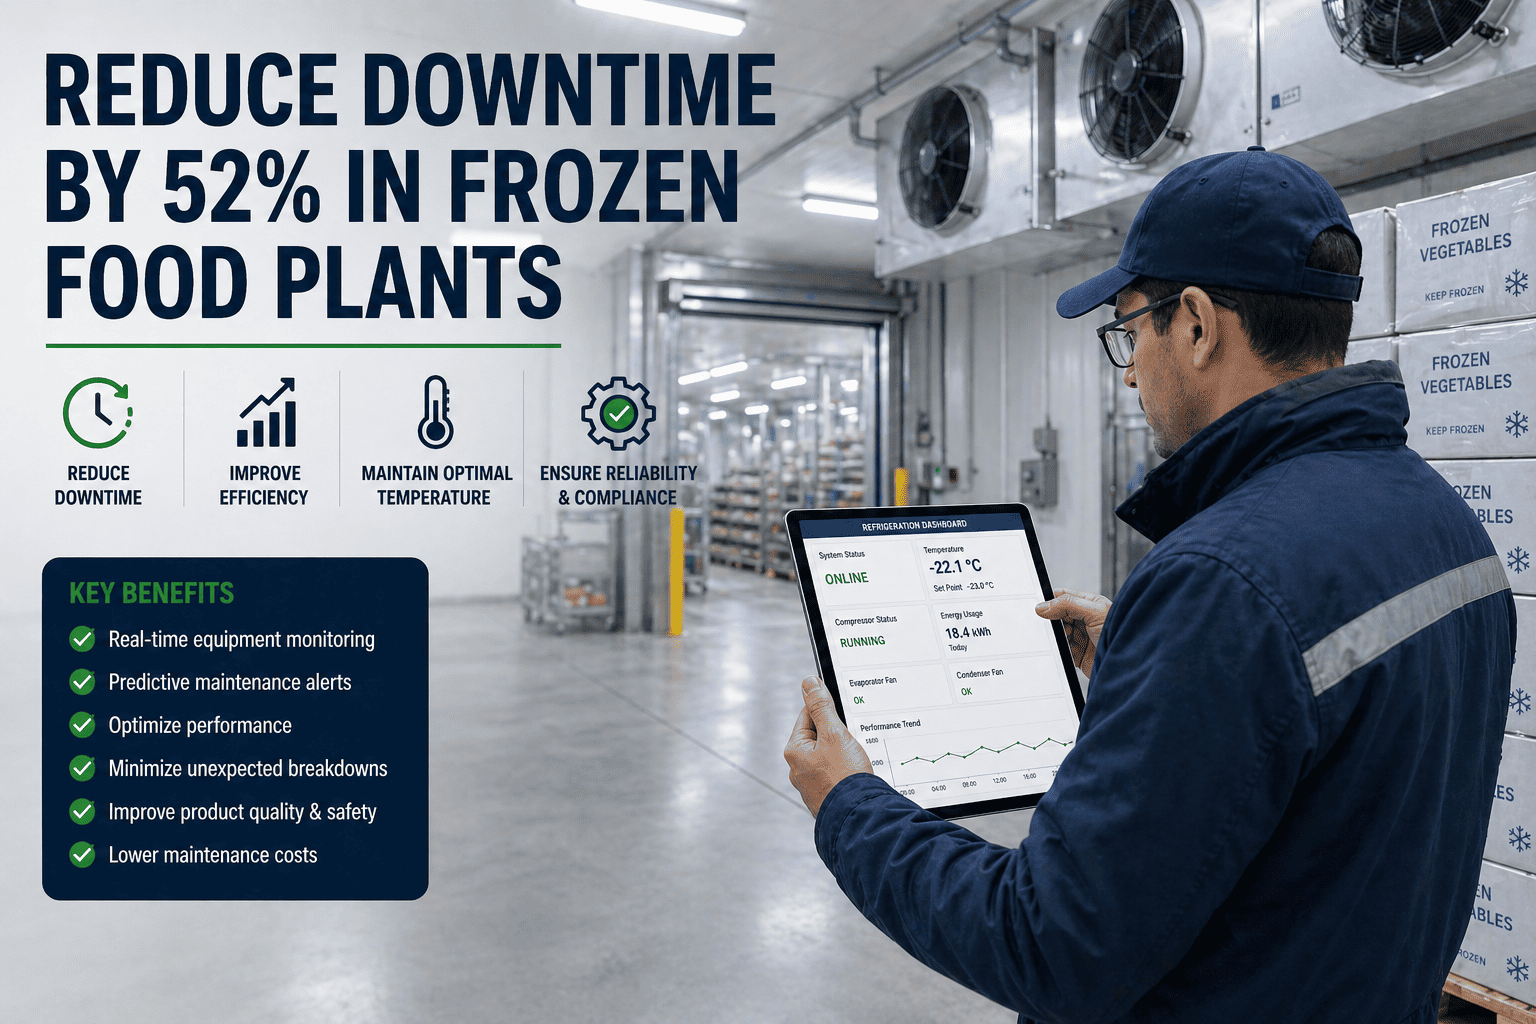
How a Frozen Food Plant Cut Unplanned Downtime by 52% in 18 Months
Refrigeration monitoring, blast-freezer PM automation, and asset-level reliability tracking — replacing reactive maintenance with structured preventive scheduling on equipment that runs 24/7 below freezing.
The Plant at a Glance
Six Pain Points That Defined the Pre-Implementation Baseline
Before the rollout, the plant's reliability team had a gut sense of where downtime was concentrated — but no asset-level data to confirm it. The first month of the implementation was almost entirely diagnostic: pulling thirty months of work-order paper into a structured asset register and surfacing what was actually happening underneath the noise.
The four primary ammonia compressors had no condition-based monitoring. Vibration trends, oil quality, and discharge temperature were checked manually once per week — too infrequent to catch the bearing wear signature that preceded two emergency shutdowns in 2024.
Blast freezer evaporator defrost cycles were calendar-based, regardless of actual ice load. Excess defrosting wasted energy on healthy units and under-defrosted heavily-loaded units, leading to airflow restriction and product temperature excursions twice per quarter on average.
Twelve conveyor systems shared a single PM template. Drives carrying frozen product through metal detection were accumulating bearing damage 3x faster than ambient-temperature drives — but were maintained on the same schedule. Three drive failures in 2024 each cost 8-14 hours of recovery.
Heat-sealing assemblies on three IQF packaging lines were replaced reactively when leaks appeared in finished bags. By that point, the previous shift's output was already in cold storage with potential seal compromise. There was no PM trigger tied to seal cycle count.
The two spiral freezers ran 22 hours per day with belt tension and tracking inspected weekly. Belt edge damage from build-up developed faster than the inspection interval — one belt repair cost 19 hours of production stop while it was tracked, retracked, and restarted.
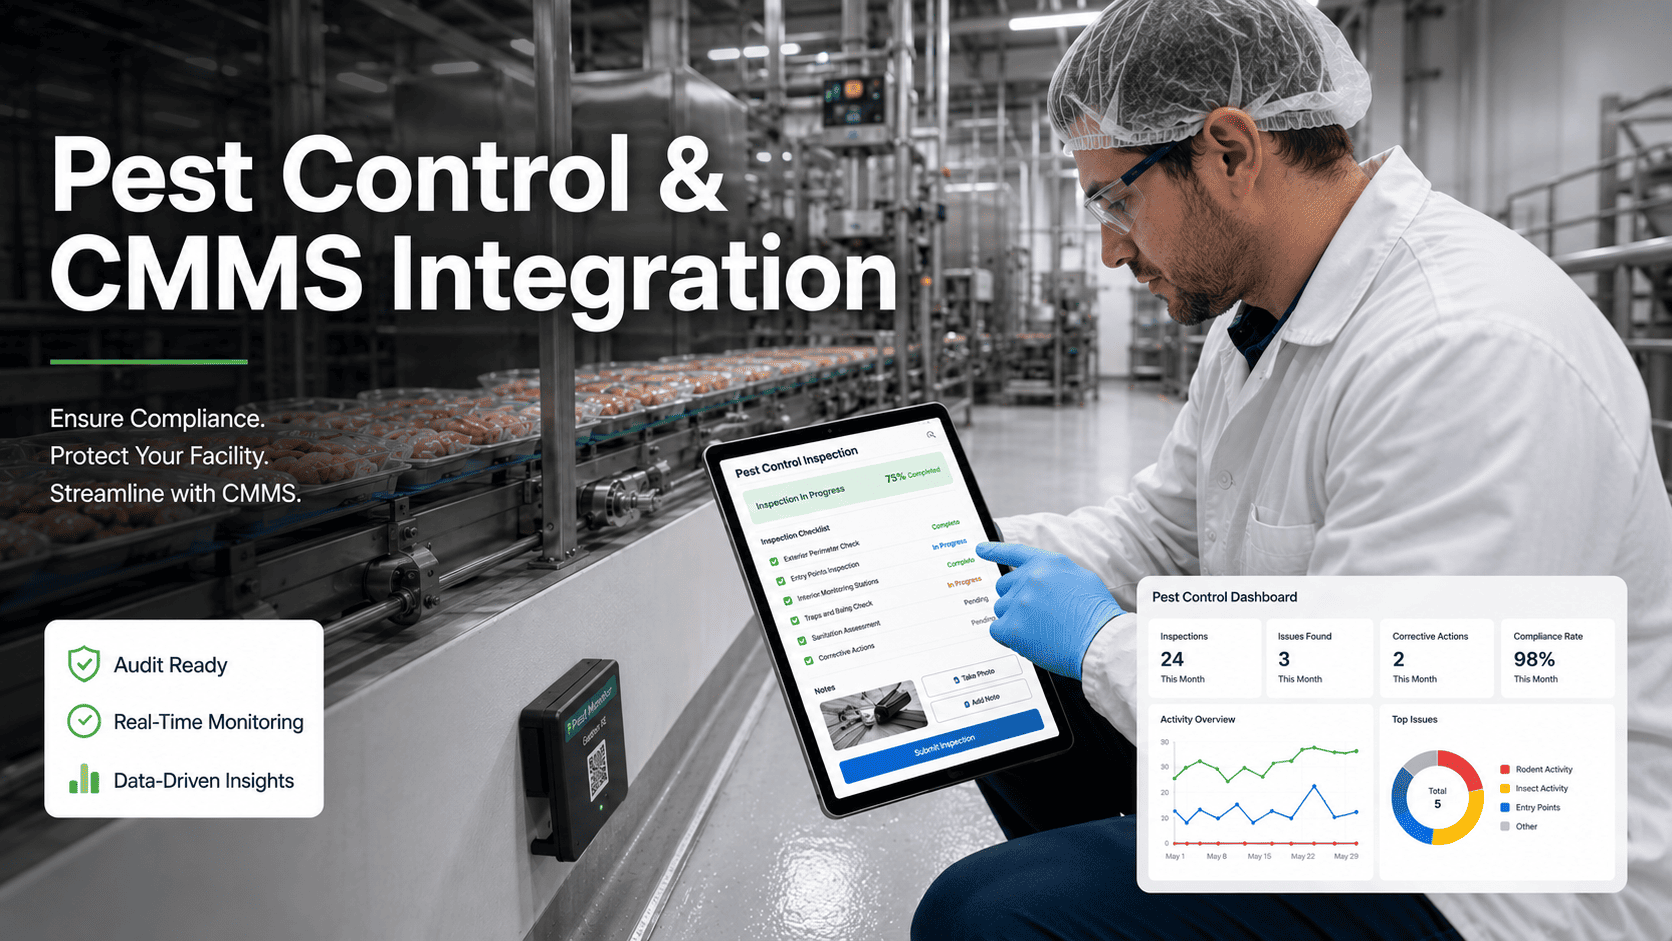
SQF and customer audits required a maintenance team scramble two weeks before each visit. Records lived across paper logs, individual technician notebooks, and one Excel master that nobody trusted. Two of the three 2024 audit findings were documentation-related, not operational.
The 18-Month Implementation Path
No big-bang go-live. Three phases over 18 months, each with a measurable target and a stop-and-validate gate before the next phase started.
Same Platform, Same Approach — On Your Refrigeration, Conveyors, and Packaging Lines
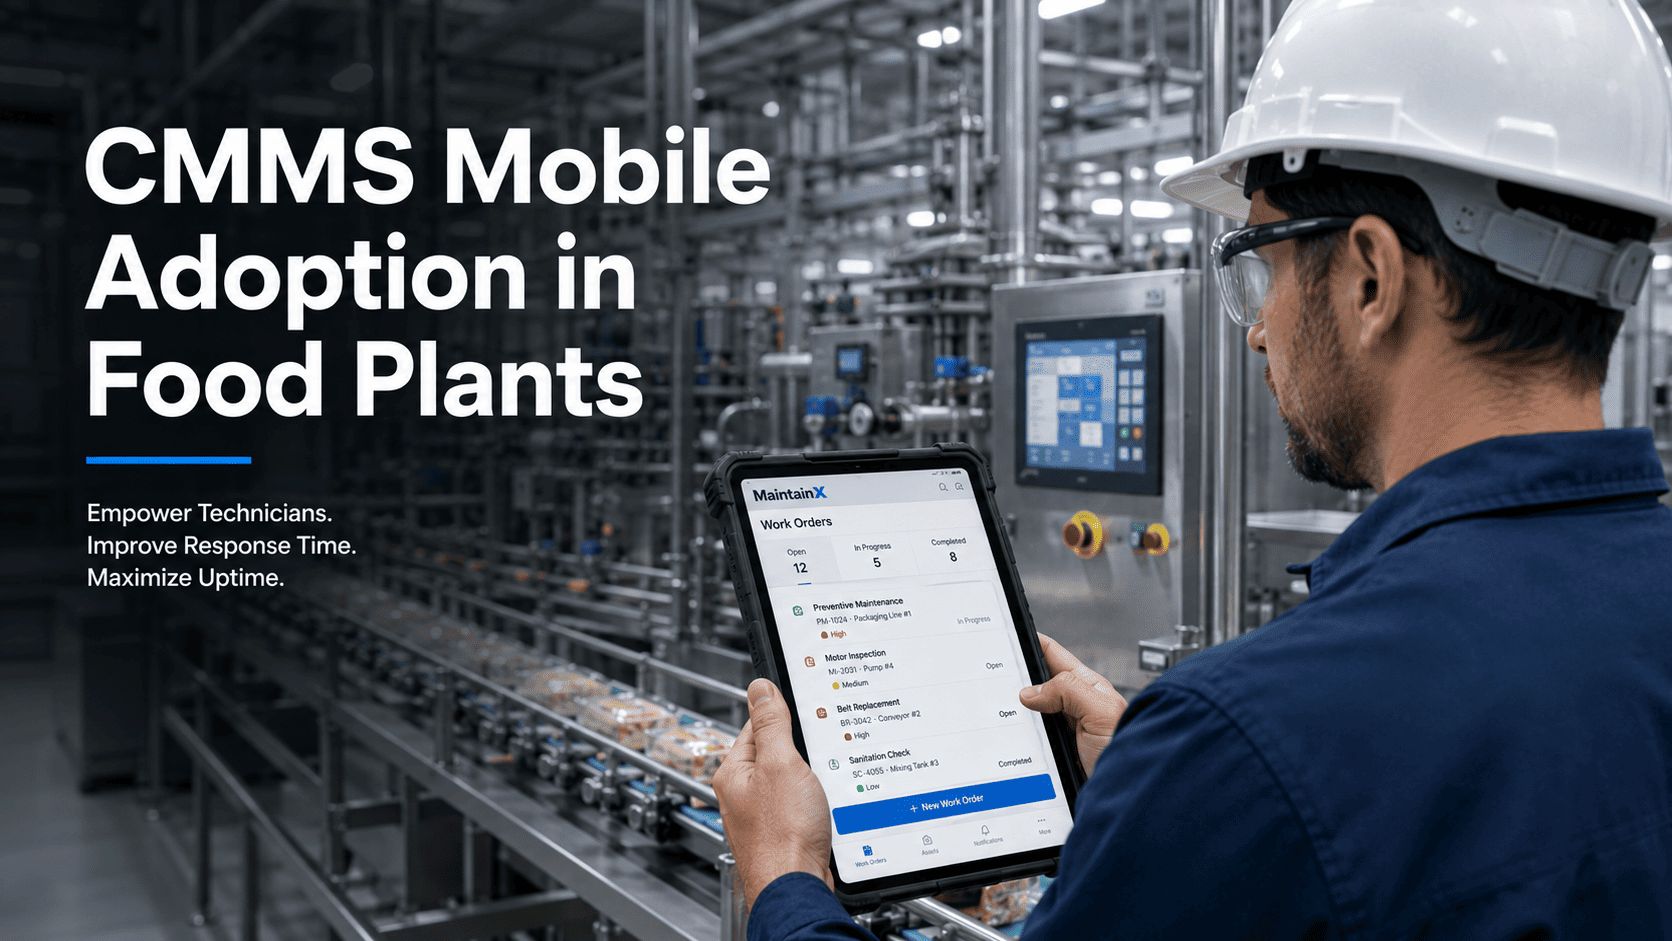
OxMaint replaces reactive paper logs with asset-level reliability tracking, production-triggered PMs, and condition-based work orders fed by your existing SCADA — no new sensors required to start. Walk through your own equipment list with one of our engineers.
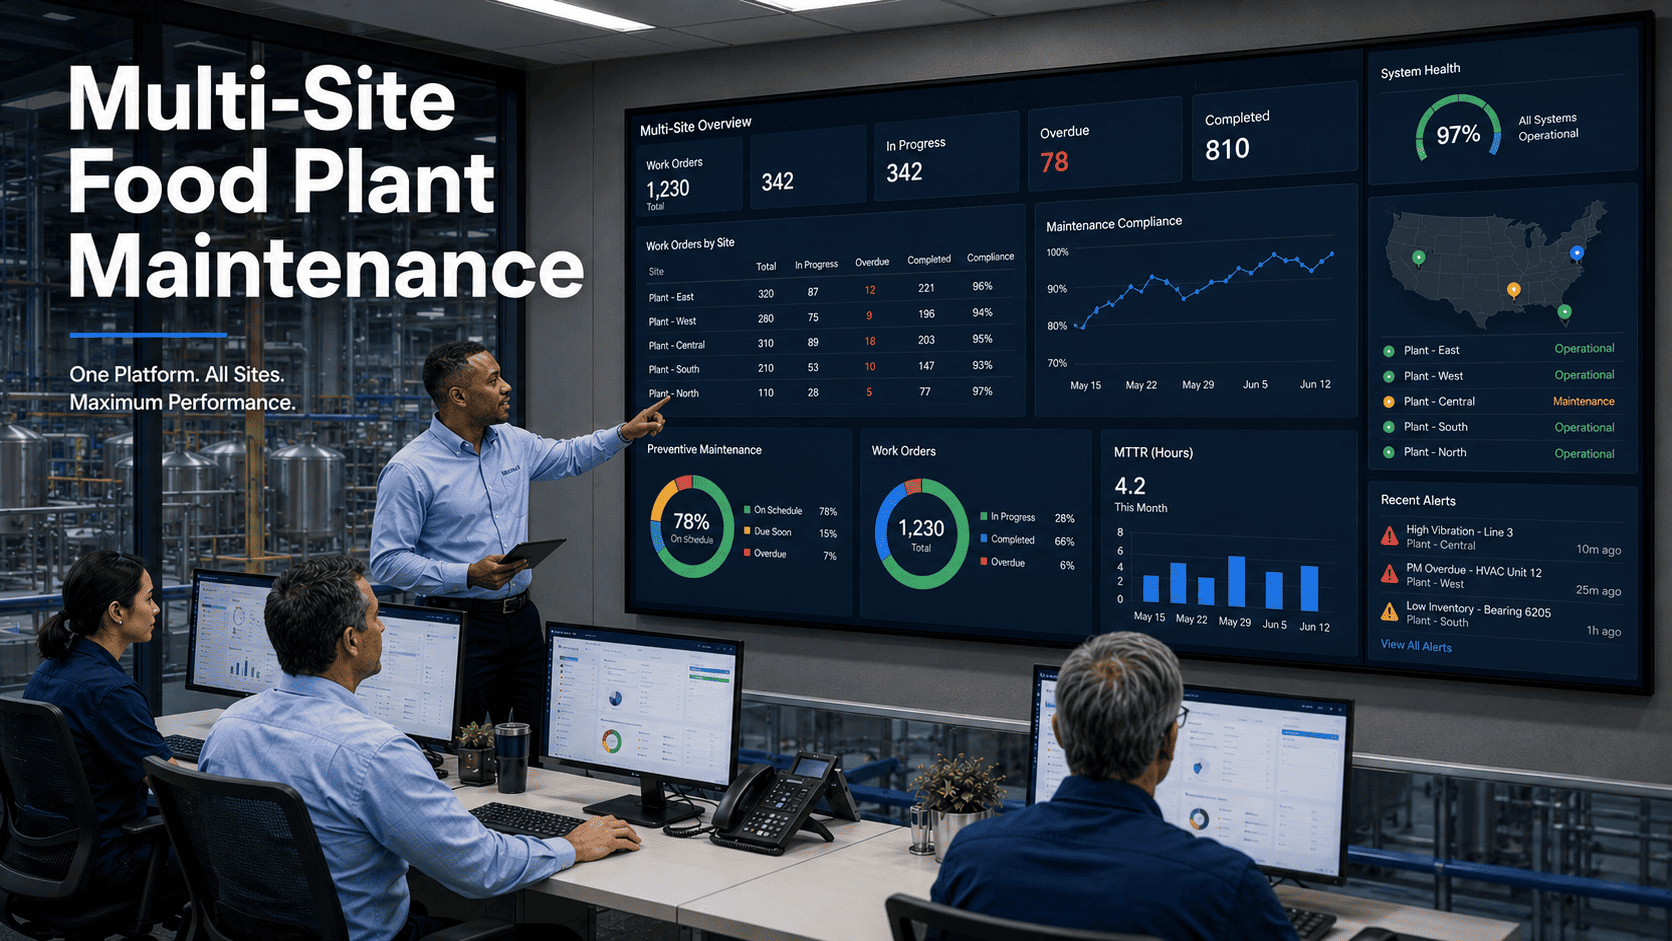
Equipment-Level Outcomes — Where the 52% Came From
The headline 52% number is the average across the plant. Underneath it, the gains were not evenly distributed — refrigeration and conveyor systems contributed disproportionately, while filling and labelling lines saw modest but real improvements.
Vibration trending caught two pending bearing failures. Suction pressure drift logged 14 days before manual inspection would have caught it.
Demand-defrost cycles based on coil pressure differential ended both excess defrosting and under-defrosting. Energy use also dropped 11%.
Cold-zone drives moved to 2x maintenance frequency vs ambient drives. Vibration sensors on 14 critical drives flagged early bearing wear.
Belt tension and tracking inspections moved to per-shift verification with mobile work orders. Edge damage flagged before belt repair was needed.
Sealing-head PMs tied to cycle count rather than calendar. Seal-leak rate dropped from 0.42% to 0.09% in the same period.
Door cycle counters tied to gasket replacement and motor PM. Air infiltration losses dropped notably at the freezer-receiving interface.
Before & After — The Numbers Side by Side
| Metric | Pre-OxMaint Baseline | Month 18 Result | Change |
|---|---|---|---|
| Annual unplanned downtime | 1,847 hrs | 887 hrs | -52% |
| Mean time between failure | 142 hrs | 441 hrs | +210% |
| PM compliance rate | 67% | 94% | +27 pts |
| Reactive vs planned work mix | 71% / 29% | 34% / 66% | Inverted |
| Avg. work order completion time | 4.2 days | 1.6 days | -62% |
| Audit documentation prep time | 14 days | 2 days | -86% |
| Spare parts emergency orders | 43 / yr | 11 / yr | -74% |
| Refrigeration energy use (kWh/lb) | 0.32 | 0.28 | -12% |
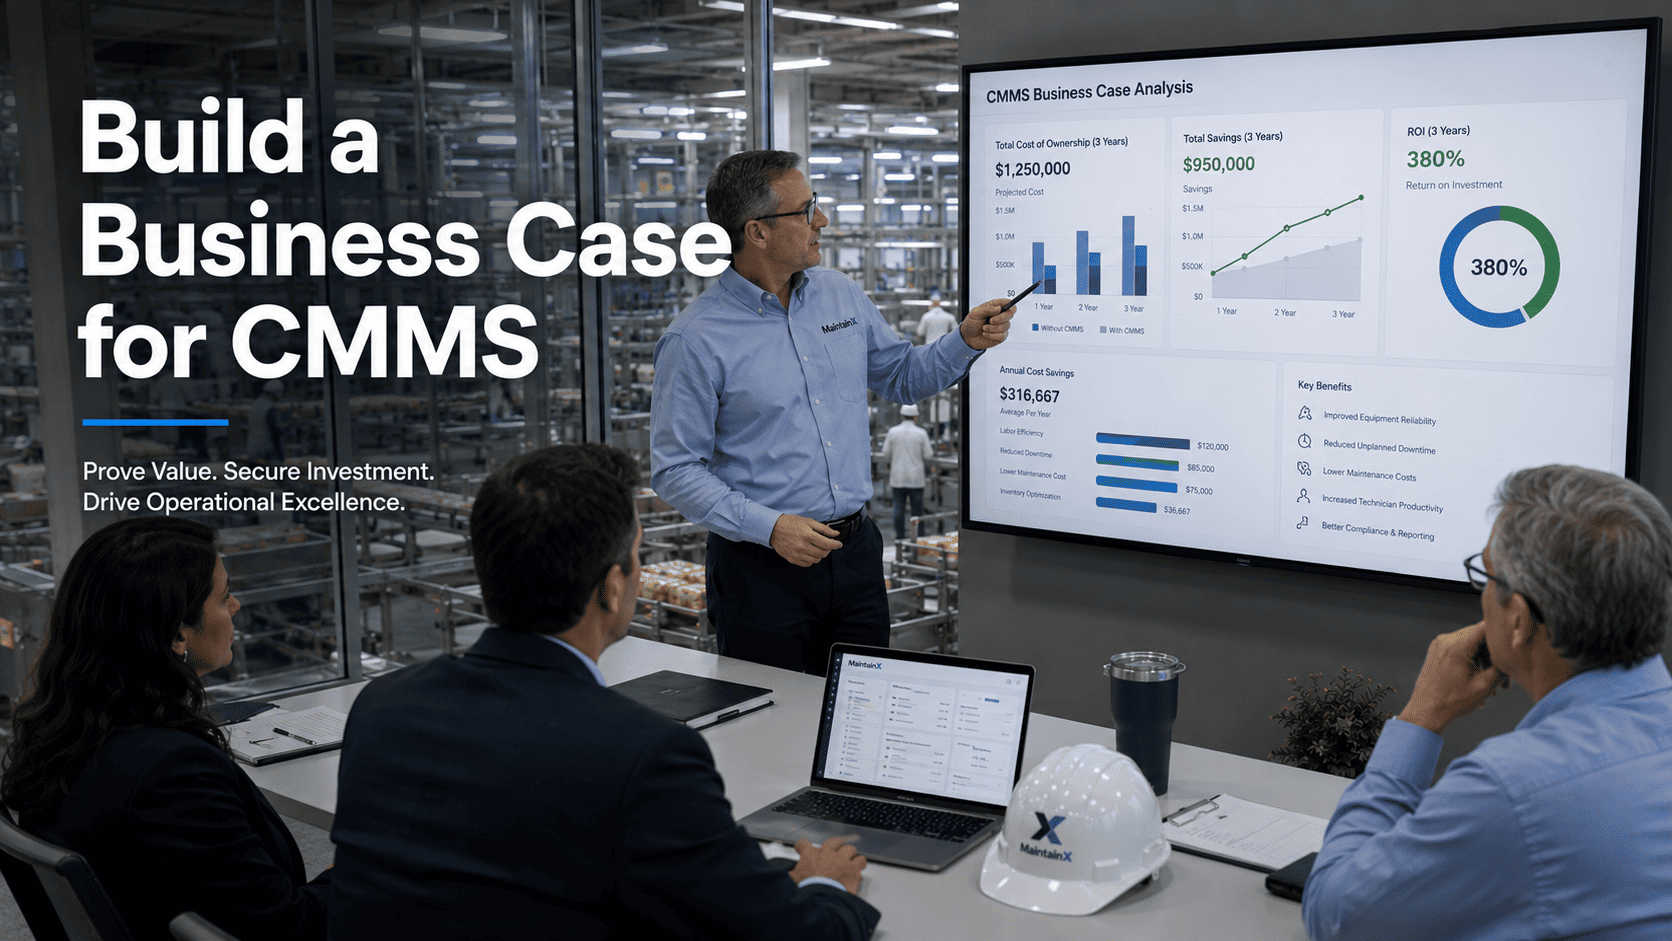
Year-One ROI Breakdown
Frequently Asked Questions
Your Refrigeration, Conveyors, and Packaging Lines Have a 52% Number Too
OxMaint registers every asset, replaces calendar-only PMs with production-triggered scheduling, and integrates SCADA telemetry so condition-based work orders generate before failure. The same platform that ran this plant's 18-month transformation is the one you can start on your own assets today.